Chapter 17
Ten Free Data Science Tools and Applications
In This Chapter
![]() Getting creative with free R packages for data visualization
Getting creative with free R packages for data visualization
![]() Using open-source tools for scraping, collecting, and handling your data
Using open-source tools for scraping, collecting, and handling your data
![]() Analyzing your data with free open source tools
Analyzing your data with free open source tools
![]() Having fun with visualizations in other open-source applications
Having fun with visualizations in other open-source applications
Visualizations are a vitally important part of the data scientist’s toolkit. With them, you can leverage the brain’s capacity to quickly absorb visual information. Because data visualizations are a very effective means of communicating data insights, many tool and application developers work hard to ensure that the platforms they design are simple enough for even beginners to use. An application that is simple enough to be useful to a beginner can sometimes be useful to more advanced data scientists, but other times data science experts simply need more technical tools to help them delve deeper into datasets.
In this chapter, I present ten free web-based applications that you can use to do more advanced data science tasks. You can download and install many of these applications on your home machine and most of the downloadable applications are available for multiple operating systems.
 Always make sure to read and understand the licensing requirements of any app you use. Protect yourself by determining how you’re allowed to use the products you’ve created.
Making Custom Web-Based Data Visualizations with Free R Packages
The packages and tools that I introduce in this section are useful for creating really cool data visualizations, but they require you to code in R statistical programming language to be able to use them. This said, because you have to code things up yourself with these packages and tools, you can create results that are more customized for your needs.
In this section, I discuss using Shiny, rCharts, and rMaps to create really neat-looking web-based data visualizations.
Getting Shiny by RStudio
Not long ago, if you needed to do serious data analysis, you’d need to know how to use a statistics-capable programming language like R. And if you needed to make interactive web visualizations, you’d have to know how to code in languages like JavaScript or PHP. Of course, if you wanted to do both simultaneously, you’d have to know how to code in an additional two or three more programming languages. In other words, web-based data visualization based on statistical analyses was a cumbersome task.
The good news is that things have changed. Because of the work of a few dedicated developers, the walls between analysis and presentation have crumbled. With the 2012 launch of RStudio’s Shiny package (http://shiny.rstudio.com), both statistical analysis and web-based data visualization can be carried out in the same framework.
RStudio — already, by far, the most popular integrated development environment (IDE) for R — developed the Shiny package to allow R users to create web apps. Web apps made in Shiny run on a web server and are interactive (with them, you can interact with the data visualization and do things like move sliders, check boxes, or click on the data itself). Because these apps run on a server, they’re considered live — when you make changes to the underlying data, those changes are automatically reflected in the appearance of the data visualization. Web apps created in Shiny are also reactive — in other words, they output updates instantly in response to a user interaction, without the user having to click a Submit button.
If your goal is to quickly use a few lines of code to instantly generate a web-based data visualization application, you can use R’s Shiny package to do this. What’s more, if you want to customize your web-based data visualization app to be more aesthetically appealing, you can do that by simply editing the HTML, CSS, and JavaScript that underlie the Shiny application.
Because Shiny produces server-side web apps, you’ll need a server host and you’ll need to know how to host your web app on a server before you can make useful web apps using the package.
 Shiny runs a public web server called ShinyApps.io (www.shinyapps.io). You can use that service to host an app there for free, or you can pay to host there if your requirements are more resource intensive.
Charting with rCharts
Although R has always been famous for its beautiful static visualizations, only recently has it been possible to use R to produce web-based interactive data visualizations.
Things changed with the advent of rCharts (www.rcharts.io). rCharts is an open-source package for R that takes your data and parameters as input, and then quickly converts those to a JavaScript code block output. Code block outputs from rCharts can use one of many popular JavaScript data visualization libraries, including NVD3, Highcharts, Richskaw, xCharts, Polychart, and Morris.
To see some examples of data visualizations created using rCharts, check out rCharts Gallery (www.rcharts.io/gallery). In this gallery, you’ll see data graphics as simple as standard bar charts and scatter plots, as well as more complex data graphics like chord diagrams and hive plots.
Mapping with rMaps
rMaps (http://rmaps.github.io) is the brother of rCharts. Both of these open-source R packages were crafted by Ramnath Vaidyanathan. Using rMaps, you can create animated or interactive chloropleths, heat maps, or even maps with annotated location droplets — like those found in the JavaScript mapping libraries Leaflet, CrossLet, and Data Maps.
If your goal is to create a spatial data visualization that has interactive sliders that users can move to select the data range they want to see, then rMaps offers you a perfect solution.
 If you’re an R user and you’re accustomed to using the simple R Markdown syntax to create web pages, you’ll be happy to know that it’s easy to embed both rCharts and rMaps in R Markdown.
 If you prefer Python to R, Python users aren’t being left out on this trend of creating interactive web-based visualizations within one platform. Python users can use server-side web app tools like Flask (a less user-friendly, but more powerful tool than Shiny) and the Bokeh and Mpld3 modules to create client-side JavaScript versions of Python visualizations. The Plot.ly tool has a Python API (as well as ones for R, MATLAB, and Julia) that you can use to create web-based interactive visualizations directly from your Python IDE or command line.
Checking Out More Scraping, Collecting, and Handling Tools
You can use web scraping to derive really interesting and unique datasets for your data-driven stories. In this section, I fill you in on the free tools that you can use to scrape data or images. These include Import.io, ImageQuilts, and DataWrangler.
Scraping data with Import.io
Have you ever tried to copy and paste a table from Wikipedia into a Microsoft Office document and then not been able to get the columns to line up correctly? Frustrating, huh? This is exactly the pain point that Import.io (pronounced “import eye oh”) was designed to address.
Import.io (https://import.io) is a free desktop application that, with a few clicks of the mouse, you can use to painlessly copy, paste, clean, and format any part of a web page. You can even use Import.io to automatically crawl and extract data from multipage lists.
Using Import.io, you can scrape data from a simple or complicated series of web pages:
- To scrape a simple series of web pages, access them through simple hyperlinks, in Page 1, Page 2, Page 3, … series.
- To scrap a complicated series of web pages, fill in a form or choose from a drop-down list, and submit your scraping request to the tool.
Import.io’s most impressive feature is its capability to observe a few mouse-clicks to learn what you want, and then offer you ways that it can automatically complete your tasks for you. This method circumvents most of the risk involved in automated computer tasking. That’s because, in Import.io, every step depends upon human input. Consequently, these human-augmented interactions lower the risk that the machine will draw an incorrect conclusion because of overguessing.
Collecting images with ImageQuilts
ImageQuilts (www.imagequilts.com) is a Google Chrome extension developed in part by legendary Edward Tufte, one of the first great pioneers in data visualization — he popularized the metric “data-to-ink ratio” to judge the effectiveness of charts.
The task ImageQuilts performs is deceptively simple to describe but very complex to implement. ImageQuilts makes collages of tens of images, and pieces them all together into one “quilt” that’s comprised of multiple rows of equal height. The reason this task is more complex than it may sound is that the source images are almost never the same height. ImageQuilts scrapes and resizes the images before stitching them together into one output image. The image quilt shown in Figure 17-1 was derived from a “Labeled for Reuse” Google Image Search of the term data science.

Figure 17-1: An ImageQuilts output from the Google Image search term data science.
ImageQuilts even allows you to choose the order of images or to randomize them. You can use the tool to drag and drop any image to any place, remove an image, zoom all images at once, or zoom each image individually. You can even use the tool to covert the images in color, grayscale, or inverted color — which is handy for making contact sheets of negatives, if you’re one of those rare people who still processes analog photography.
Wrangling data with DataWrangler
DataWrangler (http://vis.stanford.edu/wrangler) is an online tool that’s supported by the University of Washington Interactive Data Lab — but, at the time it was developed, this group was called the Stanford Visualization Group. This is the same group that developed Lyra (www.idl.cs.washington.edu/projects/lyra), an interactive data visualization environment that you can use to create complex visualizations without programming experience.
If your goal is to sculpt your dataset (or clean things up by moving things around like a sculptor would — split this part in two, slice off that bit and move it over there, push this down so that everything below it gets shifted to the right, and so on), DataWrangler is the tool for you.
The kinds of manipulations you can do with DataWrangler are similar to what you can do in Excel using Visual Basic. An example of this type of task is using DataWrangler or Excel with Visual Basic to copy, paste, and format information from lists on the Internet.
DataWrangler is so great that it suggests actions based on your dataset, and can even repeat complex actions across entire datasets — actions like eliminating skipped rows, splitting data from one column into two, turning a header into column data, and so on. DataWrangler is also great for showing you where there is missing data.
Missing data can indicate a formatting error that needs to be cleaned up.
Checking Out More Data Exploration Tools
Visualization is important for clarifying and communicating your data’s meaning, but careful data analysis is even more important. In this section, I introduce you to a few free tools that you can use for some advanced data analysis tasks. These tools include Tableau Public, Gephi, and WEKA.
Talking about Tableau Public
Tableau Public (http://public.tableausoftware.com) is a free desktop application that aims to be a complete package for chart making. Tableau Public is just the free version of Tableau Desktop. As part of the freeware limitation, the application doesn’t let you save files locally to your computer. All your work must be uploaded to Tableau Public’s cloud server, unless you purchase the software.
Tableau Public creates three levels of document:
- Worksheet: The Worksheet is where you can create individual charts from data you’ve imported from Access, Excel, or a text-format CSV file. You can then use Tableau to easily do things like choose between different data graphic types or drag columns onto different axes or subgroups.
There is a bit of a learning curve in getting to know the flow of the application and its nomenclature — for example, dimensions are categorical data while measures are numeric data.
Tableau offers many different default chart types — bar charts, scatter plots, line charts, bubble charts, Gantt charts, and even geographical maps. Tableau Public can even look at the type of data you have and suggest types of charts that you can use to best represent it. As an example of this, imagine you have two dimensions and one measure. In this situation, a bar chart is a popular choice because you have two categories of data and only one numeric measure for those two categories. Whereas if you have two dimensions and two measures, a scatter plot may be a good option because the scatter plot data graphic allows you to visualize two sets of numerical data for two categories of data.
- Dashboard: You can use a Tableau Dashboard to combine charts with text annotations or with other data charts. You can also use the Dashboard to add interactive filters, like check boxes or sliders, so users can interact with your data to only visualize certain time series or categories.
- Story: With a Tableau Story, you can combine several dashboards in a sort of slideshow presentation that shows a linear story in your data.
You can use Tableau Public’s online gallery to share all the worksheets, dashboards, and stories that you generate within the application. You can also embed them into websites that link back to the Tableau Public cloud server.
Getting up to speed in Gephi
Remember back in middle school how you were taught to use graph paper to do math and then draw graphs of the results? Well, apparently that nomenclature is incorrect. Those things with an x-axis and y-axis are actually called charts. Graphs are network topologies.
If this is your first introduction to network topologies, welcome to this weird and wonderful world. You’re in for a voyage of discovery. Gephi (https://gephi.org) is an open-source software package you can use to create graph layouts and then manipulate them to get the most clear and effective results. The kinds of connection-based visualizations you can create in Gephi are very useful in all types of network analyses — from social media data analysis to an analysis of protein-protein interactions or horizontal gene transfers between bacteria.
To illustrate a network analysis, imagine that you want to analyze the interconnectedness of people in your social networks. Here, you can use Gephi to quickly and easily present the different aspects of interconnectedness between your Facebook friends. So, imagine that you’re friends with Alice. You and Alice share 10 of the same friends on Facebook, but Alice also has an additional 200 friends with whom you are not connected. One of the friends you and Alice share is named Bob. You and Bob share 20 of the same friends on Facebook, too, but Bob has only 5 friends in common with Alice. On the basis of shared friends, it’s easy to surmise that you and Bob are the most similar, but you can use Gephi to visually graph the friend links between yourself, Alice, and Bob.
Figure 17-2 is a moderate-sized graph that was created in the Gephi application. This graph shows which characters appear in the same chapter as which other characters in Victor Hugo’s immense novel Les Misérables. The larger bubbles indicate that these characters appear most often, and the more lines attached to a bubble, the more he or she co-occurs with others — the big one in the center is Jean Valjean.
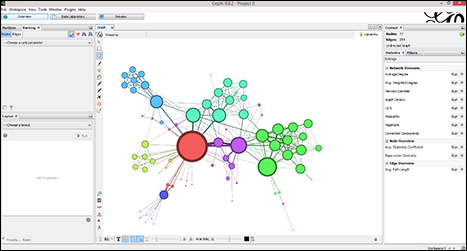
Figure 17-2: This is a moderate-sized graph on characters in Les Misérables.
When you use Gephi, the application automatically colors your data into different clusters. The cluster of characters in the upper-left of Figure 17-2 mostly only appear with each other (they’re the friends of Fantine, like Félix Tholomyès — if you’ve only seen the musical, they don’t appear in that production). These characters are only connected to the rest of the book’s characters through one character, Fantine. Were there a group of characters that only appear together and never with any other characters, they would be in a separate cluster of their own and not attached to the rest of the graph in any way. This is how network analysis works and how it’s done in the Gephi program.
Figure 17-3 shows a graph of the United States power grid, and the degrees of interconnectedness between thousands of power generation and power distribution facilities. This type of graph is commonly referred to as a hairball graph, for obvious reasons. There are ways to make it less dense and more visually clear, but doing this is as much of an art as it is a science.
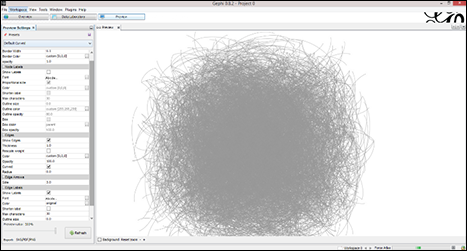
Figure 17-3: A Gephi hairball graph of the U.S. power grid.
Machine learning with the WEKA suite
Waikato Environment for Knowledge Analysis (WEKA; www.cs.waikato.ac.nz/ml/weka) is a popular suite of machine-learning tools that was written in Java and developed at the University of Waikato, New Zealand.
WEKA is a standalone application that you can use to analyze patterns in your datasets and then visualize those patterns in all sorts of interesting ways. For advanced users, WEKA’s true value is derived from its suite of machine-learning algorithms that you can use to cluster or categorize your data. WEKA even allows you to run different machine-learning algorithms in parallel, to see which ones perform most efficiently. WEKA can be run through a graphical user interface (GUI) or by command line. Thanks to the very well-written “Weka Wiki” documentation, the learning curve for WEKA is not as steep as one would expect for a piece of software this powerful.
Checking Out More Web-Based Visualization Tools
You can use a variety of free web apps to easily generate unique and interesting data visualizations. The tools in this section are just two examples.
Getting a little Weave up your sleeve
Web-based Analysis and Visualization Environment, or Weave (www.oicweave.org), is the brainchild of Dr. Georges Grinstein at the University of Massachusetts, Lowell. Weave is an open-source, collaborative tool that uses Adobe Flash to display data visualizations.
Because Weave relies on Adobe Flash, it won’t be accessible by all browsers, particularly those on Apple mobile devices — iPad, iPhone, and so on.
The Weave package is Java software designed to be run on a server with a database engine like MySQL or Oracle, although it can be run on a desktop computer so long as a local host server (like Apache Tomcat) and database software are both installed. Weave offers an excellent Wiki that explains all aspects of the program, including installation on Mac, Linux, or Windows.
Installing Weave on the Windows OS is easiest because of Weave’s single installer that installs the desktop middleware, as well as the server, and database dependencies. For the installer to be able to install all this, though, you need to make sure that you’ve first installed the free Adobe Air run-time environment on your machine.
Weave is great because you can use it to automatically access countless open datasets or simply upload your own. You can use Weave to generate multiple interactive visualizations, like charts and maps that allow your users to efficiently explore even the most complex datasets.
If your goal is to create visualizations that allow your audience to see and explore the interrelatedness between subsets of your data, then Weave is the perfect tool for this type of task. Another awesome feature in Weave is that, if you update your underlying data source, your data visualizations update in real time also.
Figure 17-4 shows a demo visualization on Weave’s own server. It depicts every county in the United States, with many columns of data from which to choose. In this example, the map shows county-level obesity data on employed women who are 16 years of age and older. The chart at the bottom left shows that there’s a correlation between obesity and unemployment in this group.
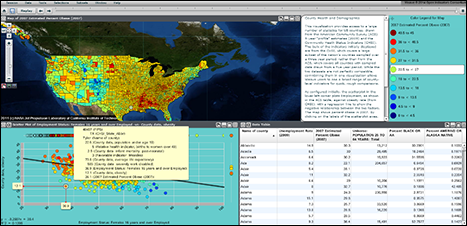
Figure 17-4: A chart, map, and data table in Weave.
Checking out Knoema’s data visualization offerings
You can use Knoema’s (www.knoema.com) data-visualization tools to create visualizations that enable your audience to easily explore data, drill down on geographic areas or on different indicators, and automatically produce data-driven timelines. Using Knoema, you can quickly export all results into PowerPoint files, Excel files, PDFs, JPG images, or PNG images, or even embed them on your website.
If you embed the data visualizations in a webpage of your website, those visualizations will automatically update if you make changes to the underlying dataset.
Figure 17-5 shows a chart and a table that were automatically generated with just two mouse clicks in Knoema. One click was to select indicators by country, and the other was to select Urban Population (percent of total). From here, the data can be exported, further explored, saved, or embedded in an external website.

Figure 17-5: An example of data tables and charts in Knoema.
You can use Knoema to make your own dashboards, too. You can make dashboards from your own data or from open data in Knoema’s repository. Figures 17-6 and 17-7 show dashboards that were quickly created from Knoema’s Eurostat data on capital and financial accounts.
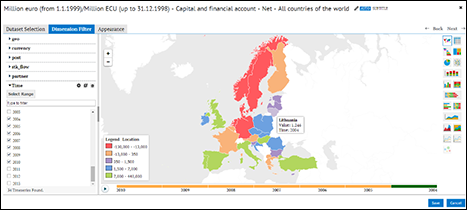
Figure 17-6: A map of Eurostat data in Knoema.
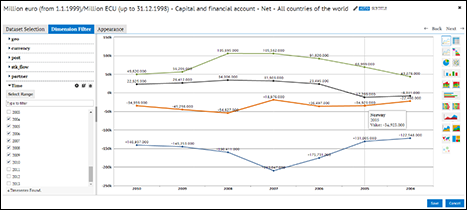
Figure 17-7: A line chart of Eurostat data in Knoema.