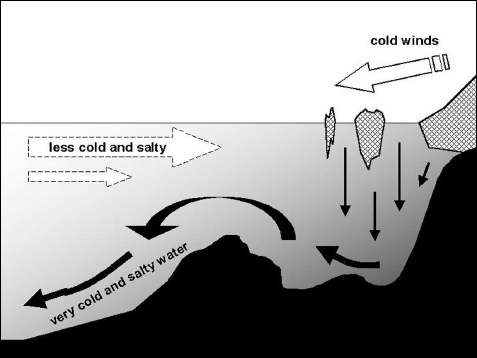
FIGURE 8.1 Deep-water formation. When seawater freezes, very cold and salty water is formed and sinks to the bottom of the sea, to be replaced by a drift of less dense and cold water from lower latitudes.
Few scientists give credence to the idea that water has memory, if by that is understood memory at the scale of a single or a few H2O molecules.1 However, the great masses of water on Earth do undoubtedly have memory in the sense that they retain the mark of past environments. Ice contains most of the fresh water on our planet (table 6.1). As many as a million years of changing atmospheric composition and climate are recorded in the accumulations of snow changed to ice, and some 420,000 years of these “archives” have been deciphered.2 Even a very small ice sample contains very large numbers of hydrogen and oxygen atoms, and the ratios of the different hydrogen and oxygen isotopes, measured at different depths in the ice, tell the story of past variations of atmospheric temperatures and global ice amounts. Winds of the past transported dust from ancient deserts to the polar caps and, falling with the snow (then covered by the following year’s snow), the dust remains in the ice today. Even more remarkably, trapped air bubbles tell us what the atmosphere was like thousands—indeed hundreds of thousands—of years ago. Extracting ice cores from the 2-km (1.2 mi.) thick layers of ice covering Greenland and Antarctica, glaciologists retrieve a faithful record of past climates going back over 400,000 years. Mountain glaciers too consist of ice from accumulated snowflakes, some of which fell over 20,000 years ago. But the downhill flow of glaciers distorts the ice layers, complicating the analyses. Usually, the bodies of unlucky climbers and skiers fallen into crevasses turn up at the outflow not more than several decades later, but sometimes they only are discovered after a much longer delay, as in the case of the hunter Ötzi found virtually intact with his clothes, arrows, and other equipment, after several thousands of years buried by snow in the Tyrolean Alps. To the extent that the ice remains frozen for long periods, such water in solid form does have memory. Liquid fresh water does not, subject as it is to continual renewal, spending just a short time in the atmosphere or on the surface between condensation, precipitation, and evaporation, or falling and flowing into the salty sea. The only exception: water deep underground, such as “fossil” water under the Sahara or in the Ogallala aquifer of the western Great Plains since several thousand years, or much older and not so fresh water such as the brines found deep under the Paris area.
Some “memory” does exist in the oceans, which contain in liquid but salty form nearly all (97%) the water on our planet. Although renewal or rather mixing of this water takes place in times quite short compared with solid-Earth processes, it still takes hundreds of years or more, so that traces of the past are not immediately mixed up and wiped out. They do, however, require interpretation. Water of the top hundred fathoms of the ocean, refreshed in a few years, retains but little memory of its past. The surface layer loses water by evaporation, gains fresh water from rainfall and from the rivers that flow into the sea, and makes the circuit of the ocean basins in the wind-driven currents. Even so, ocean waters affected by a climate anomaly—for example, off Peru during an El Niño—retain some trace of those conditions when they arrive elsewhere (for example, off the coast of Japan) ten or twenty years later. To keep track of what is going on, oceanographers must plunge into the third dimension and study the deeper ocean layers. Surface layers exchange water in different forms with the atmosphere, with no immediate effects on the abyssal depths, but ultimately mixing does occur. Purely mechanical processes enter quickly into action. Along western coasts near the equator, off Peru and Ecuador in the Pacific except when El Niño comes, westward currents driven by the trade winds produce upwelling, in effect pumping deep water. Further away from the coast, east-west pressure differences in the water drive the equatorial countercurrent, flowing from west to east at a couple of hundred fathoms deep. On a research vessel drifting westward in the surface current, a scientist fishing for fresh tuna will see her line stretched to the east. With upwelling of water at some ocean locations, there must be downwelling somewhere else. Such downwelling occurs whenever a water mass has greater density than the water beneath.
The density of seawater depends on its temperature and its salinity (salt content), with cold salty water being the densest, fresh (rain) water less dense, ice still less. On average, seawater contains about 35 grams of various salts per liter (of which 30 g of ordinary salt, sodium chloride NaCl), but the proportion varies. The atmospheric portion of the water cycle operates as a still, producing fresh water. Solar-powered evaporation removes H2O molecules from the sea, leaving the salt behind dissolved in the water. Of course, some wind-borne droplets evaporate, leaving sodium chloride crystals carried off as salt spray by the wind, deposited here and there on boats, beaches, and inland. Wherever evaporation exceeds precipitation and river runoff, the sea surface layer gets saltier and saltier. In the Red Sea and the Mediterranean, salinity reaches 40 grams per liter. That may not seem to be much of a difference from 35, but as a result, Mediterranean water sinks at a meter per second once it finds its way over the (300-meter deep) threshold of the Strait of Gibraltar into the Atlantic. Although it slows down further on, this water of Mediterranean origin sinks to a depth of 1,000 meters, and it can be distinguished by its salinity all the way to the Gulf of Mexico. In a similar way, the super-salty waters of the Red Sea spill into the Arabian Sea. And where the water can’t go anywhere but just evaporates under the Sun, as in the Dead Sea (Israel, Palestine, and Jordan) or Utah’s Great Salt Lake, high salinity makes the brine so dense that it can support a swimmer (usually a tourist posing for a picture) without swimming.
In the tropical zones of the major ocean basins, abundant sunshine produces strong evaporation while heating the water. Surface waters of the western Pacific, spreading eastward during an El Niño event, reach temperatures of 30°C (86°F) or higher. But abundant rainfall keeps this “warm water pool” from becoming very salty, and the warm surface waters float above cooler denser waters. I’ve already mentioned that the Atlantic and Indian Oceans export water to the continents, losing more water by evaporation than they gain by precipitation. For the Pacific, the opposite holds, making its surface waters generally less salty than the Atlantic’s. Away from the Tropics, as evaporation weakens, salinity drops. Lower salinity also holds near the coast, especially at the mouths of great rivers bringing fresh water back to the sea. With abundant influx from the Ganges and Irrawaddy Rivers, the Bay of Bengal, east of India, is far less salty than the Arabian Sea, receiving fresh water from the Indus River, but much less, and losing fresh water by strong evaporation all around Arabia, as in the warm and salty Red Sea and Persian Gulf.
Around the poles, precipitation and river influx bring more water to the oceans than they lose by evaporation, but another process—freezing—plays the key role in determining salinity. Fresh water freezes at 0°C (32°F), but depending on its salt content, seawater’s freezing point can be 1 to 2°C (1.8–3.6°F) lower. Furthermore, when seawater freezes, the ice contains less salt than the liquid water left behind. If you melt sea ice floating in the Arctic Ocean, or on the edge of a very cold beach (not in France or even Scotland, but in northern Canada, Alaska, or Siberia), you won’t get fresh water, but with only 10 to 15 grams of salt per liter, it will be a lot less salty than the seawater. When sea ice forms, it leaves very cold and very salty liquid water behind, water so dense that it sinks to the bottom of the sea. All around Antarctica, along the edges of the ice pack, under the ice shelves, and especially in the Weddell Sea, this process pours cold and very salty water into the bottom of the Southern Ocean. The resulting layer, called Antarctic Bottom Water (AABW), spreads out along the bottom, filling up the abyssal plains. Advancing north around the mid-ocean ridges, it keeps its salty “personality” as far as the equator and even beyond. The same process operates up north in a more concentrated pattern along the edges of the ice pack, between the Arctic and the North Atlantic (fig. 8.1). Some of these phenomena reverse when sea ice melts, as some of it does each summer, releasing a layer of less salty water. From 1968 to 1972 a large mass of such less-salty water drifted from the east coast of Greenland to Newfoundland and continued on with its distinct low salinity to the north of Scotland in 1976 and up to Spitsbergen in 1979. Interacting with the North Atlantic Oscillation, this “Great Salinity Anomaly” certainly had some influence on weather in western Europe and eastern Canada.
The dense cold salty water flows south along the sea floor, channeled by the continental shelves and the mid-ocean ridges into a powerful undersea stream. As with the spread of the Antarctic Bottom Water, the northern bottom waters keep their personality even south of the equator. Acoustic sounding of ocean depth began in the nineteenth century, and more or less detailed maps of the sea floor have existed for many years, although some results obtained by the United States and Soviet navies during the Cold War, especially in the cold oceans, were secret until very recently. Practically no deep-water passages link the Arctic and Pacific Oceans. On the Atlantic side, by contrast, the cold salty water pouring into the bottom of the Norwegian, Iceland, Greenland, and Barents Seas moves south, surging over an undersea ridge between Greenland and Scotland, flowing around the Faeroe Islands and Rockall3 to become North Atlantic Deep Water (NADW). Not only does this outflow make the circulation of the Atlantic profoundly different from that of the Pacific, it actually affects the whole world ocean.
FIGURE 8.1 Deep-water formation. When seawater freezes, very cold and salty water is formed and sinks to the bottom of the sea, to be replaced by a drift of less dense and cold water from lower latitudes.
How do we know what currents are flowing in the depths of the seas? Again, one way is to toss a “bottle” into the water, but this time it must sink to follow the flow. Instead of bottles, oceanographers have learned to use various types of easily tracked tracer particles. Seawater contains dissolved atmospheric carbon dioxide, with some of the carbon in the form of carbon-14, produced naturally from nitrogen by cosmic rays reaching the upper atmosphere, and easy to identify because of its radioactivity. The proportion of carbon-14 has varied with time. Over the last century, this is in part because fossil fuel burning has released to the atmosphere a substantial amount of CO2 containing practically no C-14. With a half-life less than 6,000 years, all of the C-14 that once existed in the organic material that ultimately became coal or oil decayed millions of years ago. Much more recently, between 1950 and 1964, some C-14 was produced by nuclear bomb testing in the atmosphere, and the propagation of that 15-year-short pulse can also be followed in the ocean’s depths. The same goes for the tritium (hydrogen-3) produced by the explosions, partly incorporated in the H2O of rainwater and then seawater, later decaying to form identifiable helium-3 that remains dissolved in the sea. Industrial production of chlorofluorocarbons (CFCs) began in 1938 and increased strongly in following decades, but was brought back down to nearly zero following the Montreal Protocol of 1987. These gases also dissolve in water, and no chemical reaction destroys them until they reach the stratosphere where they reinforce ozone depletion. Analysis of seawater at different depths shows that these different tracers, “bottles” tossed into the water for the most part only since the 1940s, have reached the bottom only near the poles, and not at all in the Tropics. Near Bermuda, tritium had reached depths no greater than 700 meters in 1970, but could be found at 2,000 meters in 1990. Off Brazil, at latitude 10° South, tritium is found in the topmost 700-meter layer; some traces have reached depths of 1,800 meters, none deeper. At high latitudes, on the other hand, the tritium “signal” coming from the atmosphere and the surface has reached bottom. This invasion of the lower depths does not necessarily proceed smoothly: southeast of Newfoundland, CFCs descended from 1,000 to 1,700 meters depth between 1983 and 1991, then sank to 2,000 meters, finally reaching bottom more than 4,500 meters (15,000 ft.) deep before 1995.
Following the tracers—for the most part chemical or radioactive pollutants—requires regular sampling of the water in different parts of the ocean. Tracking them as they drift toward lower latitudes in the deep sea, oceanographers can draw the three-dimensional map of the deep ocean current system, often called the thermohaline circulation because it depends on both temperature and salinity.4 There are other ways to sound the seas. In the Arctic, automatic measurement stations, put in place by air-supplied scientific expeditions, drift for years with the floating ice. Not only do they measure and relay standard weather data (temperature, pressure, wind in the near-surface air), they also monitor the state of the ice (several feet thick), and they measure physical, chemical, and even biological properties (temperature, electrical conductivity, flow speed, salinity, dissolved CO2, plankton, etc.) of underlying seawater down to 100 meters (330 ft.) deep. Instruments to measure the water’s drift are moored at depth in the strategic passages. In addition to instrument-carrying buoys drifting with surface currents, oceanographers have designed, built, and released hundreds of buoys drifting at constant depth. These automatic underwater observatories determine their positions by analysis of acoustic signals emitted from a number of known fixed points, and return to the surface from time to time to send the recorded data back to the oceanographers by satellite relay.
The heat content of an entire ocean basin can also be estimated, and not only with thermometers.5 The speed of sound waves in water depends on the water’s temperature as well as pressure and salinity, and at low frequencies (less than 600 hertz or cycles per second), these sound waves can travel enormous distances without any significant attenuation. Having set up a number of sound emitters and receivers around the western Mediterranean, a French-German-Greek research team used acoustic tomography to draw a three-dimensional map of this nearly closed basin between Gibraltar and Sicily, analogous to the way in which computer-aided tomography (CAT) X-ray scans are used to map the inside of the human body. Other teams have used acoustic sounding to study what goes on under the ice pack near the Melville Islands of the Canadian (Inuit) Far North. Many oceanographers would like to do the same for the entire North Pacific, but this project has so far been blocked by the concern that powerful low-frequency sound waves might be harmful (or at least bothersome) to great whales. Maybe the project can be carried out using lower power.
Much has been learned since the 1950s, thanks to unclassified deep-water research made possible by the development of bathyscaphes and other manned research submersibles in the United States (research submarine Alvin and others), Belgium (FNRS), France (Cyana, Nautile, and others), Italy (Trieste), Japan (Dolphin 3K, Kaiko), and elsewhere. During the Cold War, much was also learned but kept secret by the American and Soviet navies, as they explored beneath the Arctic ice and in the deep ocean, looking for the best places to hide nuclear missile submarines. Much more will be learned in coming years as the international scientific community gets to work with these data, now finally being declassified. Although there has been some tendency for military research funding to decrease, some formerly Soviet scientific research institutes are being kept alive by Western funding, and the new cooperation between Americans and Russians should yield more generally useful scientific results than the earlier separate conduct of secret military research.
From the tropic of Cancer to the tropic of Capricorn, abundant sunshine—warming the surface and evaporating water—powers up the Hadley circulation, and this systematic overturning movement of the tropical atmosphere exerts its influence even at latitudes further north or south (fig. 7.1). Concentration and transport of solar energy in the form of latent heat (fig. 6.2) account for the violence of many meteorological phenomena. Below the surface, in the currents of the deep sea, the high-latitude “cold source” operates through the peculiar properties of freezing seawater to put into motion the planetary-scale overturning circulation channeled by the topography of the sea floor. Just as for the atmosphere, the Coriolis effect of Earth’s rotation induces east-west motions in the ocean, this effect adding to the force exerted on the sea’s surface by the winds. The sinking masses of cold salty water at high latitudes must be replaced, pulling in not-so-cold water from lower latitudes. As the sinking water leaves the Arctic zone to become North Atlantic Deep Water, the relatively narrow sea passages between Greenland, Iceland, and Scotland channel it into a powerful current of 14 million cubic meters of water per second, flowing south in the deep ocean between the continental shelf of the Americas and the mid-Atlantic ridge. Reaching the latitude of Cape Horn, there strengthened by Antarctic Bottom Water and caught up in the eastward circum-Antarctic flow, this mighty sea-floor stream brings cold and very salty water to the Indian and Pacific Oceans. There, it finally mixes with intermediate-level and surface water. While some of the water continues drifting east in the Southern Ocean, other water masses approach the Tropics, and at the surface they return west under the prevailing trade winds, warming under the Sun. Caught up in the Agulhas current of the western Indian Ocean, and flowing around South Africa, these warmed waters make the long journey all the way to the North Atlantic, where they reinforce the Gulf Stream. This Atlantic warm water drift transports heat northward all the way from the Cape of Good Hope to the Norwegian Sea. Still lukewarm (or rather not very cold) with temperatures of 12 to 14°C (54–57°F) off the Newfoundland coast, this water gradually transfers heat and humidity to the atmosphere and, by way of the westerly winds, to much of Europe, maintaining a mild climate east of the North Atlantic. The water finally becomes truly cold in the Greenland and Norwegian Seas; some emerges in the Labrador Sea, but the coldest and saltiest water sinks back to the bottom, completing the giant loop and starting it over again. Overall, omitting many details—but remember, details are important, and not only locally—the waters at the surface of the Atlantic drift generally from south to north and bring heat with them, while at the bottom the current flows from north to south, taking “cold” along with it.6 Oceanographers have named this combined planetary-scale system of surface and deep-sea currents linking the Arctic and Antarctic zones and all the world’s oceans “the great ocean conveyor belt,” which they term “conveyor-belt circulation” (fig. 8.2). The complete tour may take a thousand years or more. Somewhere at the bottom of the sea, there must be water that sank from the surface during the “Little Ice Age” three centuries ago, carrying with it traces (isotope ratios) of those colder climes. The ocean remembers.
FORESEEABLE ACCIDENTS, OR SURPRISES?
Anything that happens in the atmosphere—for example, radioactive fallout—makes itself fairly rapidly felt at the bottom of the ocean near the poles, but transmission of the “signal” through the whole ocean takes much longer. Does this mean that the ocean’s “memory” and mass necessarily entail strong inertia of global climate, delaying any response to a sudden perturbation? Consulting the climate chronicles stored in polar ice, we find that we shouldn’t count on it. Analysis of the ice core record over the last 100,000 years and more reveals several sudden climate jumps, strong temperature changes in less than a century, perhaps even in only a decade or so. Moreover, the fluctuations were nearly simultaneous in both polar zones and at intermediate latitudes. For the most part, these jumps took place before the current interglacial began, i.e., between a cold climate and a very cold climate. One exception stands out: the cold snap called the younger Dryas, about 11,000 years ago, at a time when the ice caps had already been in retreat for a few thousand years. Since the end of the younger Dryas about 10,000 years ago, climates have been relatively stable, fluctuating within a fairly narrow margin. Had they not been so stable, would humans have developed agriculture, or persevered in it?
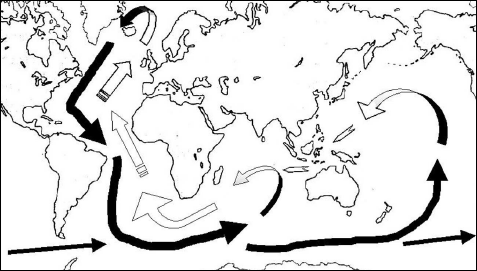
FIGURE 8.2 The great ocean conveyor belt, showing the deep ocean cold current (shaded belt) and the near surface drift (white arrows). The process illustrated in figure 8.1 forms North Atlantic Deep Water (NADW) between Greenland and Scandinavia in the north, and Antarctic Bottom Water (AABW) all around Antarctica in the south. Warming of the water finally returning to the surface occurs mainly in the Indian and Pacific Oceans.
Climate jumps are scary. (The French expression, faire froid dans le dos, appropriately evokes a shiver in your back, an icy fear.) What would happen in Europe, from France to Scandinavia, if temperatures were to plunge to values common in Nome (Alaska), with canals, rivers, and harbors icebound all winter, from October to May? Can we count on the stability of the conveyor-belt circulation? Uneasiness about this has developed since the discovery of the apparent coincidence of some of the cold crises with “Heinrich events.” In 1988 the German oceanographer Hartmut Heinrich noted that debris found at the bottom of the sea off the Norwegian coast included rocks that must have been stripped by glaciers from the Canadian (Laurentian) Shield. Armadas of icebergs calved from the ice cap must have carried the rocks across the Atlantic and finally dumped them next to Europe. If indeed such armadas of icebergs were involved, their melting must have released large masses of cold but relatively fresh water. This melt water, being less dense than the surrounding saltier water, would have formed a floating layer. By the same token, it would have blocked the sinking motion and so would have put a stop to the pulling in of warmer water from the south. Research groups in Germany and the United States have used relatively simple models to simulate this situation.7 Results suggest that a substantial but not unreasonably large increase in freshwater input to certain ocean areas would lead to partial or total shutdown of the conveyor-belt circulation, perhaps even for a very long time, leading to much more freezing in Europe than has been seen for 9,000 years.
Plenty of controversy still surrounds the hypothesis of the iceberg armada as an explanation for the younger Dryas thousand-year cold snap. Still, the question raised by Wallace Broecker (1997) of Lamont-Doherty Earth Observatory of Columbia University needs to be taken seriously: by changing the composition of the atmosphere, are we humans running the risk of triggering a sudden revolution in the way the climate system works, either by blocking the conveyor-belt circulation or by radically rearranging it? Certainly the anthropogenic emissions of gases such as CO2 tend to reinforce the greenhouse effect and so to warm the atmosphere. The consequences of such warming are still very hard to evaluate with regard to the changes in precipitation as well as to the accumulation of snow and ice and melting of ice caps, all of which determine freshwater flux to the ocean. There might be a bad surprise in store for us. In his book The Imperative of Responsibility, the philosopher Hans Jonas (1984) writes: “It is safer to pay heed to the prophet of doom than to the prophet of bliss.” In recent years it’s become quite fashionable to invoke the “precautionary principle,” which has made its way into international law. However, can we really reason on the basis of unpredictable events? How can we distinguish between unacceptable risks and unreasonable nightmare fantasies? Should we stop everything until scientists can totally eliminate uncertainty (not likely!) and enlarge the domain of predictability? All paths to the future (and we can’t help but go there!) are paths to the unknown, but it is plainly stupid to proceed without thinking, stepping on the gas in the fog, as if ignorance and uncertainty could eliminate risk.8