
Radiological imaging of the urinary tract
Uses of plain abdominal radiography (the ‘KUB’ X-ray—kidneys, ureters, and bladder)
Other urological contrast studies
Computed tomography and magnetic resonance imaging
When we talk about measuring kidney function, what we mean is measurement of glomerular filtration rate (GFR). This is regarded as the best measure of kidney function, and we grade the degree of renal impairment and renal failure according to the GFR. Normal GFR in young men is ~130mL/min per 1.73m2 of body surface area. In young women, it is 120mL/min per 1.73m2 of body surface area. Mean GFR declines with age (Table 3.1).
The ideal filtration marker is excreted by filtration alone. Exogenous markers that can be used to measure include inulin, iothalamate, ethylene diamine tetra-acetic acid (EDTA), diethylene triamine penta-acetic acid, and iohexol. Measurement of GFR using exogenously administered markers is complex and expensive and is difficult to do in routine clinical practice.
Urinary clearance of endogenous markers, such as creatinine, can be used to estimate GFR. Creatinine is a 113D-amino acid derivative that is freely filtered at the glomerulus. A timed urine collection and measurement of serum creatinine concentration allows calculation of GFR according to the formula:
where U is the concentration of urine in urine, P the concentration in plasma, and V the urine flow.
As an alternative, estimation of GFR can be made from simple measurement of serum creatinine, since the main mechanism of creatinine excretion is by glomerular filtration and GFR has a reciprocal relationship with serum creatinine. Thus, as GFR falls (indicating worsening renal function), creatinine rises. However, creatinine is not the ideal filtration marker since it is also excreted by proximal tubular secretion, as well as by glomerular filtration, and therefore, creatinine clearance exceeds GFR, i.e. creatinine clearance tends to overestimate GFR.
Since the endogenous production of creatinine is determined by muscle mass, serum levels of creatinine will not only vary according to renal function (glomerular filtration), but also according to age, body size, ethnic group, and sex. Taking account of these factors can overcome some of the limitations of measurement of serum creatinine alone.
Two creatinine-based equations have been widely used for calculating eGFR—the Cockcroft–Gault formula (derived from a ♂ inpatient population) and the Modification of Diet in Renal Disease (MDRD) equation [derived from patients with chronic kidney disease (CKD)]. The Cockcroft–Gault formula overestimates GFR because of tubular secretion of creatinine and the value is not adjusted for body surface area. More recently, the Chronic Kidney Disease Epidemiology Collaboration (CKD-EPI) equation has been developed and is now recommended by the National Institute for Health and Care Excellence (NICE) for routine use, as it is more accurate than the MDRD equation, is less biased at eGFR >60, and performs better in patients >75y.
The MDRD equation (modified in 2005; adjusts for body surface area) is:

The CKD-EPI equation is:
where Scr = serum creatinine (µmol/L); κ = 61.9 for ♀, 79.6 for ♂; α = – 0.329 for ♀, –0.411 for ♂; min = the minimum of Scr/κ or 1, max = the maximum of Scr/κ or 1.
The eGFR provides substantial improvements over serum creatinine measurements alone in the clinical assessment of renal function in terms of the detection, evaluation, and management of CKD (Table 3.1).
Table 3.1 Chronic kidney disease (CKD) classification
| Stage | eGFR (mL/min/1.73m2) | |
| 1 | Kidney damage with normal or  GFR GFR |
>90 |
| 2 | Mild decrease in GFR | 60–89 |
| 3 | Moderate decrease in GFR | |
| 3a | 45–59 | |
| 3b | 30–44 | |
| 4 | Severe decrease in GFR | 15–29 |
| 5 | Kidney failure | <15 |
Analysis for pH, blood, protein, glucose, and white cells can be done with dipstick testing.
Urinary pH varies between 4.5 and 8, averaging between 5.5 and 6.5.
Normal urine contains <3 RBCs per HPF (1000 erythrocytes/mL of urine; upper limit of 5000–8000 erythrocytes/mL). Positive dipstick for blood indicates the presence of Hb in the urine. Hb has a peroxidase-like activity and causes oxidation of a chromogen indicator which changes colour when oxidized. Sensitivity of urine dipsticks for identifying haematuria (>3 RBCs/HPF) is >90%; specificity is lower [i.e. a higher false-positive rate with the dipstick due to contamination with menstrual blood or dehydration (concentrates what RBCs are normally present in urine)].
Haematuria due to a urological cause does not elevate urinary protein. Haematuria of nephrological origin often occurs in association with casts, and there is almost always significant proteinuria.
Normal, healthy adults excrete about 80–150mg of protein per day in their urine (normal protein concentration <20mg/dL). Proteinuria suggests the presence of renal disease (glomerular, tubulo-interstitial, renal vascular) or multiple myeloma, but it can occur following strenuous exercise. The dipstick test is based on a tetrabromophenol blue dye colour change (green colour develops in the presence of a protein concentration of >20mg/dL).
Leucocyte esterase activity detects the presence of white blood cells (WBCs) in the urine. Leucocyte esterase is produced by neutrophils and causes a colour change in a chromogen salt on the dipstick. Not all patients with bacteriuria have significant pyuria. False negatives: concentrated urine, glycosuria, presence of urobilinogen, consumption of large amounts of ascorbic acid. False positives: contamination.
Nitrites in the urine suggest the possibility of bacteriuria. They are not normally found in the urine. Many species of Gram-negative bacteria can convert nitrates to nitrites, and these are detected in the urine by a reaction with the reagents on the dipstick, which form a red azo dye. The specificity of the nitrite dipstick for detecting bacteriuria is >90% (false-positive nitrite testing is contamination). Sensitivity is 35–85% (i.e. lots of false negatives); less accurate in urine containing fewer than 105 organisms/mL.
Cloudy urine that is positive for WBCs and nitrite-positive is very likely to be infected.
Determined by phase contrast microscopy. RBCs derived from the glomerulus are dysmorphic (they have been distorted by their passage through the glomerulus). RBCs derived from tubular bleeding (tubulo-interstitial disease) and those from lower down the urinary tract (i.e. urological bleeding from the renal pelvis, ureters, or bladder) have a normal shape. Glomerular bleeding is suggested by the presence of dysmorphic RBCs, RBC casts, and proteinuria.
A protein coagulum (principally, Tamm–Horsfall mucoprotein derived from tubular epithelial cells) formed in the renal tubule and ‘cast’ in the shape of the tubule (i.e. long and thin). The protein matrix traps tubular luminal contents. If the cast contains only mucoproteins, it is called a hyaline cast. Seen after exercise and heat exposure, and in pyelonephritis or chronic renal disease. RBC casts contain trapped erythrocytes and are diagnostic of glomerular bleeding, most often due to glomerulonephritis. WBC casts are seen in acute glomerulonephritis, acute pyelonephritis, and acute tubulo-interstitial nephritis.
Specific crystal types may be seen in the urine and help diagnose underlying problems (e.g. cystine crystals establish the diagnosis of cystinuria). Calcium oxalate, uric acid, and cystine are precipitated in acidic urine. Crystals precipitated in alkaline urine include calcium phosphate and triple phosphate (struvite).
•Urine collection for cytology: exfoliated cells lying in urine that has been in the bladder for several hours (e.g. early morning specimens) or in a urine specimen that has been allowed to stand for several hours are degenerate. Such urine specimens are not suitable for cytological interpretation. Cytological examination can be performed on bladder washings (using normal saline) obtained from the bladder at cystoscopy (or following catheterization) or from the ureter (via a ureteric catheter or ureteroscope). The urine is centrifuged, and the specimen obtained is fixed in alcohol and stained by the Papanicolaou technique.
•Normal urothelial cells are shed into the urine, and under the microscope, their nuclei appear regular and monomorphic (diffuse, fine chromatin pattern, single nucleolus).
•Causes of a positive cytology report (i.e. abnormal urothelial cells seen—high nuclear:cytoplasmic ratio, hyperchromatic nuclei, prominent nucleoli):
•Urothelial malignancy (TCC, SCC, adenocarcinoma).
•Previous radiotherapy (especially if within the last 12 months).
•Previous cytotoxic drug treatment (especially if within the last 12 months, e.g. cyclophosphamide, busulfan, ciclosporin).
•Renal adenocarcinoma (clear cell cancer of the kidney) usually does not exfoliate abnormal cells, although occasionally clusters of clear cells may be seen, suggesting the diagnosis.
•High-grade urothelial cancer and CIS exfoliate cells which look very abnormal, and usually the cytologist is able to indicate that there is a high likelihood of a malignancy. Low-grade bladder TCC exfoliates cells which look very much like normal urothelial cells. The difficulty arises where the cells look abnormal, but not that abnormal—here, the likelihood that the cause of the abnormal cytology is a benign process is greater.
•Sensitivity and specificity of positive urine cytology for detecting TCC of the bladder depends on the definition of ‘positive’—if only obviously malignant or highly suspicious samples are considered positive, then the specificity will be high. Urine cytology may be negative in as many as 20% of high-grade cancers. If ‘atypical cells’ are included in the definition of ‘abnormal’, the specificity of urine cytology for diagnosing urothelial cancer will be relatively poor (relatively high number of false positives) because many cases will have a benign cause (stones, inflammation).
(See also  pp. 332–333 and pp. 334–335.)
PSA is a 34-kDa glycoprotein enzyme produced by the columnar acinar and ductal prostatic epithelial cells. It is a member of the human kallikrein family, and its function is to liquefy the ejaculate, enabling fertilization. PSA is present in both benign and malignant cells, although the expression of PSA tends to be reduced in malignant cells and may be absent in poorly differentiated tumours. Large amounts are secreted into the semen, and small quantities are found in the urine and blood.
The function of serum PSA is unclear, although it is known to liberate insulin-like growth factor (IGF) type 1 from one of its binding proteins. Seventy-five per cent of circulating PSA is bound to plasma proteins (complexed PSA) and metabolized in the liver, while 25% is free and excreted in the urine. Complexed PSA is stable, bound to α-1 antichymotrypsin and α-2 macroglobulin. Free PSA is unstable, recently found to consist of two isoforms—pro-PSA is a peripheral zone precursor, apparently elevated in the presence of prostate cancer, and benign PSA (BPSA) is the transition zone precursor and associated with BPH. The half-life of serum PSA is 2.2 days. The normal range for the serum PSA assay in men is <4.0ng/mL, though this varies with age. Table 3.2 shows a published age-specific normal range (95th centile).
In the absence of prostate cancer, serum PSA concentrations also vary physiologically, according to race and prostate volume.
•Patient request, following counselling (see p. 336).
•Progressive bone pain, especially back pain.
•Unexplained anaemia, anorexia, or weight loss.
•Spontaneous thromboembolism or unilateral leg swelling.
•Monitoring of prostate cancer patients.
Table 3.2 Age-adjusted normal range for PSA
| Age range | Normal PSA range (ng/mL) |
| All ages | <4.0 |
| 40–49 | <2.5 |
| 50–59 | <3.5 |
| 60–69 | <4.5 |
| >70 | <6.5 |
A non-invasive method of urinary tract imaging. While it provides good images of the kidneys and bladder, anatomical detail of the ureter is poor and the mid ureter cannot be imaged at all by ultrasound because of overlying bowel gas.
•Determination of the nature of renal masses—can differentiate simple cysts (smooth, well-demarcated wall, reflecting no echoes; benign) from solid masses (almost always malignant; cystic masses with solid components or multiple septae or calcification may be malignant), from those casting an ‘acoustic shadow’ (stones) (Fig. 3.1).
•Can determine the presence/absence of hydronephrosis (dilatation of the collecting system) in patients with abnormal renal function (Fig. 3.2).
•Allows ultrasound-guided nephrostomy insertion in patients with hydronephrosis and renal impairment or with infected, obstructed kidneys.
•Measurement of post-void residual (PVR) urine volume.
•Allows ultrasound-guided placement of a suprapubic catheter.
•Measurement of prostate size (where gross prostatic enlargement is suspected on the basis of a DRE and surgery in the form of open prostatectomy is contemplated).
•To assist prostate biopsy (allows biopsy of hypo- or hyperechoic lesions).
•Investigation of azoospermia (can establish the presence of ejaculatory duct obstruction).
Can image the urethra and establish the depth and extent of spongiofibrosis in urethral stricture disease.
•Assessment of the patient complaining of a ‘lump in the testicle (or scrotum)’—can differentiate benign lesions (hydrocele, epididymal cyst) from malignant testicular tumours (solid, echo-poor, or with an abnormal echo pattern).
•When combined with power Doppler, can establish the presence/absence of testicular blood flow in suspected torsion.
•Assessment of testicular trauma (rupture is indicated by an abnormal echo pattern due to blood within the body of the testis; surrounding haematoma may be seen—blood within the scrotal soft tissues that has escaped through a tear in the tunica albuginea and the visceral and parietal layers of the tunica vaginalis; haematocele—blood contained by an intact parietal layer of the tunica vaginalis).
•Investigation of infertility—varicoceles and testicular atrophy may be identified.
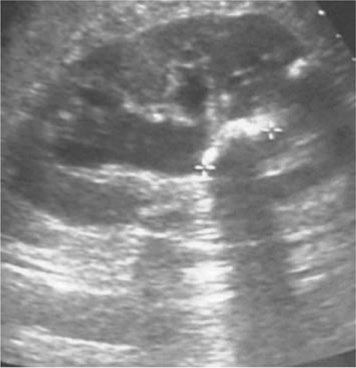
Fig. 3.1 An acoustic shadow cast by a stone within the kidney.
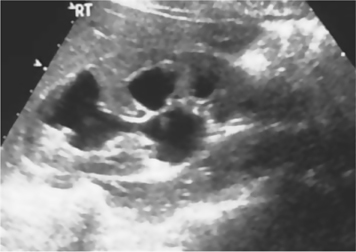
Fig. 3.2 Hydronephrosis. Urine in dilated calyces appears black (hypoechoic).
•For detection of stones and determination of their size and (to an extent) their location within the kidneys, ureters, and bladder (Fig. 3.3).
•Renal calculi: a calcification overlying the kidneys is intrarenal if it maintains its relationship to the kidney on inspiratory and expiratory films (i.e. if it moves with the kidney). If in doubt as to whether an opacity overlying the outline of the kidney is intrarenal or not, get an ultrasound (look for the characteristic ‘acoustic shadow’ within the kidney), IVU, or CT urinary tract (CT-KUB).
•Ureteric calculi: sensitivity for detection of renal calculi is in the order of 50–70% (i.e. the false-negative rate is between 30 and 50%; it misses ureteric stones when these are present in 30–50% of cases). CT-KUB or IVU, which relate the position of the opacity to the anatomical location of the ureters, are required to make a definitive diagnosis of a ureteric stone. However, once the presence of a ureteric stone has been confirmed by another imaging study (CT-KUB or IVU) and as long as it is radio-opaque enough and large enough to be seen, plain radiography is a good way of following the patient to establish whether the stone is progressing distally, down the ureter. It is not useful for ‘following’ ureteric stones that are radiolucent (e.g. uric acid) or small (generally a stone must be 3–4mm to be visible on plain X-ray), or when the stones pass through the ureter as it lies over the sacrum. Ability of KUB X-ray to ‘see’ stones is also dependent on the amount of overlying bowel gas.
•Plain tomography (a plain X-ray taken of a fixed coronal plane through the kidneys) can be useful but is rarely done nowadays, with the availability of ultrasound and CT.
•Opacities that may be confused with stones (renal, ureteric) on plain radiography: calcified lymph nodes, pelvic phleboliths (round, lucent centre, usually below the ischial spines).
•Look for the psoas shadow—obscured where there is retroperitoneal fluid (pus or blood) (Fig. 3.4).
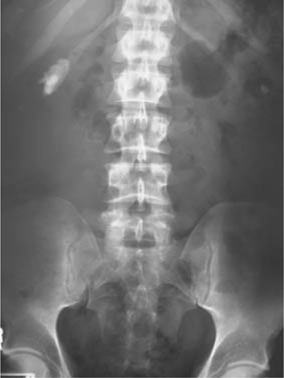
Fig. 3.3 Small staghorn calculus on KUB X-ray.
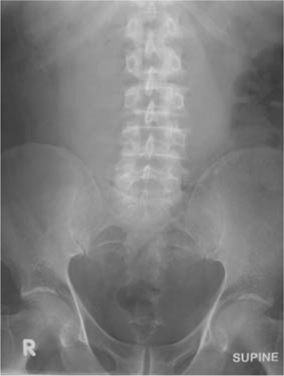
Fig. 3.4 Leaking AAA on plain X-ray; the right psoas shadow cannot be seen due to retroperitoneal haemorrhage.
Also known as intravenous pyelography (IVP). Now virtually obsolete in the era of CT-KUB scanning (non-contrast CTU) used for the investigation of acute loin pain and CTU (a contrast CT of the kidneys, ureters, and bladder). The reconstructed digital images obtained on CTU are superior to those of IVU. However, for the benefit of those urologists in other parts of the world where IVU may still be the standard method of upper tract imaging, the author has retained this section.
A control film is obtained before contrast is given. Intravascular contrast is administered, followed by a series of X-rays of the kidneys, ureters, and bladder over the following 30min or so, to image their anatomy and pathology and to give some indication of renal function.
•Radio-opacity of contrast agents depends on the presence of a tri-iodinated benzene ring in the molecule.
•Ionic monomers (sodium and meglumine salts) ionize, thereby producing high-osmolality solutions (e.g. iothalamate—Conray®, diatrizoate—Hypaque®, Urografin®).
•Non-ionic monomers—low osmolality (e.g. iopamidol—Niopam®, iohexol—Omnipaque®).
•At a concentration of 300mg of iodine per mL, ionic monomers have an osmolality five times higher than plasma, compared with non-ionic monomers which have an osmolality twice that of plasma.
•Excreted from plasma by glomerular filtration.
•Plain film: looking for calcification overlying the region of the kidneys, ureters, and bladder.
•Nephrogram phase: first phase of IVU; film taken immediately following IV administration of contrast (peak nephrogram density). The nephrogram is produced by filtered contrast within the lumen of the proximal convoluted tubule (PCT) (it is a proximal tubular, rather than distal, tubular phenomenon).
•Pyelogram phase: as the contrast passes along the renal tubule (into the distal tubule), it is concentrated (as water is absorbed, but the contrast agent is not). As a consequence, the contrast medium is concentrated in the pelvicalyceal system and thus this ‘pyelogram’ phase (Fig. 3.5) is much denser than the nephrogram phase. The pyelogram phase can be made denser by dehydrating the patient prior to contrast administration. Pelvic compression can be used to distend the pelvicalyceal system and demonstrate their anatomy more precisely. Compression is released and a film taken (20–30min) (Fig. 3.6).
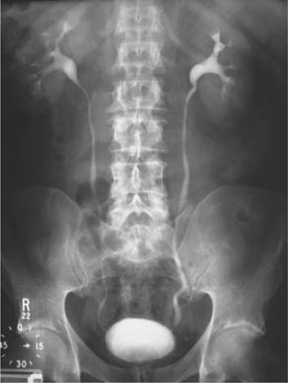
Fig. 3.5 Normal IVU at 15min.
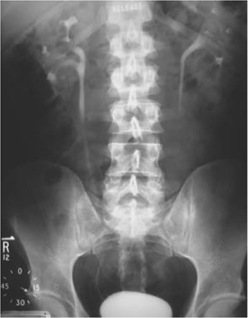
Fig. 3.6 Normal IVU at 20min. Lower abdominal compression has been released.
•Occur in 1% of patients given non-ionic and 5% given ionic contrast media.
•The most serious reactions represent an anaphylactic reaction—hypotension with flushing of the skin (marked peripheral vasodilatation), oedema (face, neck, body, and limbs), bronchospasm, urticaria. Rarely, cardiac arrest can occur. The death rate, as a consequence of these reactions, is 1 in 40 000 to 1 in 70 000 with the ionic media and 1 in 200 000 with non-ionic contrast agents.
•A contrast reaction is more likely to occur in patients with an iodine allergy, previous contrast reaction, asthma, multiple other allergies, and heart disease and is less likely with non-ionic contrast media. Steroid premedication (at least 12h before) can reduce the risk of a contrast reaction.
•Contrast media are also nephrotoxic. Ten per cent of patients with a raised creatinine will develop an increase in creatinine after an IVU (more likely in diabetics, with dehydration, and with large contrast doses). The increase in creatinine usually resolves spontaneously.
•Investigation of haematuria—detection of renal masses, filling defects within the collecting system of the kidney and within the ureters (stones, TCCs).
•Localization of calcification overlying the urinary tract (i.e. is it a stone or not?).
•Investigation of patients with loin pain (e.g. suspected ureteric colic). Increasingly being replaced with CTU which has superior sensitivity and specificity.
•Very good for identification of congenital urinary tract abnormalities (e.g. ureteric anatomy in duplex systems; Fig. 3.7), malrotation, horseshoe kidneys.
•Used for follow-up of post-ureteric surgery to identify strictures.
•There is a trend towards IVU being replaced by MDCTU (a rapid-acquisition CT done following IV contrast administration, with high spatial resolution) at least in the investigation of haematuria and of loin pain. To a large extent, whether one uses IVU or MDCTU depends on the availability of the latter in your radiology department.
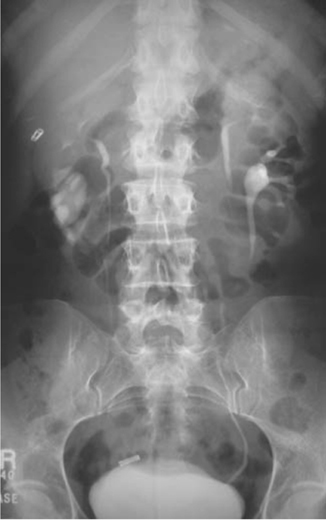
Fig. 3.7 Bilateral duplex as seen on a tomogram from IVU.
(See Fig. 3.8.)
To identify the presence of vesicoureteric reflux (VUR) during filling and emptying of the bladder and the presence and site of obstruction in the outlet of the bladder and within the urethra, particularly in patients with neuropathic bladder problems [e.g. spinal cord injury (SCI)].
Retrograde filling of the bladder via a catheter with contrast. Identifies vesicocolic and vesicovaginal fistulae and bladder rupture (extraperitoneal and intraperitoneal).
(See Fig. 3.9.)
Retrograde filling of the urethra with contrast, to identify the site and length of urethral strictures (Fig. 3.10) or the presence, extent, and site of urethral injury (in pelvic fracture, for example).
Retrograde filling of an ileal conduit with contrast, to establish the presence of free reflux into the ureters (a normal finding; absence of free reflux suggests obstruction at the uretero-ileal junction due to ischaemic stenosis or recurrent TCC in the ureters at the uretero-ileal junction) and the presence of TCCs in the ureters or renal pelvis (an occasional finding in patients who have had a cystectomy for bladder TCC with ileal conduit urinary diversion).
Retrograde instillation of contrast into the ureters by a ureteric catheter inserted into the ureter via a cystoscope (rigid or flexible). Provides excellent definition of the ureter and renal pelvis for detection of ureteric and renal pelvic TCCs or radiolucent stones in patients with persistent haematuria where other tests have shown no abnormality. Also used to diagnose the presence and site of ureteric injury (obstruction, ureteric leak) in cases of ureteric injury (e.g. post-hysterectomy or Caesarean section).
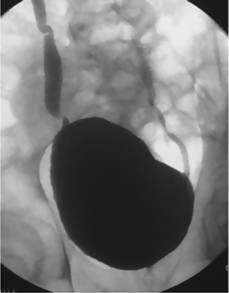
Fig. 3.8 VCUG showing bilateral ureteric reflux.
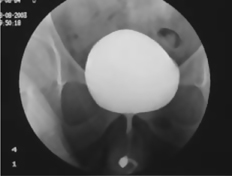
Fig. 3.9 Normal urethrogram.
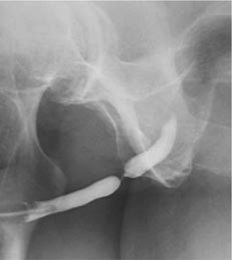
Fig. 3.10 A urethrogram showing a bulbar urethral stricture.
Widely used for investigation of urological symptoms and disease. It can detect very small differences in X-ray absorption values of tissues, providing a very wide range of densities (and therefore differentiation between tissues) when compared with plain radiography. The computer calculates the absorption value (attenuation) of each pixel and reconstructs this into an image. The attenuation values are expressed on a scale from –1000 to +1000 Hounsfield units (water = 0, air = –1000, bone = +1000). More recently, advances in computing power have enabled the data to be reformatted, so that images can be produced in sagittal and coronal planes, as well as in the more familiar horizontal plane (Figs. 3.11 and 3.12).
‘Plain’ CT scans (without contrast) can detect calcification and calculi within the urinary tract.
Administration of IV contrast is used to investigate haematuria, to evaluate the nature of solid renal lesions, and to determine the nature of soft tissue masses (e.g. to differentiate bowel from lymph nodes in cancer-staging CTs). ‘Spiral’ or ‘helical’ CT [also known as multidetector CT urography (MDCTU) when done following IV contrast administration] is very rapid scanning, while the table on which the patient is lying is moved though the scanner. Multiple images (‘slices’) of the patient are taken. A large volume of the body can be imaged in a single breath-hold, thus eliminating movement artefact and increasing spatial resolution—particularly useful for identifying suspected ureteric stones in patients with acute loin pain and (with contrast) for determining the nature of renal masses.
Overlapping thin sections can be ‘reconstructed’ into images in multiple planes [multiplanar reformatting (MPR)], so lesions can be imaged in multiple planes (sagittal, coronal), as opposed to the traditional transverse sections.
Investigation of the site and cause of urinary tract bleeding. Has the advantage of a single investigation which potentially could obviate the need for the traditional ‘4-test’ approach to haematuria (IVU, renal ultrasound, flexible cystoscopy, urine cytology), although at the cost of a higher radiation dose. There is evidence suggesting that MDCTU has reasonable sensitivity and high specificity for diagnosing bladder tumours1 (in patients with macroscopic haematuria—93% sensitivity, 99% specificity) and that it has equivalent diagnostic accuracy to retrograde uretero-pyelography (the retrograde administration of contrast via a catheter inserted in the lower ureter to outline the ureter and renal collecting system).2 Overall, for patients with haematuria and no prior history of urological malignancy, for the detection of all urological tumours, it has ~65% sensitivity and 98% specificity3—so it only rarely calls a lesion a tumour when, in fact, the lesion is benign, but it still fails to diagnose a significant proportion of urinary neoplasms (sensitivity for upper tract neoplasms 80%, for bladder tumours 60%). The role of MDCTU (described by some as the ‘ultimate’ imaging modality) in the investigation of haematuria remains controversial. MDCTU in all patients with haematuria (microscopic, macroscopic), when most will have no identifiable cause for the haematuria, has a cost (high radiation dose, financial). A targeted approach, aimed at those with risk factors for urothelial malignancy (age >40y, macroscopic, as opposed to microscopic, haematuria, smoking history, occupational exposure to benzenes and aromatic amines) might be a better use of this resource, rather than using MDCTU as the first imaging test for both high- and low-risk patients. Thus, the ‘best’ imaging probably depends on the context of the patient.
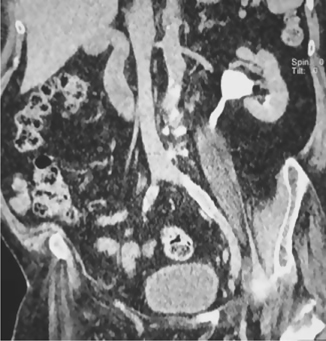
Fig. 3.11 Coronal CT image of the abdomen showing the left kidney, aorta, and inferior vena cava.
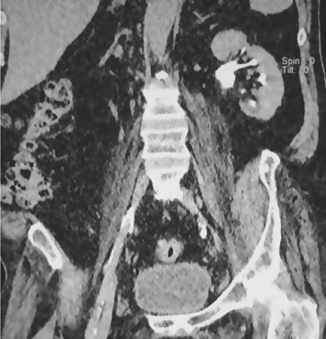
Fig. 3.12 Coronal CT image of the abdomen showing the left kidney and paravertebral muscles.
•Investigation of renal masses—characterizes solid from cystic lesions; differentiates benign (e.g. angiomyolipoma) from malignant solid masses (e.g. RCC).
•Staging of renal cancer (establishes local, nodal, and distant spread).
•Assessment of stone size and location (within the collecting system or within the parenchyma of the kidney).
•Detection and localization of the site of intrarenal and perirenal collections of pus (pyonephrosis, perinephric abscess).
•‘Staging’ (grading) of renal trauma.
•Determination of the cause of hydronephrosis.
The IVU, previously the mainstay of imaging in patients with flank pain, has been superseded by CT-KUB, a non-contrast CT of the kidneys, ureters, and bladder. Compared with IVU, CT-KUB:
•Has greater specificity (97%) and sensitivity (94–100%) for diagnosing ureteric stones.4 Can identify non-stone causes of flank pain.
•Requires no contrast administration, so avoiding the chance of a contrast reaction (the risk of fatal anaphylaxis following the administration of low-osmolality contrast media for IVU is in the order of 1 in 100 000).
•Is faster, taking just a few minutes to image the kidneys and ureters. An IVU, particularly where delayed films are required to identify a stone causing high-grade obstruction, may take hours to identify the precise location of the obstructing stone.
•Is equivalent in cost to IVU in high-CT volume hospitals.
CTU is able to locate and measure the size and number of ureteric stones. A non-contrast CT-KUB radiation dose: ~4.7mSv, compared to 1.5mSv for IVU (fatal cancer risk is estimated at 1 in 2000 for a 10-mSv radiation exposure). Ultra-low-dose CT (ULDCT) lowers radiation exposure (0.6–2mSv), but at the expense of lower sensitivity (68–86%) for small (<3mm) ureteric stones.4 Contrast-enhanced ULDCT (CEULDCT) uses contrast which increases sensitivity (97%) and specificity (100%) for detecting small ureteric stone disease, while limiting radiation dose to levels comparable with IVU (1.7mSv vs 1.4mSv).
Bladder cancer staging (establishes local, nodal, and distant spread).
MRI makes use of the magnetic properties of the hydrogen nucleus (a proton) present in water molecules, and therefore in all body tissues. In a magnetic field (1.5T or 3T), protons align along the direction of the field and the application of pulsed alternating radio waves gives photon energy to hydrogen protons, thereby changing their alignment. When the radio waves are switched off, the protons relax (realign) into their resting spin state and emit photon energy, which is detected by coils and generates an image. T1 images are generated from the longitudinal relaxation (fat appears white and fluid appears black), and T2 images are generated from the transverse relaxation (fluid appears bright). Signal intensity is determined by: (1) proton density, (2) T1 relaxation time, (3) T2 relaxation time, and (4) flow (e.g. loss of signal from rapidly flowing arterial blood).
Gadolinium contrast can be used to speed up the relaxation time of protons, thereby increasing the contrast between normal and pathological tissues. The risk of nephrogenic systemic fibrosis is highest with the use of linear chelate agents and in those with an eGFR <60, those with liver transplant, and in children <1y.
Multiparametric MRI (mpMRI) uses T2 images (anatomy), diffusion-weighted imaging (measures Brownian motion of water and calculates apparent diffusion coefficient maps), and dynamic contrast-enhanced images (pre-, peri-, and post-contrast) to identify significant prostate cancer.
•Staging of pelvic cancer—bladder and prostate cancer staging (establishes local, nodal, and distant spread). Good for identifying seminal vesicle invasion. Increasingly used pre-biopsy for diagnosis of prostate cancer (mpMRI), with the PIRADS (Prostate Imaging Reporting and Data System) scoring system. Staging of penile cancer.
•Especially useful for diagnosing phaeochromocytomas (very bright image on T2-weighted images).
•Investigation of LUTS where the history suggests a possible neurological basis (LUTS in the presence of lumbar or thoracic back pain or associated with loss of perineal sensation or disturbances of bladder sensation or where there is sensory disturbance in the legs or feet).
•Staging of renal cancer with inferior vena cava (IVC) thrombus assessment.
•Identification of ureteric stones where ionizing radiation is best avoided (e.g. pregnant women with loin pain).
•Assessment of penile smooth muscle viability in priapism.
A nuclear medicine imaging technique. Produces three-dimensional images of functional processes in the body. Detects gamma rays emitted by positron-emitting radionuclide tracers which are introduced into the body on biologically active molecules. The molecules to which the radionuclides are bound allow ‘visualization’ of metabolic processes. Three-dimensional images of tracer concentration within various organs and tissues are then constructed by CT scanning (or MRI) performed within the same machine. It thus involves exposure to ionizing radiation (typically 5–7mSv, but if combined with CT, up to 25mSv).
Radionuclides with short half-lives (minutes) are attached to biologically active molecules such as glucose (‘metabolic’ tracers) or molecules that bind to receptors or sites of drug action (‘receptor-specific’ tracers). As a consequence of the short half-lives, the radionuclides must be made in a cyclotron in a radiochemistry lab in close proximity to the PET imaging unit.
In urological practice, one example is fluoro-2-deoxy-D-glucose labelled with an isotope of fluorine 18F (18F-FDG). This is taken up by cellular glucose transporters and phosphorylated to FDG-6-phosphate by glucose-6-phosphokinase. FDG is trapped in cells, and so cells are intensely radiolabelled with 18F-FDG. Choline (18F or 11C) can also be utilized, acting as a cell membrane phospholipid with metabolism and turnover in prostate cancer.
The radioisotopes undergo positron emission decay, emitting positrons (the so-called antiparticles of the electron). The emitted positrons travel in tissue for a short distance (<1mm, depending on the isotope) and, in so doing, lose kinetic energy. They decelerate to a point where they can interact with the electron, this interaction leading to the destruction of both the electrons and positrons and, in the process, producing a pair of gamma photons moving in opposite directions. These photons are detected when they reach a scintillator within the scanning device.
18F-FDG is excreted in urine and this limits the role of 18F-FDG PET scanning in the detection of primary urological cancers, but it has shown promise in the detection of metastatic disease.
18F-FDG PET has limited sensitivity for primary staging, since prostate cancer cells often do not have glucose metabolism.5 European guidelines recommend the use of choline PET in post-radical prostatectomy failure if PSA >1ng/mL and in post-radical radiotherapy failure if salvage therapy is being considered and evaluation of distant metastases is required.
18F-FDG PET is advised if CT shows equivocal metastases in renal cancer.
18F-FDG PET is recommended by NICE if CT/MRI shows equivocal metastases in muscle-invasive bladder cancer, but it is not useful in primary staging.
18F-FDG PET is used in seminomas to assess post-chemotherapy masses of >3cm. However, it is not used in non-seminomatous germ cell tumours (NSGCTs).
References
1Fowler JC, Cutress ML, Abubacker Z, et al. (2011). Clinical evaluation of ultra-low dose contrast-enhanced CT in patients presenting with acute ureteric colic. Br J Med Surg Urol 4:56–63.
2Turney BW, Willatt JM, Nixon D, et al. (2006). Computed tomography urography for diagnosing bladder cancer. Br J Urol Int 98:345–8.
3Cowan NC, Turney BW, Taylor NJ, et al. (2007). Multidetector computed tomography urography for diagnosing upper urinary tract urothelial tumours. Br J Urol Int 99:1363–70.
4Sudakoff GS, Dunn DP, Guralnick ML, et al. (2008). Multidetector computed tomography urography as the primary imaging modality for detecting urinary tract neoplasms in patients with asymptomatic hematuria. J Urol 179:862–7.
5Rioja J, Rodríguez-Fraile M, Lima-Favaretto R, et al. (2010). Role of positron emission tomography in urological oncology. Br J Urol Int 106:1578–94.
A variety of organic compounds can be ‘labelled’ with a radioactive isotope that emits gamma rays, allowing the radiation to penetrate through tissues and reach a ‘gamma’ camera placed adjacent to the patient. The most commonly used radioisotope is technetium—99mTc (half-life 6h, gamma ray emission energy 0.14MeV). The excretion characteristics of the organic compound to which 99mTc is bound determine the clinical use.
99mTc is bound to mercaptoacetyl triglycine. Over 90% of mercaptoacetyl-triglycyl (MAG3) becomes bound to plasma proteins, following IV injection. It is excreted from the kidneys, 90% by tubular secretion and only 10% by glomerular filtration. Following IV injection, MAG3 is very rapidly excreted (appearing in the kidney within 15s of injection and starting to appear in the bladder within about 3min). Approximately two-thirds of the injected dose of MAG3 are taken up by the kidneys with each passage of blood through the kidney. The radioactivity over each kidney thus increases rapidly. The peak of radioactivity represents the point at which delivery of MAG3 to the kidney from the renal artery is equivalent to excretion of MAG3. The radioactivity starts to decline, as excretion outstrips supply. Thus, a time–activity curve can be recorded for each kidney. This time–activity curve is known as a renogram.
Images are collected onto a film at 2s intervals for the first 1min and then at 20s intervals for the remainder of the study (usually a total of 30min).
•First phase: a steeply rising curve lasting 20–30s.
•Second phase: a more slowly rising curve, rising to a peak. If the curve does not reach a peak, the second phase is said to rise continually. A normal second phase ends with a sharp peak.
•Third phase: a curve that descends after the peak. There can be no third phase if there is no peak.
No comment is made about the first phase. The second phase is described as being absent, impaired, or normal. The third phase is described as being absent, impaired, or normal.
The time to the peak depends on the urine flow and the level of hydration and is a crude measure of the time it takes the tracer to travel through the parenchyma of the kidney and through the renal pelvis. The time to the peak of the renogram normally varies between 2 and 4.5min.
If the renogram continues beyond the time at which the peak should normally occur, then there may be a distal obstruction (e.g. at the PUJ or lower down the ureter). In this situation, an injection of 40mg of furosemide is given (at about 18min), and if the curves start to fall rapidly, this is taken as proof that there is no obstruction. If it continues to rise, there is obstruction. If it remains flat (neither rising or falling), this is described as an ‘equivocal’ result.
Parenchymal transit time can also be measured [parenchymal transit time index (PTTI)]. The normal range for the PTTI is 40–140s and averages 70s. The PTTI is prolonged (to >156s) in obstruction and in renal ischaemia. A normal PTTI excludes obstruction.
•‘Split’ renal function (i.e. the % function contributed by each kidney).
•Determination of the presence of renal obstruction—based on the shape of the renogram curve and the PTTI.
Dimercaptosuccinic acid (DMSA) is labelled with 99mTc. It is taken up by the proximal tubules and retained there, with very little being excreted in the urine. A ‘static’ image of the kidneys is thus obtained (at about 3–4h post-IV injection of the radioisotope). It demonstrates whether a ‘lesion’ contains functioning nephrons or not.
•‘Split’ renal function (i.e. the % function contributed by each kidney).
•Detection of scars in the kidney (these appear as defects in the cortical outline, representing areas in which the radioisotope is not taken up).
99mTc-labelled methylene diphosphonate (MDP) is taken up by areas of bone where there is blood supply and osteoblastic activity. There are many causes of a focal increase in isotope uptake: bone metastases, site of fractures, osteomyelitis, TB, and benign bone lesions (e.g. osteoma). Metastases from urological cancers are characterized by their predilection for the spine and the fact that they are multiple (single foci of metastasis are rare). Prostate cancer classically metastasizes in this way.
Measurement of flow rate (Fig. 3.13). Provides a visual image of the ‘strength’ of a patient’s urinary stream. Urine flow rate is measured in mL/s and is determined using commercially available electronic flowmeters (Fig. 3.14). The mechanisms include a rotating disc (momentum flux principle), a weight transducer (gravimetric principle), or capacitance using a bimetallic strip. These flowmeters are able to provide a printout, recording the voided volume, maximum flow rate, and time taken to complete the void, together with a record of the flow pattern. The maximum flow rate Qmax is influenced by the volume of urine voided, by the contractility of the patient’s bladder, and by the conductivity (resistance) of their urethra.
A number of nomograms are available which relate the voided volume to the flow rate.
The ‘wag’ artefact (Fig. 3.13b) is seen as a sudden, rapid increase in flow rate on the uroflow tracing and is due to the urine flow suddenly being directed at the centre of the flowmeter, producing a sudden artefactual surge in flow rate.
In men with ‘prostatic’ symptoms, for the same voided volume, the flow rate varies substantially on a given day (by as much as 5mL/s if four flows are done).1 Most guidelines recommend measuring at least two flow rates (each >150mL) and using the highest as representing the patient’s best effort.
Uroflowmetry alone cannot tell you why the flow is abnormal. It cannot distinguish between low flow due to BOO and that due to a poorly contractile bladder.
The principal use of urine flow rate measurement is in the assessment of elderly men with suspected prostatic obstruction (‘LUTS/BPH’), but there is debate about its usefulness as a test for predicting outcome of various treatments. Some studies suggest that men with poor outcomes are more likely to have had higher flows preoperatively, compared with those with good outcomes, whereas other studies report equivalent improvements in symptoms whether or not the preoperative flow rate is high or low. A recent Veterans Administration trial comparing transurethral resection of the prostate (TURP) with watchful waiting in men with LUTS/BPH found that flow rate could not predict the likelihood of a good symptomatic outcome after TURP.2
As a consequence, different guidelines give different guidance with regard to performing uroflowmetry in men with LUTS/BPH. It is regarded as an optional test by the AUA3 and recommended by the 4th International Consultation on BPH,4 and the EAU BPH guidelines state that it ‘is obligatory prior to undertaking surgical treatment’.5
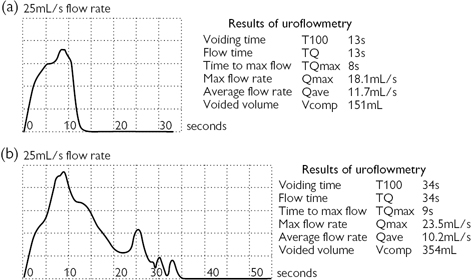
Fig. 3.13 (a) A uroflow trace. (b) A uroflow trace with a ‘wag’ artefact occurring between 5 and 10s. The true Qmax is not 23.5mL/s, as the readout suggests, but is nearer 18mL/s.
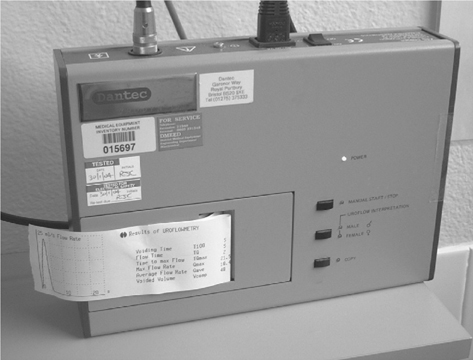
Fig. 3.14 Dantec flowmeter.
Generally speaking, urine flow rate measurement is regarded as having an insufficient diagnostic accuracy for it to be useful in the assessment of ♀ lower urinary tract (LUT) dysfunction. Although urine flow measurement can be used to assess voiding function in men with urethral strictures, it has limited value in younger men because in this age group, the bladder can compensate for a marked degree of obstruction by contracting more forcefully. Thus, a young man may have a normal flow rate despite having a marked urethral stricture.
References
1Reynard JM, Peters TJ, Lim C, Abrams P (1996). The value of multiple free-flow studies in men with lower urinary tract symptoms. Br J Urol 77:813–18.
2Bruskewitz RC, Reda DJ, Wasson JH, et al. (1997). Testing to predict outcome after transurethral resection of the prostate. J Urol 157:1304–8.
3McConnell JD, Barry MJ, Bruskewitz RC, et al. (1994). Benign Prostatic Hyperplasia: Diagnosis and Treatment. Clinical Practice Guideline. Rockville, MD: Agency for Health Care Policy and Research.
4Denis L, Griffiths K, Khoury S, et al. (eds) (1998). Fourth International Consultation on Benign Prostatic Hyperplasia (BPH), Paris, July 1997. Plymouth: Health Publications.
5de la Rosette JJ, Alivizatos G, Madersbacher S, et al. (2001). EAU guidelines on benign prostatic hyperplasia (BPH). Eur Urol 40:256–63.
PVR urine volume is the volume of urine remaining in the bladder at the end of micturition. In normal individuals, there should be no urine remaining in the bladder at the end of micturition. A PVR may be caused by detrusor underactivity (due to ageing—as the older bladder is less able to sustain a contraction than the younger bladder or in neurological disease affecting bladder innervation), BOO, or a combination of both. In clinical practice, PVR volume is measured by ultrasound after the patient has attempted to empty their bladder. A commonly used formula for calculating bladder volume is:1,2,3,4,5
PVR volume shows considerable day-to-day variability, with volumes recorded on different days over a 3-month period varying between 150 and 670mL.1
Analysis of placebo-treated men (n = 737) in the MTOPS trial suggests that PVR volume did not seem to be a strong predictor of the likelihood of developing acute urinary retention. There was no difference in retention rates in men with a residual urine volume of <39mL, compared with those with a residual urine volume of 39mL or more (although the higher PVR was associated with a greater chance of symptomatic progression and of the need for invasive therapy).6 Similarly, there was no difference in retention rates in 389 men treated with α-blockers or 553 treated with placebo with a residual urine volume of <300mL, compared with those with a residual urine volume of >300mL.7 In 170 men with urodynamically confirmed BOO who initially opted for conservative (non-surgical) treatment, 141 (83%) remained untreated at 10y and 29 (17%) had undergone surgery (22 for LUTS, seven for retention). PVR at baseline did not predict the chance of developing urinary retention or of the need for TURP for worsening LUTS.8
PVR volume measurement cannot predict symptomatic outcome from TURP. For these reasons, residual urine volume measurement is regarded as an optional test in the AUA guidelines but is recommended by the 4th International Consultation on BPH.2
Residual urine volume measurement is useful (along with measurement of serum creatinine) as a safety measure. It indicates the likelihood of back pressure on the kidneys, and thus it tells the urologist whether it is safe to offer watchful waiting, rather than TURP. In men with moderate LUTS, it is safe not to operate where the PVR volume is <350mL and this probably holds true for those with higher PVR volumes (<700mL).3
Though intuition would suggest yes, what evidence there is relating residual volume to urine infection suggests that an elevated residual urine may not, at least in the neurologically normal adult, predispose to urine infection.4,5 There has been no longitudinal study to determine if an elevated PVR increases the risk of developing UTI.
References
1Dunsmuir WD, Feneley M, Corry DA, et al. (1996). The day-to-day variation (test–retest reliability) of residual urine measurement. Br J Urol 77:192–3.
2Denis L, Griffiths K, Khoury S, et al. (eds) (1998). Fourth International Consultation on Benign Prostatic Hyperplasia (BPH), Paris, July 1997. Plymouth: Health Publications.
3Bates TS, Sugiono M, James ED, et al. (2003). Is the conservative management of chronic retention in men ever justified? Br J Urol Int 92:581–3.
4Riehmann M, Goetzmann B, Langer E, et al. (1994). Risk factor for bacteriuria in men. Urology 43:617–20.
5Hampson SJ, Noble JG, Rickards D, Milroy EG (1992). Does residual urine predispose to urinary tract infection? Br J Urol 70:506–8.
6Crawford ED, Wilson SS, McConnell JD, et al. (2006). Baseline factors as predictors of clinical progression of benign prostatic hyperplasia in men treated with placebo. J Urol 175:1422.
7Mochtar CA, Kiemeney LA, van Riemsdijk MM, et al. (2006). Post-void residual urine volume is not a good predictor of the need for invasive therapy among patients with benign prostatic hyperplasia. J Urol 175:213–16.
8Thomas AW, Cannon A, Bartlett E, Ellis-Jones J, Abrams P (2005). The natural history of lower urinary tract dysfunction in men: minimum 10-year urodynamic follow-up of untreated bladder outlet obstruction. BJU Int 96:1301–6.
•Cystometry: the recording of bladder pressure during bladder filling.
•Pressure–flow studies (PFS): the simultaneous recording of bladder pressure during voiding.
•Videocystometry: fluoroscopy (X-ray screening) combined with PFS during voiding (Fig. 3.8).
These techniques provide the most precise measurements of bladder and urethral sphincter behaviour during bladder filling and during voiding. Cystometry precedes the PFS. Bladder pressure (Pves, measured by a urethral or suprapubic catheter) and abdominal pressure (Pabd, measured by a pressure line inserted into the rectum) are recorded as the bladder fills (cystometric phase) and empties (voiding phase), and the flow rate is simultaneously measured during the voiding phase. The pressure developed by the detrusor (the bladder muscle) Pdet cannot be directly measured, but it can be derived by subtracting the abdominal pressure from the pressure measured within the bladder (the intravesical pressure). This allows the effect of rises in intra-abdominal pressure caused by coughing or straining to be subtracted from the total (intravesical) pressure, so that a ‘pure’ detrusor pressure is obtained.
All pressures are recorded in cmH2O, and flow rate is measured in mL/s. The pressure lines are small-bore, fluid-filled catheters attached to an external pressure transducer, or catheter-tip pressure transducers can be used.
A computerized printout of Pves, Pabd, and Pdet and flow rate (Qmax) is obtained (Fig. 3.15). During bladder filling, the presence of OAB contractions can be detected. During voiding, the key parameters are Qmax and the detrusor pressure at the point at which Qmax is reached (Pdet Qmax). This pressure, relative to Qmax, can be used to define the presence of BOO by using a variety of nomograms, of which the ICS nomogram is most widely used.
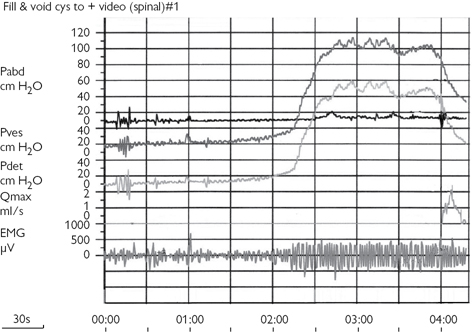
Fig. 3.15 A computerized printout of the intravesical pressure (Pves), intra-abdominal pressure (Pabd), subtracted detrusor pressure (Pdet), and flow rate (Qmax).