 Systems of linear equations and inequalities
A single equation that contains two or more variables has infinitely many ordered pairs in its solution set. A system of equations is a group of equations, each of which involves two or more variables. For systems with two variables and two equations, the solution is an ordered pair of values that make both of the equations in the system true.
Graphing systems of equations
A system of two linear equations in two variables can be solved by graphing each of the equations and locating the point of intersection. The coordinates of the point of intersection are the values of x and y that solve the system. If the lines are parallel, the system has no solution.
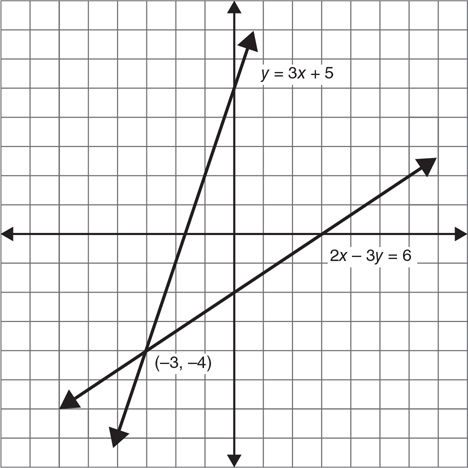
Figure 5.1 Solving a system of equations by graphing.
In Figure 5.1, by graphing 2x − 3y = 6 and y = 3x + 5 on the same set of axes, you can see that they cross at the point (−3, −4). That means that x = −3 and y = −4 will solve both equations. Each equation has an infinite number of solutions, but this one is the only one they have in common.

Graph each system of equations and locate the solution, if one exists.
1. 
2. 
3. 
4. 
5. 
6. 
7. 
8. 
9. 
10. 
Graphing systems of inequalities
When you solve a system of equations by graphing, each equation has a graph that is a line, and the solution of the system is the point where the lines intersect. The solution of a system of inequalities is also the intersection of the solution sets of the individual inequalities, but the solution set of an inequality is not just a line, but a region, sometimes called a half-plane. The solution of the system of inequalities is the area where the two half-planes overlap.
To solve the system of inequalities 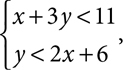 graph each of the inequalities, shading lightly, then locate the overlap and shade these shared values more prominently (see Figure 5.2).
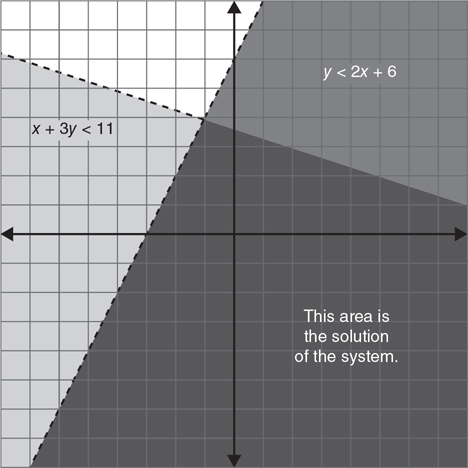
Figure 5.2 Solving a system of inequalities by graphing.

Graph each system of inequalities and indicate the solution set by shading.
1. 
2. 
3. 
4. 
5. 
6. 
7. 
8. 
9. 
10. 
Solving systems of equations by substitution
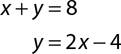
When one equation in a system expresses one variable as a function of the other, like y = 3x − 1 or x = 4 + y, it can be substituted into the other equation. That substitution produces an equation with only one variable, an equation that can be easily solved. To solve the system 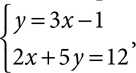 replace the y in the bottom equation with 3x − 1.

Once you know the value of one variable, substitute that into one of the original equations to find the value of the other variable.
Substitution is most convenient when one of the equations is given to you in x = or y = form, but you can use it anytime you can conveniently put one of the equations into that form. If trying to solve for x or for y in terms of the other variable is too difficult or gives you a messy substitution, combinations may be a better method.

Solve each system of equations by substitution.
1. 
2. 
3. 
4. 
5. 
6. 
7. 
8. 
9. 
10. 
Solving systems of equations by combination
If both equations are in standard form (or can easily be transformed to standard form), then the method of linear combinations, or elimination, allows you to add or subtract the equations in a way that will make one variable drop out. Make sure that both equations are in standard form and that like terms are aligned under one another before you begin.
Addition
If the coefficients of one variable are opposites, add the equations to eliminate that variable.
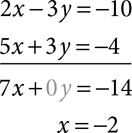
Solve for the remaining variable and substitute back into either equation to find the value of the second variable.

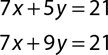
Subtraction
If the coefficients of one variable are identical, you can subtract the equations to eliminate that variable, or you can multiply one of the equations by −1 and then add.

Solve for the remaining variable and substitute back into either equation to find the value of the second variable.


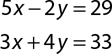
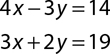
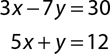
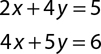
Solve each system of equations.
1. 
2. 
3. 
4. 
5. 
6. 
7. 
8. 
9. 
10. 
Combinations with multiplication
If the coefficients of the variable are neither identical nor opposite, you can still use combinations, but you need to do a little work first. Multiply one or both equations by constants to create equivalent equations with matching or opposite coefficients.
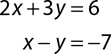
If you need to solve the system 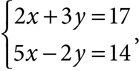 you can multiply the top equation by 2 and the bottom equation by 3. That will turn the system into
 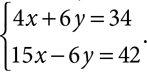 This system has the same solution as the original, but in this version, you can eliminate y by adding the equations. Once the coefficients are identical or opposite, eliminate a variable by adding or subtracting, and then substitute back into one of the original equations.
Be careful to multiply through the entire equation by the constant. Multiplying the variable terms but not the constant is a common error. Checking your solution in both of the original equations will help you catch your errors.

Solve each system of equations.
1. 
2. 
3. 
4. 
5. 
6. 
7. 
8. 
9. 
10. 
Dependent and inconsistent systems
Not every system of equations has a unique solution. Since parallel lines never intersect, if the two equations produce parallel lines when graphed, the system has no solution. This occurs when the equations have the same slope but different y-intercepts. A system that has no solution is inconsistent. A system that has a unique solution is consistent.
If a system is made up of two equations that produce the same graph, every point on the line is a point of intersection, and so the system has infinitely many solutions. Such a system is dependent. You can recognize a dependent system because one equation will be a constant multiple of the other.

Label each system as consistent, inconsistent, or dependent.
1. 
2. 
3. 
4. 
5. 
6. 
7. 
8. 
9. 
10. 
Calculator notes #4
You can solve a system of linear equations by substitution or by elimination, and usually do so without too much trouble. Graphing is also a method for solving systems, but often not the most practical one, because drawing the graphs by hand can be time-consuming, and if the solutions are not integers, estimating the fractional part can be difficult. What looks like  on a hand-drawn graph could really be
  and it would be hard to tell.
The graphing calculator gives you a quick way to graph a system, and will give you the solution, even if the values are not integers, accurate to several decimal places. This shouldn’t replace your other methods of solving systems but it does give you a good way to verify the solution you found.
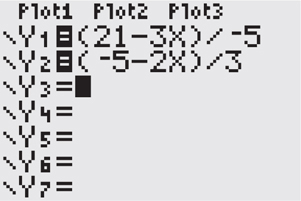
To solve the system above on your graphing calculator, you’ll need to first isolate y in each equation. Remember that the calculator won’t care if the expression is simplified, so don’t fuss if it’s not convenient to clean things up. Just remember to enclose the numerator in parentheses.

• Enter the equations into the  menu in Y1 and Y2.
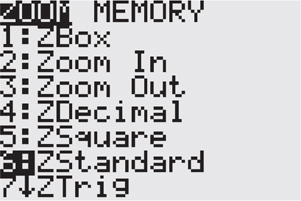
• Press  and choose 6: ZStandard to set a standard viewing window and display the graphs. If you can’t see the point of intersection of the lines, adjust your window.
• With the point of intersection visible on screen, press  and choose 5:intersect.
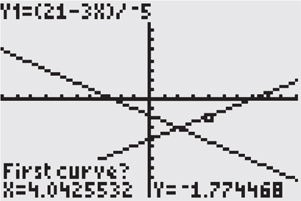
• The cursor appears on one line, and the question “First curve?” appears at the bottom of the screen. If you have only two lines, you can just press  . (If you have more than two lines, use the up and down cursor keys to move to one of the lines of the system, then .)
• The cursor jumps to a different line, and question “Second curve?” appears. As long as it’s the other line of the system, just press .
• The question changes to “Guess?” For linear systems, you can just press . If you wish, you can move your cursor close to the point of intersection before you press . (Later, when you solve systems in which graphs intersect more than once, the guess Âoption lets you move the cursor to the intersection you want.)
• The solution of the system displays at the bottom of the screen.

In addition to allowing you to find the solution of a system, the graph also lets you see when a system is inconsistent or dependent. If the lines are parallel, there is no point of intersection to find, so the system has no solution and is inconsistent. If the graph appears to be only one line, go to , cursor down to Y2, cursor to the left and press to change the symbol. Press  and you show be able to see if the second line traces right on top of the first. If it does, the system is dependent.