2.2
ELECTRICITY
The generation and transmission of electricity is one of the primary reasons for the existence of an energy market. Electricity is used to power a large variety of modern devices. Industrial equipment, computers, and air conditioners are just a few examples of modern conveniences powered by electricity. Electricity is so common that it is hard to imagine life without it. Unfortunately, electricity can’t be easily stored, and it’s very expensive to transmit over long distances. Consequently, there is no unified national electricity market—it’s a collection of small regional markets, each having unique characteristics and regulations. In each market, supply and demand must constantly be matched resulting in highly volatile prices.
Each regional market is coordinated by its own Transmission Service Operator (TSO). Some TSOs are government-sponsored monopolies, and others are Independent Service Operators (ISOs) or Regional Transmission Organizations (RTOs). Both ISOs and RTOs maintain the power grid in areas where the government-sponsored monopoly has been disbanded. ISOs are limited to doing service in a single state and are exempt from federal jurisdiction. RTOs do business across several states and fall under federal jurisdiction. Many RTOs began as ISOs in a single state. Later, they became RTOs when they expanded across state boundaries. Commonly, these RTOs still keep ISO as part of their name. A map showing the major deregulated markets is shown in Figure 2.2.1.
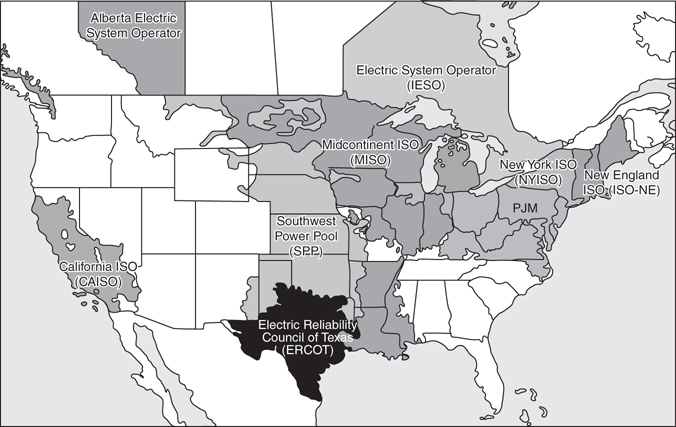
Figure 2.2.1 Map of RTO/ISO operators
A regulated market is a service area where a government-sponsored monopoly coordinates the power grid. This monopoly controls all aspects of the power grid. For example, it will own generation facilities, power lines, the trucks needed to maintain the power lines, and so on. Typically, a government-appointed commission, usually called a public utility commission or public service commission, regulates this monopoly. In annual hearings, called rate cases, the public utility commission will approve the utility to spend money on behalf of consumers served by the utility. The utility will earn a profit as a percentage of how much money is spent.
A deregulated market is a service area where an RTO/ISO rather than a government-sponsored monopoly coordinates generation and transmission. In these areas, anyone can own a power plant and connect it to the transmission grid to sell power. All of the participants in a deregulated market are guaranteed equal access to transmission lines and economic innovation is encouraged. As a general rule, deregulated markets use economic incentives to effect changes, while regulated markets use legislative mandates. Most energy trading occurs in deregulated markets.
The most important characteristics of a deregulated market are daily power auctions. These nondiscriminatory auctions set the price of power for a transmission grid. Power producers submit the price at which they are willing to supply power and are activated in order from the lowest to highest bid. These are called nondiscriminatory auctions because all winning bidders get paid the same price regardless of their bids. The price of power for every producer and every wholesale consumer is set to a single price called the clearing price, or alternately, the wholesale price. Smaller customers pay a slightly higher price for their power—the retail price for power.
In deregulated markets, power plants are activated in order of their bids (lowest to highest) until the consumer demand is completely met. The last power plant activated sets the clearing price of power for the entire transmission area. Some common terminology in these auctions describes the importance of the last activated power provider. The cost of bringing the last unit of electricity into the market is called the marginal price of power, and the most recently activated plant is the marginal producer. Therefore, in deregulated markets, the clearing price is set by the marginal price of power.
Usually, there are two types of auctions coordinated by RTOs/ISOs. A day-ahead auction sets the price of power for the following day in one-hour increments. Usually this auction is completed in the early afternoon on the day before delivery. This allows power producers time to arrange fuel and operating schedules for the delivery day. The actual demand for power isn’t known when the day-ahead auction occurs. Instead, this auction is based on a prediction of next day’s required load.
The second auction is a real-time auction that is run continuously throughout the actual delivery day. This auction balances the actual demand against the predictions made the previous day. It is typically bid in five-minute increments. If a power plant is not chosen to operate in the day-ahead auction, it can still participate in the real-time auction. However, the real-time auctions require power plants to turn on and off quickly, and not every power plant has this capability.
Only power plants participate in the daily auctions. However, the auction mechanism is important to every market participant since it determines the price of power in each region.
Market Participants
The work of getting electricity to consumers is often broken into four components (Figure 2.2.2). The first is generation, the work of creating electricity. The second is long-distance transportation, called transmission. The third is distribution, which involves getting the power the last mile from the local substation to the consumer. The fourth and final step is retail sales, which involves billing and customer service. In regulated markets with monopoly utility, the utility is typically responsible for all four jobs. In deregulated markets, it is common for these responsibilities to be split between multiple entities.
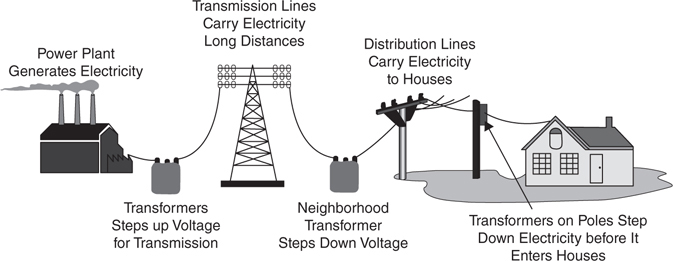
Figure 2.2.2 The power grid. (Source: National Energy Education Development Project)
• Generation. Generation refers to power plants that generate electricity.
• Transmission. Transmission is the long-distance transportation of power, typically done at high voltages.
• Distribution. Distribution is the short-distance transportation of power. This is typically done at low voltages and operates at a neighborhood level, connecting every building to the grid.
• Retail Sales. Retail sales involve customer service and billing. In deregulated markets, the retail sales company is typically responsible for contracting with generators to ensure sufficient capacity is available to serve their customer base.
Generators produce electrical power and place it onto the transmission system. This is done using a transformer to convert the output of the generation unit into high-voltage AC power. Then, the power is transmitted long distances over high-voltage lines. Once the high-voltage power is close to consumers, its voltage is lowered at a substation so that it can travel over residential power lines. Finally, low-voltage lines will distribute electricity to consumers.
In deregulated markets, each role in the power grid is typically handled by a different company.
• Merchant Generator. A generator who sells power to another company (usually a load serving entity).
• Investor Owned Utility. In deregulated markets, the infrastructure of the transmission system is typically owned by a single utility. This utility will not own generation and is commonly called a “wires” company.
• Load Serving Entity (LSE). A load serving entity is a company that provides electric service to either end-users or wholesale customers. In deregulated markets, LSEs are typically intermediaries between the power grid operator, the generators, and consumers.
• Provider of Last Resort (POLR). In states providing retail competition, the POLR is the load serving entity that is obligated to sell power to consumers if they don’t choose a supplier or their chosen supplier goes out of business.
In regulated markets, all four jobs are commonly performed by a state-sponsored monopoly utility:
• Integrated Utility. In a regulated market, an integrated utility is typically a regulated monopoly that owns generation, transmission, and distribution assets.
• Municipally Owned Utility (Muni). A muni is a publicly owned utility owned by a local government.
• Co-operative (Co-op). A co-op is a not-for-profit utility commonly found in rural communities where it is unprofitable for traditional utilities to operate.
• Federally Owned Utility. A federally owned utility is a government entity, commonly involving hydroelectric generation, which has authority to buy, sell, and distribute power.
Electrical Trading Markets
The forward power market is where the bulk of speculative trading occurs. This market is open to anyone with sufficient money to meet trading requirements. The forward market depends on the prices set by the daily auctions, but they are very different markets. The daily auctions are open only to power providers with the ability to generate power and place it on the transmission grid. In contrast, the forward market is much more accessible. The forward market doesn’t require any ability to generate power at all—it is possible to trade both physical contracts (requiring delivery of power) and financial contracts (which settle in cash). To distinguish the two markets, the daily power auctions are sometimes called the spot power market.
The forward markets trade large blocks of power at a limited number of locations around the country. This is a critical difference between the daily auctions and the forward markets. It is possible to buy spot power in arbitrarily small sizes for immediate use anywhere in the country. However, it is only possible to trade it in monthly blocks at about 30 locations. The most important of these locations are shown on the map in Figure 2.2.3. The forward markets limit the number of trading locations so that a sufficient number of buyers and sellers are forced to be active in each contract.
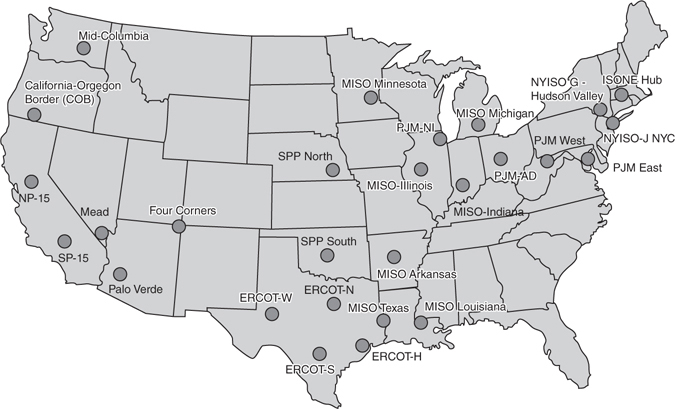
Figure 2.2.3 Major electricity trading hubs
Trading power in large units at a limited number of locations makes it easier to standardize contracts and find trading partners. This is a necessary compromise for a liquid trading market. However, it also presents a major problem—the tradable locations represent extended geographic areas. They may not reflect the exact price of power everywhere in the surrounding area. Getting an exact price at a specific location commonly requires additional trades that may or may not be possible. As a result, power is often traded in two pieces—standardized forward trades made at major hubs to get the desired regional exposure approximately correct, and then smaller fine-tuning trades to lock in an exact price.
Daily Power Auctions
In the daily auction market, the assumption that all power providers are equally able to deliver power isn’t always true. In periods of heavy demand, power lines can become overloaded and may require electricity to be routed around the congestion. The primary way of rerouting power is to activate power plants closer to the areas of high demand. Because low-cost generators are normally activated first, turning on a generator closer to the demand means that a high-cost plant is being activated out-of-merit order. If that price was allowed to set the clearing price of power for the whole grid, there would be a jump in everyone’s costs for the sake of a small minority of customers. In most deregulated power grids, rather than having the entire grid pay the higher price, it is paid only by the affected parties. Because this price only occurs for a single location, this is known as a Locational Marginal Price (LMP).
Aligning power prices with the actual cost of delivering power was one of the major reasons that energy markets have deregulated. The alternative to deregulated markets, having prices legislated by local governments, actually interferes with matching prices to costs. If prices are always going to match costs, there is no need for legislation—the market is deregulated. Legislation involves adding loopholes and exceptions to a general rule. Under the Standard Market Design (SMD) recommended by the FERC1, the costs of line congestion are paid by the affected parties rather than being shared across every user of a power grid. Congestion costs aren’t just paid by consumers, power producers pay them too. There is a charge for routing power into a high-load area over congested power lines, and a credit for producing power that bypasses the congestion. Most of the United States is moving toward this model of allocating costs.
Another part of the SMD is a penalty for remote generation. Historically, generators were paid for the quantity of power that was placed on the grid at their generation site. But, if a generator was a long distance from the demand, line losses on the intervening transmission could substantially decrease the amount of power that was actually delivered to customers. Under an LMP methodology, power producers only get paid for deliverable power—not on the gross power placed onto a power grid.
These two changes have had a huge effect on the business of selling power. In addition to fuel costs and efficiency, location has become a major factor in determining the profitability of a power plant. The power grids have become much more reliable. There is an economic disincentive to build power plants that can’t actually deliver power to customers, and an incentive to put up power lines that relieve congestion.
Implementing the FERC’s SMD requires assigning different prices to different locations on a power grid. In most regions, this price (the LMP) consists of three parts—a clearing price, a congestion charge, and a line loss charge. The clearing price for power is the same everywhere on a power grid, but the congestion and line loss charges are specific to each location.
Under the SMD, there are several types of locations for which prices are calculated: nodes, zones, and hubs. Node prices correspond directly to the price of power at a specific piece of physical hardware. Commonly this is an interface, called an electrical bus, where power enters or leaves the transmission grid. Generators get paid the nodal price of the electrical bus where they deliver power into the transmission grid. Zone prices are the average of all nodal prices within a limited geographical area. Usually, electrical buyers pay the zone price for the power they receive. Zone prices are used for customers since they require less detailed metering equipment. A hub price is an average of selected nodal prices across several zones. The hub price serves as the benchmark price for a power grid. Hub prices are used extensively in the forward market for trading. In most ISO/RTO regions, the clearing price for power and the hub price are synonymous.
Closely linked to the concept of LMPs is a financial instrument called a Financial Transmission Right (FTR). These instruments help customers manage the price risk of having purchased or sold power at a major hub and then being forced to pay a different price when they deliver or receive power at a specific node. FTRs are tradable contracts made between two parties. These parties take opposite sides of an obligation to pay or receive the difference in price between two nodes. If there is no congestion, the price at the two nodes will be the same. However, if there is congestion, one party will need to pay the other. This payment can go either way—either party can end up paying or receiving cash. Sometimes, that isn’t what is desired, so these contracts can be structured as options. FTR options allow one party to pay an up-front fee (a premium) to avoid paying on congestion charges. Essentially, buying an FTR option is like buying insurance against higher prices due to congestion.
Regulated Markets
Not all power grids are deregulated. Many power grids are operated by a monopoly utility that is regulated by a government commission. This commission is usually called a public utility commission or a public service commission and determines consumer electricity prices that can be charged by the utility. These prices allow the utility to earn a return on any money that is prudently spent on meeting consumer requirements.
In regulated markets, integrated utilities (utilities that own both transmission and generation) typically have the sole responsibility to supply power to consumers. Because of that, there is usually little or no wholesale market for electricity within the utility’s service area. When trading does occur, it will occur at points where power can be imported or exported from the service area. These nodes typically have names like Into-Southern Company or Into-Dominion.
Regulated utilities are compensated for operating a power grid by being approved to charge a certain fee to consumers. This fee is determined so that the utility earns a fixed return on a regulatory value called a rate base. The fees and information about the rate base can be found online in a document called a tariff, which is the pricing structure a retailer charges a customer for energy consumption.
A rate base consists of the investments the utility has made into assets like generation, transmission, and distribution infrastructure (Figure 2.2.4). Rates are set in meetings, called rate cases, held between the utility commission and the utility. During these meetings, the utility commission authorizes a percentage rate that the utility is allowed to make on its investments and approves any new investments (additions to the rate base) that will occur before the next meeting.
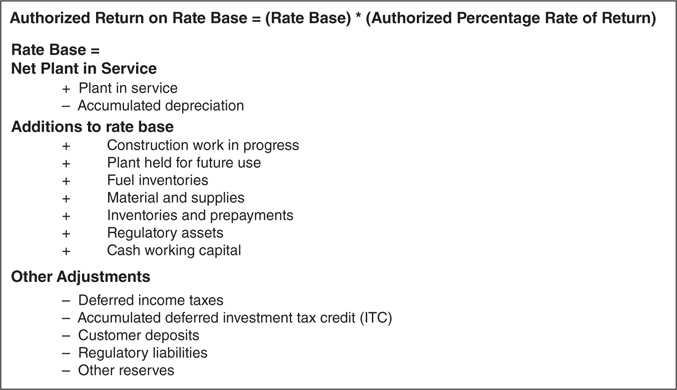
Figure 2.2.4 Rate base calculations
Because of this mechanism, the primary way for a utility to increase its profit is to spend additional money on behalf of its consumer base. The more power that consumers use, the more assets that the utility gets to build, and the greater the profit for the utility’s shareholders. Regulated utilities don’t benefit from finding cheaper ways to do things. As a result, regulated utilities tend to be much more focused on customer satisfaction and reliability than they are on reducing costs to consumers or encouraging conservation.
A regulated utility doesn’t need to own all of the generating assets within their service area. Some types of generation require specialty knowledge to build or operate. Regulated utilities can outsource the construction and management of these generation facilities to third parties through power purchase agreements (PPAs) or to compensate the generation owner based on the avoided cost of the utility.
• Power Purchase Agreement (PPA). A PPA is a legal contract where the utility agrees to buy power from a generator at a fixed cost. This agreement will typically pay the generation owner a fixed price for any production for a predetermined number of years. PPAs are typically linked to the physical facility and, if the facility is sold to a new owner, the PPA will transfer along with the physical unit. Most commonly, regulated utilities sign PPAs to incentivize the construction of specialized technology like solar, wind, or geothermal electrical generation. Since PPAs are typically signed when a unit is first constructed, prices are usually proportional to the cost to construct the generation unit.
• Avoided Cost. Regulated utilities may be required to purchase power from third-party generators that meet certain requirements. Typically, when a utility is required to purchase power from a third party, it will need to pay the generator the cost that it would have paid to generate the power itself (the avoided cost of the utility).
Electrical Demand
Because of the way power auctions work, where power plants are activated until the expected demand is fully met, predicting customer demand for power before it occurs is a critical part of power trading. The actual demand for power changes constantly. Every time a light is turned on or a computer is turned off, the load on the power grid changes. Since electricity can’t be stored, this changing demand must constantly be matched against supply. There is a huge infrastructure (including the day-ahead and real-time auctions) built to balance the supply of electricity against this consumer demand. However, these auctions can’t just be reactive—they need to ensure there are enough power plants active or on standby to meet upcoming demands for power. Building excess capacity into a system is one way to approach this problem, but keeping too many plants on standby costs a lot of money. Making accurate estimates of the future load on the power grid is a key factor in ensuring affordable power.
Load forecasting is also important for power plant operators. Power plants often need several weeks to line up fuel supplies for extended periods of activity. They need to know when to schedule maintenance, and when it makes sense to run continuously versus stopping and restarting. In a competitive market, accurately predicting consumer demand is essential to a power plant’s profitability.
Fortunately, the demand for power is fairly predictable. It varies by the season, day of week, and time of day in a cyclic manner. In each region, each part of the year has a typical demand profile that is relatively consistent under a wide variety of circumstances. However, the load profile for every part of the country is different.
During cold weather, where daily high temperatures are below 60°F, there are two distinct periods of peak demand. The first occurs in the morning when people wake up for work. Homes and offices need to be heated around 6 a.m. The second occurs in the evening when people arrive home from work. Figure 2.2.5 shows the typical demand for electricity in cold weather for a variety of high temperatures. The lines indicate the percent of daily power used each hour. The dashed line indicates the coldest days; the solid line indicates the warmest. Although more power will be used during colder weather, the time that people use heating is fairly constant. Colder weather will generally lead to higher overnight power usage and more sharply defined peaks at the beginning and end of the day.

Figure 2.2.5 Hourly demand during cold weather
While having a different profile than cold weather, the demand for power in hot weather is also fairly consistent. On hot days, demand builds all day, peaking in the mid-afternoon when air conditioning is working most heavily. This peak is most pronounced on the hottest days (the solid line on Figure 2.2.6), but much less pronounced during more comfortable temperatures (the dashed line).

Figure 2.2.6 Hourly demand during warm weather
Seasonality, Weather, and the Demand for Power
The relationship between temperature and demand doesn’t just affect when power is used during the day—it has a major effect on the total amount of power being used too. Substantially more power is required in the summer and winter months than in the more temperate spring and fall months (Figure 2.2.7).

Figure 2.2.7 Seasonal demand for power
The distinctive peaks in the summer and winter have given a name to periods of lower demand—the fall and spring are called the shoulder months. Even during shoulder months, there is a baseline level of power required every day. Most industries keep fairly standard working hours that don’t change substantially throughout the year. As a result, the biggest variable demand for electricity comes from heating or cooling requirements. There is a clear correlation between temperature and electrical demand (demand is also called load). Since different parts of the country have different climates, there is a substantial variation in average seasonal load between regions.
The relationship between temperature and electrical demand can be seen in Figure 2.2.8. Temperature is located on the left axis. As temperatures become uncomfortable (moving above or below 65°F or 18°C), the demand for power increases (shown on the bottom axis). The points on the right side of the graph are when the peak demand occurred within the mid-Atlantic region in the years 2004 to 2006. These peaks correspond to the warmest and coldest days.
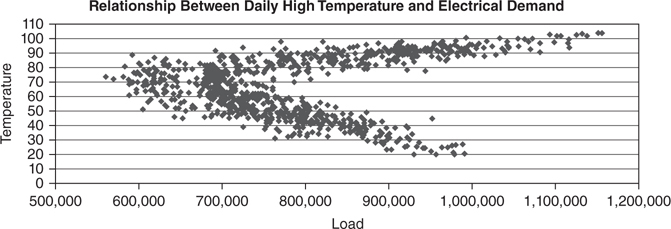
Figure 2.2.8 Relationship between electrical demand and temperature
The cyclical nature of electrical power affects how it is traded. Power is normally traded for an entire month based on the time of day. Forward contracts are commonly broken up into day and night power by month. For example, it is possible to find trading contracts for August daytime power with delivery at Cinergy Hub, or January nighttime power for delivery in Southern California. However, there isn’t a single commodity called electricity that is consistent throughout the year. Instead, there are hundreds of separately traded electricity products that differ based on location, month or season, and time of day.
Daytime hours (usually 7 a.m. until 11 p.m.) are called peak hours. Nighttime hours are called off-peak hours. Every region of the country uses slightly different definitions for their power products. As a result, power products are commonly described in shorthand. This abbreviation is weekdays by hours. For example, 7×24 refers to power 7 days a week, 24 hours a day. Peak power is 5×16 or 7×16 (depending on if weekend days are included). If weekends aren’t included in peak power, there will be a separate 2×16 product. Nighttime off-peak hours are typically 7×8—they start at 11 p.m. the day before and run until 7 a.m.
Finally, technology has a big effect on electrical demand. For example, air conditioning changed the entire dynamic of the power market. Many of the economic studies made in the late 1960s and 1970s regarding energy efficiency are now incorrect because of the increased popularity of air conditioning. With the advent of air conditioning, the demand for summer power went from being fairly low to extremely high. Predictions on typical demand have to keep up with these changes.
Generation
There are lots of ways to produce electrical power. Most power plants use a similar technology—generators driven by superheated steam.
Fossil fuel plants can burn oil, natural gas, or coal to produce this steam. All of these fossil fuels produce greenhouse gases like carbon dioxide (CO2) when they are burned. The amount of pollution depends on the efficiency of the power plant. More efficient plants use less fuel, thereby producing less pollution, per megawatt of generated power. Of all fossil fuels, coal fired generation is the most polluting—it produces two to three times the pollution of the other fuels.
Nuclear generators use nuclear fission to turn water into steam. Nuclear fuel provides a lot of electricity per weight—a pound of highly enriched uranium is approximately equal to a million gallons of gasoline. But, like fossil fuels, enriched uranium is subject to severe shortages and presents environmental problems. It is also difficult to store safely once discarded.
A third relatively common form of power generation is hydroelectricity. Instead of using steam, hydroelectric dams use flowing water to drive a turbine directly. In most cases, dams are built across a river, trapping the water on one side to form a lake. Water is allowed to flow through holes in the dam into the river, which is usually located several hundred feet below the lake level. As water flows through the dam, the falling water spins a water-based turbine to generate electricity. Depending on the amount of water flowing in the river and capacity of the lake, it may not be possible to turn off the flow of water without flooding nearby communities.
For energy trading, the most influential power plants are fossil fuel plants. Fossil fuel plants are marginal producers of power in most areas. As such, in any market that sets the clearing price of electricity to the marginal price of power, fossil fuel plants have a disproportionate impact on the price of electricity. Perhaps the most common description of a fossil fuel power plant relates to its efficiency in converting fuel into electricity. This efficiency is called a heat rate. A heat rate is typically expressed as a ratio of heat input to work output (for example, Btu/kWh or MMBtu/MWh). A lower heat rate indicates a more efficient power plant.
Generators
Electricity is usually generated by manipulating the relationship between magnetic fields and electricity. Electricity and magnetism are two parts of the same force (electromagnetism). Spinning a wire in a magnetic field creates a current in the wire. Magnetic fields generate electrical currents, and vice versa.
The easiest way to generate electricity is to rotate a coiled wire inside a pair of magnets (Figure 2.2.9). As the wire spins, it will start to build up a magnetic charge that can be removed in the form of electricity. By continuing to spin the coiled wire, a steady supply of electricity can be removed through a circuit. This force works both ways—electric generators and electric motors use identical technology. Applying a voltage to the positive and negative terminals of a generator will cause the shaft containing the wires to spin.
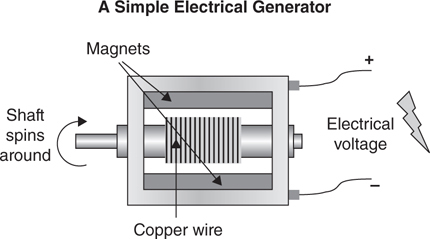
Figure 2.2.9 A simple electrical generator
When wires connect a voltage source to an electrical load, it is called a circuit. The definition of an electrical circuit is any closed loop of wire that contains a voltage source, often a generator or a battery, and a load (an electrical device of some kind). A load is anything that uses electricity—a common example is a light bulb, but any device powered by electricity can be described by the term. In circuit diagrams, these terms are often abbreviated. Voltage is commonly abbreviated v, current abbreviated i, and resistance (load) abbreviated R.
Voltage is a measure of the potential energy in an electromagnetic field. When a wire connects two points with different voltages, electrons will start flowing through the wire. They will move from the low-voltage area to the high-voltage area, eventually causing the voltage to equalize.2 In the case of a battery, when the voltage equalizes, the battery is dead and would need to be replaced or recharged.
However, if the voltage is being continually created through a generator, the current will continue to flow indefinitely. The speed at which the current (i) flows through the wire depends on the voltage and load. The more work that the electrons need to do on their way through the wire, the slower they travel. This is a very important relationship, because if the current moves too fast, the wire will heat up and possibly melt.
The relationship between voltage, current, and resistance can be described by the formula v = iR (Ohm’s Law). Voltage equals the current multiplied by the resistance. An electrical circuit is any closed wire containing a voltage source (v) and a load (R). A simple circuit diagram showing each of the fundamental pieces of a circuit can be seen in Figure 2.2.10.

Figure 2.2.10 A simple circuit
The key concept is that voltage, current, and load on a system are all interrelated. This is true of the simplest circuit and the largest power grid. If the current on any transmission wire gets too fast, it will start to heat up the wire. When it gets hot enough, the wire will melt. The only way to prevent transmission wires from melting is to match the level of production (the voltage) and the demand for electrical power (the load). Since a power grid can’t directly control the amount of power that consumers are using, it needs to alter the amount of power being produced. There needs to be a proper balance between generation and demand. Generating too little power will cause brownouts, and generating too much power will melt the transmission lines and cause a blackout.
Steam Turbine Plants
About 80 percent of the world’s power is generated through the use of steam turbines. Steam-turbine-based power plants vary widely in efficiency and complexity. Simpler turbines are less efficient, but are cheaper to build and have lower operating costs. More complex turbines are more efficient, but they are also more expensive to maintain.
Regardless of complexity, all steam turbines operate in a similar manner (Figure 2.2.11). Superheated steam is created by heating water in a boiler. When the water turns into steam, it expands, moving past a turbine (which is essentially a big fan), causing the turbine to spin. The turbine is attached to a generator causing it to spin as well. Spinning the generator causes electrical power to be generated. After moving past the turbine, the steam enters a cool metal chamber (the condenser). As the steam touches the cool sides of the condenser, it turns back into water and is then sent back into the boiler to begin the process again. The faster the steam turbine spins, the more electrical power is produced.
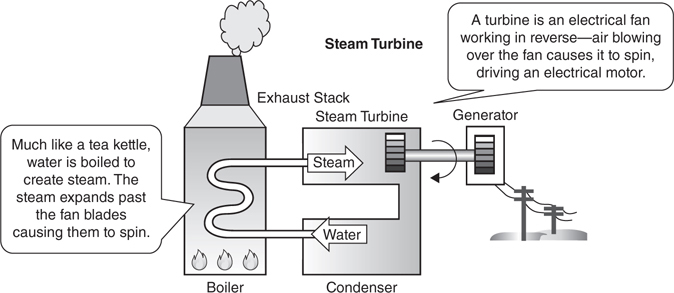
Figure 2.2.11 A steam turbine
A steam turbine is essentially an electrical fan operating in reverse. Instead of an electrical motor spinning a fan, a steam turbine operates by having air spin the fan. This drives the “motor” in reverse and produces electricity. From an engineering perspective, the key issue is how to push the fan blades (to spin the turbine). In a steam turbine, this problem is solved by using steam that is coming out of a boiler. The boiler acts like a tea kettle—when water starts to boil, steam exits the boiler at high speed, spinning the turbine along the way.
It takes less energy to boil already hot water than it takes to boil cold water. If the condenser cools the steam to a point just slightly below its boiling point, it is still very hot. When this hot water re-enters the boiler, only a small amount of additional heat will be required to convert it back into steam. The most fuel-consuming part of operating a steam turbine is heating up the system when it starts up. After the water is heated up, keeping the steam turbine continually operating is a very efficient way to produce more electricity. As a result, it is often worthwhile for power plant operators to keep their plant operational, and take a loss in low demand periods, in order to avoid the costs associated with a cold start.
Cogeneration
To condense the gas back into a liquid, it is necessary to cool it down slightly. The area where this cooling occurs is called the condenser. Fairly commonly, the condenser is a large metal container submerged in cold water. As the steam from the turbine touches the cold sides of the condenser, it cools down and condenses into a liquid. At the same time, the cold water outside the condenser heats up. If this goes on long enough, the water outside the container will eventually become hot. Most of the time, this hot water is discarded—it is allowed to flow into a local river or evaporates in a cooling tower. However, if this hot water is used for some purpose, the useful output of a plant is now increased—the plant will produce both electricity and hot water. This is the definition of a cogeneration plant.
Cogeneration doesn’t work for all power plants. The first problem is that there is often no need for superheated hot water in an area. Selling superheated water requires a buyer that wants to purchase it. A second problem is that even if someone wants to use the hot water, the water needs to be transported from the power plant to the location where it will be used. In most cases, this requires the purchaser to build a facility adjacent to the power plant or to build a pipeline connecting the two. Third, cogeneration places increased operational restrictions on the power plant. If an industrial facility needs superheated water to operate, it will want a stable supply. For the power plant, this is bad. A power plant won’t want to be obligated to produce hot water in periods where it is unprofitable to produce power.
The benefit of cogeneration is that it provides an additional income source for power plants. It doesn’t make the electrical generation part of the plant any more efficient. But, since it provides more income for the same fuel use, it can be thought of as lowering the cost of fuel. When cogeneration is a result of using waste heat produced from a condenser, it is called topping cycle cogeneration. It is also possible to reduce fuel costs by eliminating or reducing the need for a boiler. If heat from an industrial process provides heat to the boiler, the fuel necessary to run the plant can be reduced or eliminated. This type of cogeneration is called bottoming cycle cogeneration.
Gas Turbine
The other major technology for producing power is a gas turbine (Figure 2.2.12). Gas turbines skip the step of producing steam by creating superheated gas directly through combustion. A mixture of natural gas and air is ignited in an explosive reaction that sends superheated gas past a turbine. This is very similar to the operation of a jet engine. The linkage between the spinning turbine and electrical generator works the same way as a steam turbine.
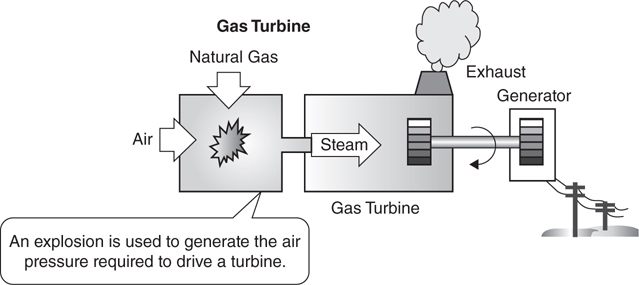
Figure 2.2.12 A gas turbine
Since the waste gas can’t be reused in a gas turbine, it is less efficient than a steam turbine. However, gas turbines are much simpler to build and maintain. Also, there is no lengthy process required to heat up the water into steam, so gas turbines can start producing power at peak efficiency as soon as they are turned on. As a result, gas turbines are commonly used for power plants that need to turn on quickly or that need to adjust their power output regularly.
Natural Gas Combined Cycle Plants
In the same way that a bottoming cycle cogeneration plant uses heat from an industrial process in its boiler, a steam turbine can use the exhaust heat of a gas turbine. The primary waste product of a gas turbine is superheated gas. This gas is extremely hot, but since it isn’t expanding anymore, it can’t be used to power a second gas turbine. However, it is perfect for heating water to produce steam. A combined cycle power plant is a gas turbine whose exhaust gases power a steam turbine. Combined cycle plants are more complicated than either a gas or a steam turbine plant, but they are also more efficient since there is less wasted heat (Figure 2.2.13).
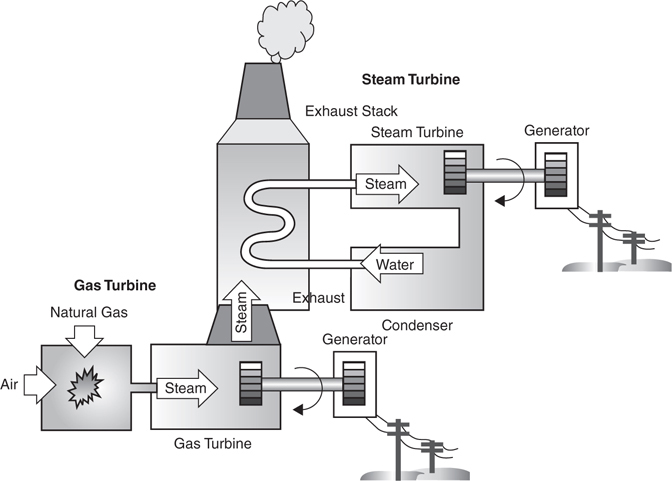
Figure 2.2.13 A combined cycle power plant
The steam turbine portion of a combined cycle plant operates like a normal steam turbine and its waste product, hot water, can be reused as well. When used to cogenerate heat, a natural gas combined cycle plant is a highly efficient power plant that produces a minimal amount of pollution for each megawatt of power.
Heat Rates
As mentioned previously, the efficiency at which a plant converts fuel into electricity is called its heat rate. Lower heat rates imply a more efficient power plant since less fuel is required to produce the same amount of electricity (Figure 2.2.14).

Figure 2.2.14 Heat rate formula
The heat rate of a plant is an easy way of determining when a power plant can operate profitably. For example, if a natural-gas-fired power plant has a heat rate of 8.5 MMBtu/MWh, it can sell power profitably when the price of power is 8.5 times the price of natural gas. Since this comparison is so common, the ratio of power to fuel prices has its own terminology. That ratio is called the market implied heat rate and is also in units of MMBtu/MWh (Figure 2.2.15).

Figure 2.2.15 Market implied heat rate formula
As a rule of thumb, power plants commonly have heat rates between 7 and 14 MMBtu/MWh. Power plants closer to the 7 MMBtu/MWh level are extremely efficient natural-gas combined cycle power plants. Heat rates close to 10 MMBtu/MWh are typical of steam turbines of all types (natural gas, coal, or nuclear). Modern gas turbines also commonly have heat rates around 10 MMBtu/MWh. Higher heat rate units are typically older units or small units intended for backup generation. Sometimes heat rates are expressed in Btu/KWh units. It is possible to convert between MMBtu/MWh units and Btu/kWh units by multiplying by 1,000. In these units, typical natural gas plants have heat rates between 7,000 and 10,000 Btu/kWh.
Spark Spreads
The heat rate of a power plant provides a way to estimate profitability. This estimate is called a spark spread. The spark spread is the theoretical profit that a natural gas generator can make from buying fuel and selling power at current market prices. This profit estimate does not include any charges for operating costs (Figure 2.2.16).

Figure 2.2.16 Spark spread formula
When multiple spark spreads are discussed, it is necessary to specify the heat rate and pricing location. Figure 2.2.17 is an example display that a trader might use to examine spark spreads and heat. The market implied heat rate indicates which power plant efficiencies are currently profitable in each region, while the bottom of the chart estimates the gross profitability of power plants in each region by heat rates.
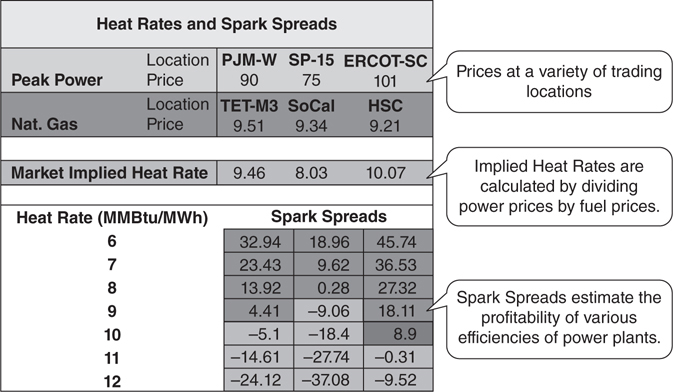
Figure 2.2.17 Relationship between heat rates and spark spreads
If products other than natural gas are examined, different terms are used to describe the profitability spread. Dark spread refers to a coal-based generation plant. When emissions credits are included in the profitability estimates, the name of the spread typically has the word clean or green in the front (as in a clean spark spread).
Transmission and Distribution
Once power is generated, it needs to be brought to the customer. A higher voltage makes it easier to transfer power over long distances but it is also more dangerous. As part of the generation process, power plants use several different types of power lines—high-voltage lines are used for long-distance transmission and lower-voltage lines are used for residential distribution. Transformers and substations step the voltage up or down between different types of power lines. Transmission refers to the bulk transfer of power from the power plant to a substation via high-voltage lines. Distribution refers to the transfer of power from a substation to various consumers using much lower voltage lines.
Power plants, transmission lines, and substations form the power grid—a set of interconnecting power lines that provide multiple ways to route power between any two locations. The redundancy of a power grid is crucial for reliability. It prevents any single line from overloading. This helps to prevent blackouts due to a single point of failure.
Most power lines are overhead lines—they are attached to tall poles suspended safely above ground level. In urban areas, electrical power lines are sometimes buried. However, buried power lines are less reliable and harder to maintain. Burying power lines is uncommon in suburban and rural areas.
The choice of voltage and location for power lines is a trade-off between safety, reliability, and efficiency. As part of the transmission process, power is wasted—it’s converted into heat that must be dissipated on the power line. This waste is proportional to the current—the higher the current on a line, the greater the losses become. This waste can be reduced by using higher voltages (effectively reducing the current). However, higher voltage lines are more dangerous than lower voltage ones and can’t be used in many areas.
Power is almost always transmitted over three power lines. The power on all three lines oscillates, but the sine curves are offset from one another (Figure 2.2.18). When power on the three lines is combined, the net current and voltage equal zero. This is a very important property for transmitting power. In a circuit, the net current at every point needs to be zero. Current can’t just disappear. It has to be cancelled, move somewhere else, or turn into something else like heat. In most circuits, this is achieved by having the same amount of current enter and leave every point.
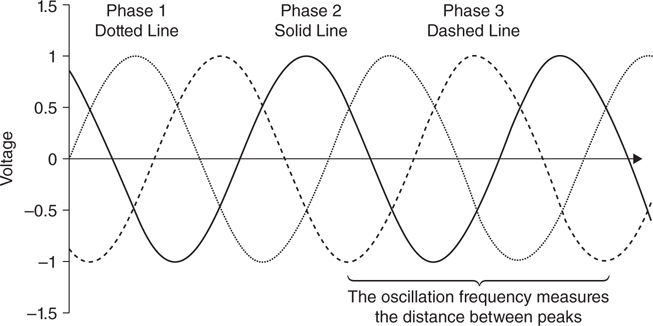
Figure 2.2.18 Three phases of AC power
Using three-phase power means that electricity doesn’t need to flow in a circle around the entire power grid. Instead, it can be run into a dead end and cancelled out. This addresses the problem of ensuring every point in a circuit has zero net current. If power had to flow out of each location, a single break (like a light switch turning off) would shut down the entire power grid. Three-phase power allows a transmission grid to avoid being a chain of serial circuits like Christmas tree lights, which don’t work if any of the bulbs are burned out.
In a three-phase power system, power on all three lines oscillates with the same frequency, but the starting points of the waves are different.
Because it is necessary for three-phase power to cancel, it is crucial that all of the voltages in an AC network have the same oscillation frequency. Keeping the power grid operating requires every power plant to synchronize the oscillation frequency on each of its power lines with the outputs from other power plants. If two power plants are producing power with different frequencies or starting points, the line voltages will interfere with one another—sometimes canceling, sometimes adding, but never doing anything useful. If the current isn’t cancelled out at every point, it doesn’t just stand still. It will move somewhere else (causing short circuits or shocks) or turn into heat (melting power lines and causing fires). This will wreak havoc on a power grid. Synchronizing power plants is a major responsibility for each TSO and a major obstacle between integrating adjoining power grids.
Almost all transmission lines use a three-phase system for transmitting power. Looking at transmission towers, this mean that most will contain a multiple of three wires. Since smaller wires help reduce the electromagnetic fields around power lines, it is fairly common for six power lines to transmit power (two groups of three lines). When multiple small wires are used to transmit three-phase power, this is called bundling. It helps prevent the air around power lines from picking up an electrical charge (called ionization or corona) that sometimes affects very large transmission wires.
Regional Markets
There are three major integrated power grids in the United States: the Eastern Interconnect (East of the Rocky Mountains), the Western Interconnect (west of the Rocky Mountains), and ERCOT (Texas) (Figure 2.2.19). Inside each interconnection, all of the transmission lines are synchronized. This allows power to be transported across long distances within those interconnections. However, differences in population, industry, and weather still make electrical prices a regional phenomenon. Because of this, long-distance transmission of power (called wheeling) between fundamentally different markets is the source of a large number of trading opportunities. Wheeling power can be expensive since there are large losses when power is transmitted over long distances. Wheeling is economically profitable if power can be obtained cheaply enough and sent to a high-price region.
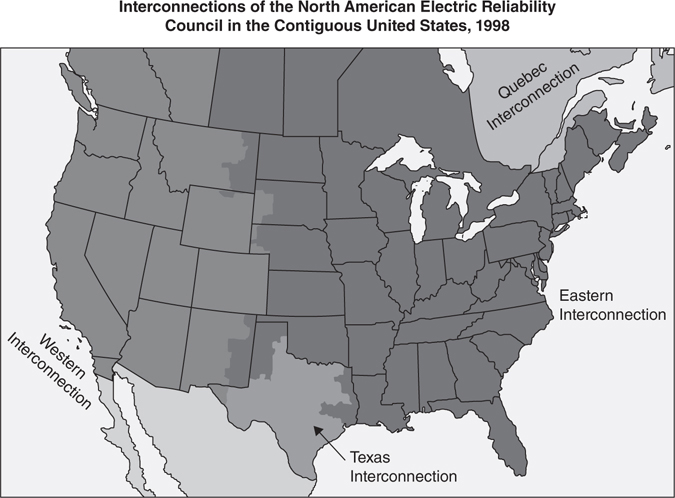
Figure 2.2.19 North American power interconnections
(Source: U.S. Energy Information Administration)
Texas Interconnection
The Texas Interconnect is the smallest interconnection in the United States and is located entirely within the state of Texas. Unlike the other interconnects that cover wide geographic areas, the power in this area is coordinated by a single ISO, the Electric Reliability Council of Texas (ERCOT). There are a number of direct current (DC) power lines connecting the Texas power grid to the Eastern Interconnect and the Mexican power grids. However, those lines have limited capacity.
Western Interconnection
There are seven major trading locations in the western United States (Figure 2.2.20). The Rocky Mountains dominate the regional geography of the area. The Western Interconnect is a long line of regional grids stretching from the Pacific Northwest into the Desert Southwest, with California in the middle. Much of the trading in the Western Interconnect revolves around the flow of power into or out of the highly populated areas of California. The Pacific Northwest (MIDC) and Colorado River (Mead) near Las Vegas are major sources of hydroelectric power. During peak usage periods, power flows toward California.
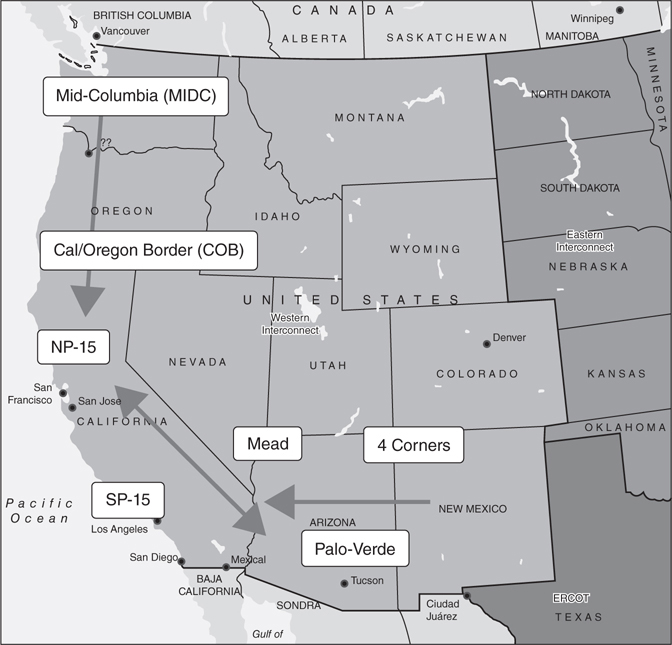
Figure 2.2.20 Western Interconnect
The amount of available hydroelectrical power and the weather differences between regions determine how power moves around the Western Interconnect. Hydroelectric power supplies about 70 percent of the power supply in Washington and Oregon. Because it is so prevalent, small changes in water flow can result in substantial changes to regional power supplies. In the spring, when the snow melts, more power is produced in the Pacific Northwest than can be used locally, and it needs to be transmitted to an area of higher demand (usually Northern California).
California has an extremely dense population. In the summer, it often imports power from both the Pacific Northwest and the Desert Southwest to meet peak demand. However, in the fall, when temperatures in California are mild but temperatures in Las Vegas and Phoenix are still extremely hot, power can be exported from California into the desert areas. This direction of flow can change at any time based on the relative temperatures of the two regions.
Since the marginal producers of power in California are usually natural-gas-fired plants, a steady supply of natural gas is required. The southern part of the region receives natural gas from the Rocky Mountains and West Texas. The northern part receives natural gas from western Canada. When the price of fuel in the two areas diverges, regional power prices can also be affected.
Eastern Interconnect
Unlike the Western Interconnection, the eastern half of the United States is less dominated by geography. It is a combination of RTO/ISOs and regulated entities forming an interconnected grid (Figure 2.2.21). The Eastern Interconnect is composed of both RTO/ISOs and regulated utilities.
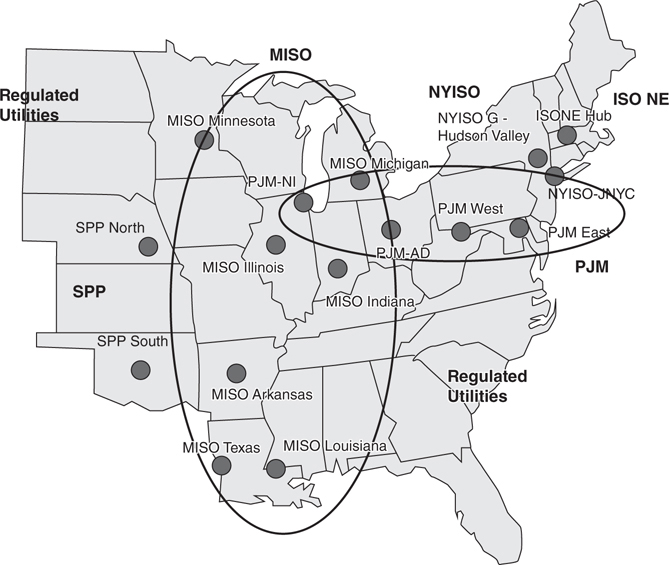
Figure 2.2.21 Eastern Interconnect
Two of the largest RTO/ISOs are in the Eastern Interconnection regions. PJM (originally named the Pennsylvania, New Jersey, and Maryland Interconnection) and Midcontinent ISO (MISO) are the two largest RTO/ISOs in North America. Other RTO/ISOs in the region include the Southwest Power Pool (SPP), New York ISO (NYISO), and ISO New England (ISO-NE). The two most liquid trading locations in the Eastern Interconnect are MISO-Indiana Hub (previously known as Cin-Hub or Cinergy Hub) and PJM Western Hub (PJM-W).
A variety of fuels and different regional weather patterns provide many trading opportunities in the Eastern Interconnect. Some of the most important trades are between regions using coal-fired plants and those using natural-gas-fired plants. Other trades are weather related. The southern part of the Eastern Interconnection has an extended summer while having mild winters. The northern part has cold winters and a shorter summer air conditioning season.
California (CAISO)
California is a heavily populated state that is divided into two major zones, NP-15 and SP-15 (Figure 2.2.22). Most of the year, the daily temperatures are moderate to warm. However, the dense population and hot summers can cause spikes in the electrical loads due to a demand for air conditioning.
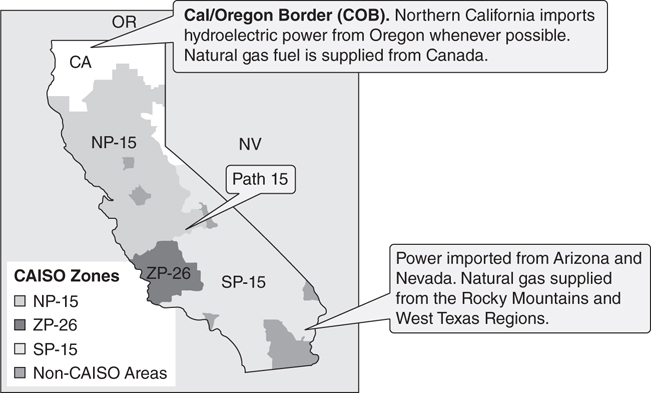
Figure 2.2.22 California power market
(Source: Map courtesy of FERC)
The major transmission lines are called paths. One of these transmission lines, Path 15, bisects the state into two approximately equal parts and has given its name to the two major zones, NP-15 and SP-15.
NP-15 (North Path 15) covers the northern part of the state (San Francisco Bay area) north of Path 15. When rainfall or melting snow allows, this region imports low-cost hydroelectricity from the Columbia River basin in Oregon. For the remainder of the year, natural gas plants set the price of power in NP-15. The plants are supplied primarily from western Canada.
SP-15 (South Path 15) is the pricing zone for most of southern California. It is south of Path 15. This zone is a major importer of power from Arizona (natural gas and solar power) and Nevada (hydropower from the Colorado River). Natural-gas-fired plants in the south are fed from supplies in the Rocky Mountain and West Texas regions.
ZP-26 is a large, but less important, pricing zone that has a relatively low population and excess generation capacity. It connects to both NP-15 and SP-15 zones.
Desert Southwest
The Desert Southwest has moderate winter temperatures and prolonged hot summers. Much of the year, the area has a surplus of generation capacity and is a major exporter of power to Southern California. Natural gas is the most common marginal fuel due to the abundant natural gas reserves, but coal and hydropower are also relatively common. This area also receives a great deal of sunlight, making it an attractive location for solar power (Figure 2.2.23).
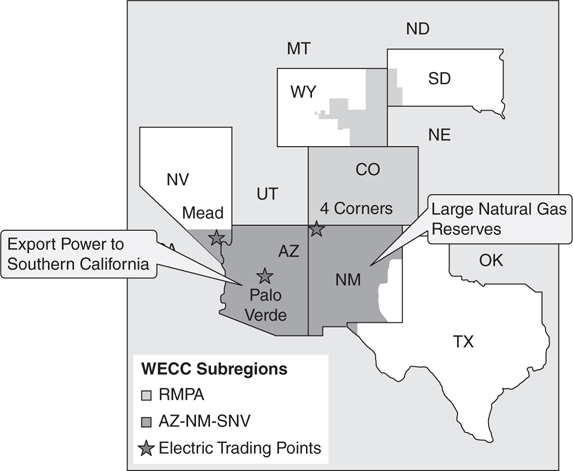
Figure 2.2.23 Desert Southwest power market
(Source: Map courtesy of FERC)
There are three major hubs for electricity trading in the area—Palo Verde, Mead, and Four Corners. Major power generation facilities are located near each hub.
Palo Verde is located at a major nuclear power plant and switching yard about 45 miles west of Phoenix, Arizona. Many high-power lines to California are located at this switching yard. Palo Verde is also the benchmark for most power delivered to the northern states in this region, such as Colorado and Wyoming.
Mead is located on the outskirts of Las Vegas. Lake Mead is the artificial lake formed when the Hoover Dam was built on the Colorado River. Hoover Dam is a major source of hydroelectric power and the primary delivery point for power in southern Nevada.
Four Corners is located in northwestern New Mexico at the interconnection of several major transmission lines.
Pacific Northwest
In most years, the Pacific Northwest sells surplus power into California and the Southwest. About two-thirds of all the electricity in the Pacific Northwest region comes from hydroelectric production. As a result, the quantity of surplus power depends heavily on precipitation. Water flow in this region directly affects the price of power in California (Figure 2.2.24).
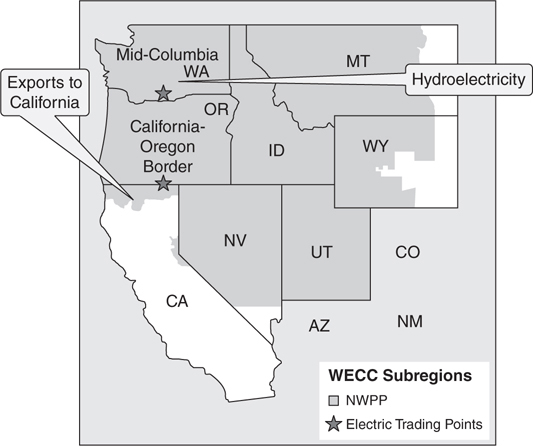
Figure 2.2.24 Pacific Northwest power market
(Source: Map courtesy of FERC)
Melting snow from the Cascade Mountain range, which runs through central Washington and Oregon, is a major source of river water. To the west of the mountains are several major population centers—Seattle, Washington and Portland, Oregon. The climate in these regions is fairly temperate all year. To the east of the mountains is the start of the Northern Plains states. This area is characterized by cold winters and hot summers.
Mid-Columbia (MIDC) is a delivery hub for a number of hydroelectric plants on the Columbia River.
Cal-Oregon Border (COB) is a major switching station in southern Oregon adjacent to the California border that interconnects several major transmission lines.
Mid-Atlantic (PJM ISO)
The mid-Atlantic region contains many large population centers, like Washington D.C., Baltimore, and Philadelphia, on the Eastern seaboard. This area formed one of the first independent power grids, the PJM ISO (Figure 2.2.25). This ISO was named after its constituent states (Pennsylvania, New Jersey, and Maryland). PJM has since expanded to include West Virginia, Delaware, large parts of Ohio, parts of northern Illinois, and Virginia. It is one of the largest and most liquid electricity markets. Within PJM, there are a number of active trading hubs.
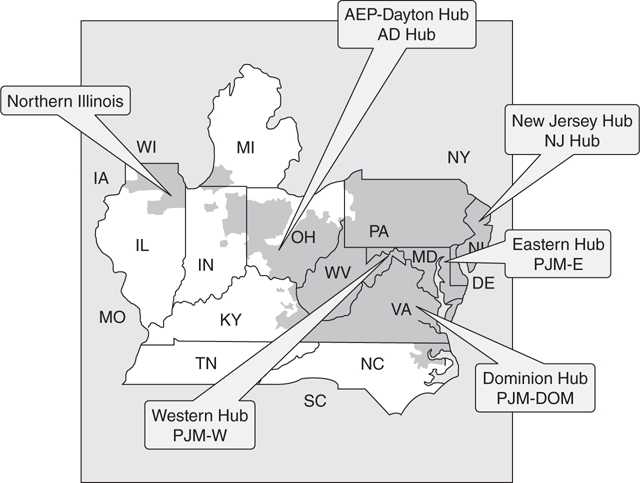
Figure 2.2.25 Mid-Atlantic power market
(Source: Map courtesy of FERC)
Geographically, the PJM service area is very diverse. Large reserves of coal native to Pennsylvania and West Virginia serve as the marginal fuel for the western part of the PJM service area. Power on the East Coast and Virginia is commonly determined by gas-fired power plants. The climate in the northern half of the region ranges from cold winters to hot summers. The climate in the southern half of the region is warmer—mild winters and extended hot summers.
A large number of power plants in the less populated areas of the PJM service area export power into the more populated regions. As a result, there are often congested power lines between these areas.
Midcontinent (MISO)
The Midcontinent ISO (MISO, previously called the Midwest ISO) coordinates power for much of the central United States (Figure 2.2.26). The northeastern part of this region is heavily industrialized, while the southern and northwestern sections are more rural. There are several major trading locations in the region. Of these, Indiana Hub (previously known as Cin-Hub) is the most influential.
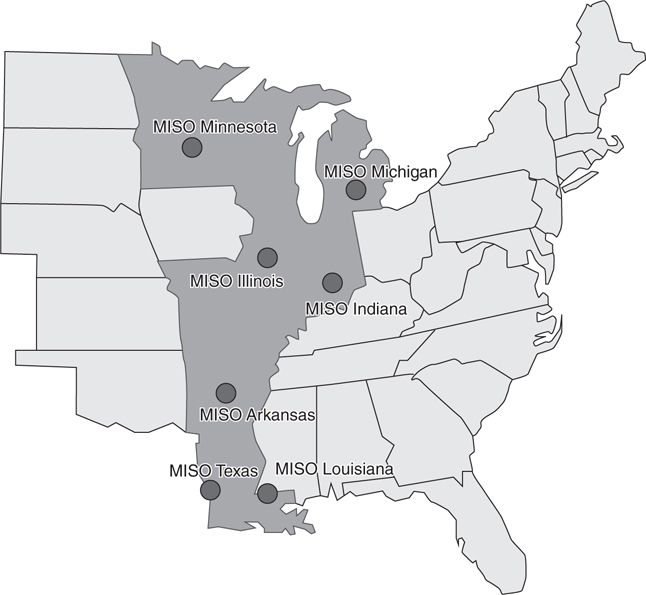
Figure 2.2.26 Midcontinent power market
From a climate perspective, the middle of the United States has cold winters and hot summers. The cold weather usually starts in December but can arrive in early November and usually lasts through April. The summer months—July and August—are hot and humid, but the weather cools off quickly in September. The southern part of MISO has mild winters and hot summers.
Many of the power plants in the northern part of this region, including a large number of marginal producers, are coal powered. As a result, coal prices commonly determine the price of power in the Midwest even in high demand periods. The southern part of the MISO territory is heavily dependent upon natural gas.
Because of the cool shoulder months (the spring and fall) in the Midwest, power is often wheeled to southern states where hot weather is more common. Some hydroelectric power is available from the Great Lakes and Tennessee Valley areas. Depending on the time of year, power might be imported from either of these two regions.
New York (NYISO)
The New York power grid is self-contained in the state of New York (Figure 2.2.27). The southeastern part of this region contains one the most heavily concentrated areas of demand for electricity in the country—New York City and Long Island. The region is characterized by the flow of low-cost power from the northern and western sections of the state into the high demand regions surrounding New York City.
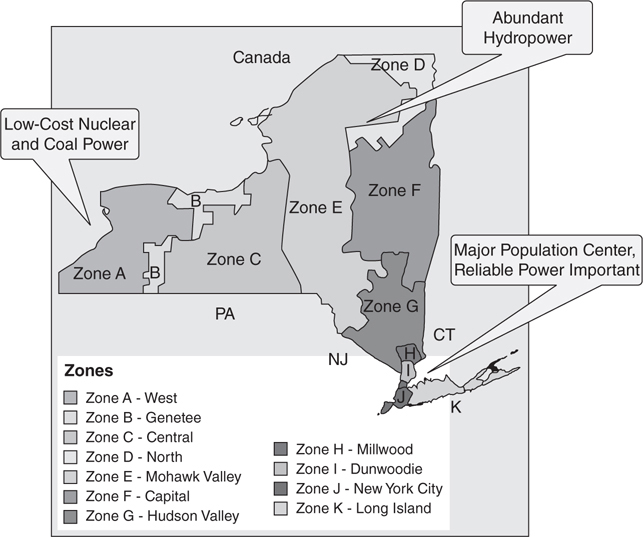
Figure 2.2.27 New York electrical market
(Source: Map courtesy of FERC)
Most of the New York metropolitan area is located on islands. As a result, there is limited ability to transfer power to those areas from other parts of the region and there is a high reliance on inefficient generators during periods of peak demand. This has made the New York City area one of the most expensive power markets in the country. In order to assure reliable service, power plants in the New York metropolitan area are subject to much stricter rules and regulatory requirements than are common in other regions.
New England (ISO-NE)
There is only a single trading hub in the New England region. The prices at this hub are based on selected nodes around the Boston, Massachusetts area (Figure 2.2.28).

Figure 2.2.28 New England power markets
(Source: Map courtesy of FERC)
New England has to import fuel for almost all of its power generation requirements. The marginal fuel for the region is natural gas. The bulk of this supply comes from the U.S. Gulf Coast and eastern Canada. There are efforts to augment this supply by constructing liquefied natural gas (LNG) Terminals in Massachusetts. This would help the region to augment their natural gas supplies.
Most of the population in New England is in the southern part of the region—Connecticut and the area around Boston. In comparison, the northern part of the region is relatively unpopulated.
Texas (ERCOT)
ERCOT is the ISO that provides power to Texas; it is divided into five primary regions (Figure 2.2.29). Most of the region’s population is located in the northeastern part of the state. ERCOT North contains the greater Dallas/Fort Worth area, and ERCOT Houston contains the Houston metro area.
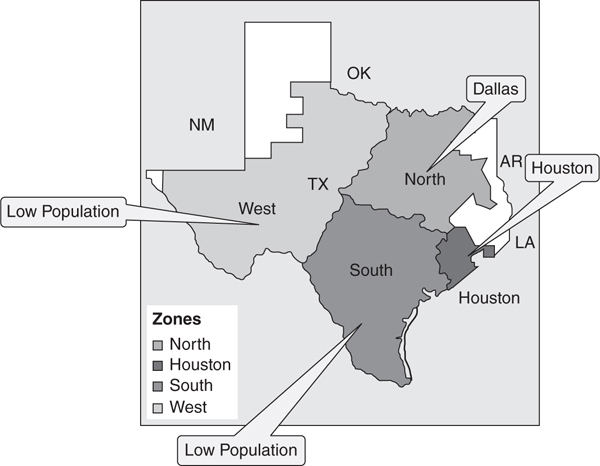
Figure 2.2.29 Texas electrical market
(Source: Map courtesy of FERC)
Due to abundant local supplies, the marginal fuel for the area is usually natural gas. The climate is characterized by mild winters and prolonged hot summers. Currently, most of the generation is located in the north and Houston zones—close to the greatest areas of consumer demand. However, substantial solar and wind-based generation is being built in the western part of the state. This complicates congestion planning in Texas since it requires transmitting constantly changing quantities of power from the western zone into the more populated zones.


