| 22 | Making Sense of Data Statistics Becomes a Science |
Statistics is a word used in a wide variety of senses and often invoked to lend credibility to otherwise doubtful opinions. We sometimes use it to refer to data, especially numerical data things like "52% of Americans like blue M & M's" or "93% of statistics are made up." When used in this sense, statistics is plural: each bit of data is a "statistic."1 When statistics is singular, it refers to the science that produces and analyzes such data. This science has deep historical roots, but it really blossomed in the early 20th century.
The gathering of numerical data herd sizes, grain supplies, army strength, etc. — is a truly ancient tradition. Tabulations of this sort can be found among the earliest surviving records of early civilizations. They were used by political and military leaders to predict and prepare for possible famines, wars, political alliances, or other affairs of state. In fact, the word statistics comes from state: it was coined in the 18th century to mean the scientific study of the state and quickly shifted to focus on political and demographic data of interest to the government.
Such data-gathering has existed ever since there have been governments (in fact, some scholars see the need for such data as one reason for the invention of numbers themselves). But only in the past few centuries have people begun to think about how to analyze and understand data. We begin the story in London in 1662, when a shopkeeper named John Graunt published a pamphlet entitled Natural and Political Observations Made upon the Bills of Mortality. The Bills of Mortality were weekly and yearly burial records for London, statistics (plural) which had been gathered by the government and filed away since the mid-16th century. Graunt summarized these records for the years 1604–1661 as numerical tables. He then made some observations about the patterns he observed: more males than females are born, women live longer than men, the annual death rate (except for epidemic years) is fairly constant, etc. He also estimated the number of deaths, decade by decade, in a "typical" group of 100 Londoners born at the same time. His tabulated results, called the London Life Table, signaled the beginning of data-based estimation of life expectancy.2
Graunt, together with his friend William Petty, founded the field of "Political Arithmetic," that is, the attempt to obtain information about a country's population by analyzing data such as the Bills of Mortality. Their approach was very unsophisticated. In particular, Graunt had no way of telling whether certain features of his data were significant or were accidental variations. The issues raised by Graunt's analysis of mortality data soon led others to apply better mathematical methods to the problem. For example, the English astronomer Edmund Halley (for whom the famous comet is named) compiled an important set of mortality tables in 1693 as a basis for his study of annuities. He thus became the founder of actuarial science, the mathematical study of life expectancies and other demographic trends. This quickly became the scientific basis of the insurance industry, which relies on actuaries (armed today with far more sophisticated analytical tools) to analyze the risk involved in various kinds of insurance policies.
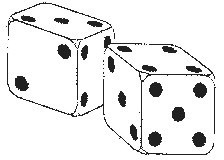
In the first part of the 18th century, statistics and probability developed together as two closely related fields of the mathematics of uncertainty. In fact, they are devoted to investigating opposite sides of the same fundamental situation. Probability explores what can be said about an unknown sample of a known collection. For instance, knowing all possible numerical combinations on a pair of dice, what is the likelihood of getting 7 on the next throw? Statistics explores what can be said about an unknown collection by investigating a small sample. For instance, knowing the life span of 100 Londoners in the early 16th century, can we extrapolate to estimate how long Londoners (or Europeans, or people in general) are likely to live?

The first comprehensive book on statistics and probability was Jakob Bernoulli's Ars Conjectandi, published in 1713. The first three of this book's four parts examined permutations, combinations, and the probability theory of popular gambling games. In the fourth part, Bernoulli proposed that these mathematical ideas have much more serious and valuable applicability in such areas as politics, economics, and morality. This raised a fundamental mathematical question: How much data is needed before one can be reasonably sure that the conclusions from the data are correct? (For example, how many people must be polled in order to predict correctly the outcome of an election?) Bernoulli showed that, the larger the sample, the more likely it was that the conclusions were correct. The precise statement he proved is now known as the "Law of Large Numbers." (He called it the "Golden Theorem.")
The reliability of data was an important issue for both the science and the commerce of 18th century Europe. Astronomy was seen as the key to determining longitude, and the reliable measurement of longitude was seen as the key to safe seagoing navigation.3 Astronomers made large numbers of observations to determine orbits of planets. But observations are prone to error, and it became important to know how to extract correct conclusions from "messy" data. A similar problem occurred in the controversy about the shape of the Earth — whether it was slightly flattened at the poles (as Newton had asserted) or at the Equator (as the director of the Royal Observatory in Paris claimed). Resolution of this issue depended on very accurate measurements "in the field," and different expeditions often got different answers. Meanwhile, insurance companies began to collect data of all kinds, but such data included variations due to chance, and one had to somehow distinguish between what was really going on and the fluctuations caused by errors and chance variation.
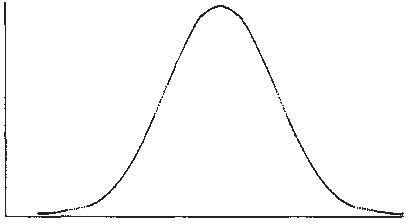
In 1733, Abraham De Moivre, a Frenchman living in London, described what we now call the normal curve as an approximation to binomial distributions. He used this idea (later rediscovered by Gauss and Laplace) to improve on Bernoulli's estimate of the number of observations required for accurate conclusions. Nevertheless, the results of De Moivre and his contemporaries were not always powerful enough to provide satisfying answers to the fundamental question in real-world situations: How reliably can I infer that certain characteristics of my observed data accurately reflect the population or phenomenon I am studying? More powerful tools for this and other applications were still more than a century away.

A normal curve
What was needed first was more mathematics. Specifically, probability theory had to be developed to the point where it could be applied fruitfully to practical questions. This was done by many hands throughout the 18th century. The process culminated with the publication, in 1812, of Pierre Simon Laplace's Analytical Theory of Probabilities, a monster of a book that collected and extended everything known so far. It was heavily mathematical, so Laplace also wrote a Philosophical Essay on Probabilities, which attempted to explain the ideas in less sophisticated terms and to argue for their wide applicability.
France in the early 19th century had more than one brilliant mathematician. The work of Adrien-Marie Legendre rivaled that of Laplace in scope, depth, and insight. He made important contributions to analysis, number theory, geometry, and astronomy and was a member of the 1795 French commission that measured the meridian arc defining the basic unit of length for the metric system. To statistics, Legendre contributed a method that set the course of statistical theory in the 19th century and became a standard tool for statisticians from then on. In an appendix to a small book on determining the orbits of comets, published in 1805. Legendre presented what he called "la méthode de moindres quarrés" (the method of least squares) for extracting reliable information from measurement data, saying:
By this method, a kind of equilibrium is established among the errors which, since it prevents the extremes from dominating, is appropriate for revealing the state of the system which most nearly approaches the truth.4
Soon after, Gauss and Laplace independently used probability theory to justify Legendre's method. They also recast it and made it easier to use. As the 19th century progressed, this powerful tool spread throughout the European scientific community as an effective way of dealing with large data-based studies, particularly in astronomy and geodesy.
Statistical methods began to make inroads into the social sciences with the pioneering work of Lambert Quetelet of Belgium. In 1835, Quetelet published a book on what he called "social physics," in which he attempted to apply the laws of probability to the study of human characteristics. His novel concept of "the average man," a data-based statistical construct of the human attributes being studied in a given situation, became an enticing focal point for further investigations. But it also drew criticism for overextending mathematical methods into areas of human behavior (such as morality) that most people considered unquantifiable. In fact, with the exception of psychology, most areas of social science were quite resistant to the inroads of statistical methods in most of the 19th century.

Perhaps because they could control the experimental sources of their data, psychologists embraced statistical analysis. They first used it to study a puzzling phenomenon from astronomy: The error patterns of observations by different astronomers seemed to differ from person to person. The need to understand and account for these patterns motivated early experimental studies, and the methodology developed for them soon spread to other questions. By the late 19th century, statistics was a widely accepted tool for psychological researchers.
With the many advances made in the 19th century, statistics began to emerge from the shadow of probability to become a mathematical discipline in its own right. It truly came of age in the study of heredity begun in the 1860s by Sir Francis Galton, a first cousin of Charles Darwin. Galton was part of the Eugenics movement of the time, which hoped to improve the human race by selective breeding. Hence, he was very interested in figuring out how certain traits were distributed in the population and how (or whether) they were inherited. To compensate for the inability to control the countless factors affecting hereditary data, Galton developed two innovative concepts: regression and correlation. In the 1890s, Galton's insights were refined and extended by Francis Edgeworth, an Irish mathematician, and by Karl Pearson and his student G. Udny Yule at University College, London. Yule finally molded Galton's and Pearson's ideas into an effective methodology of regression analysis, using a subtle variant of Legendre's method of least squares. This paved the way for widespread use of statistics throughout the biological and social sciences in the 20th century.
As statistical theory matured, its applicability became more and more apparent. Many large companies in the 20th century hired statisticians. Insurance companies employed actuaries to calculate the risks of life expectancy and other individually unpredictable matters. Others hired statisticians to monitor quality control. Increasingly, theoretical advances have been the work of people in non-academic settings. William S. Gosset, a statistician at the Irish brewery Guinness, was such a person early in the 20th century. Because of a company policy forbidding employees to publish, Gosset had to sign his theoretical papers with the pseudonym "Student." His most significant papers dealt with sampling methods, particularly ways to derive reliable information from small samples.

The most important statistician of the early 20th century was R. A. Fisher. With both theoretical and practical insight, Fisher transformed statistics into a powerful scientific tool based on solid mathematical principles. In 1925, Fisher published Statistical Methods for Research Workers, a landmark book for many generations of scientists. Ten years later, he wrote The Design of Experiments, a book emphasizing that, to obtain good data, one had to start with an experiment designed to supply such data. Fisher had a knack for choosing just the right example to explain his ideas. His book on experiments illustrates the need to think about how experiments are designed with an actual event: At an afternoon tea party, one of the ladies claimed that tea tasted different according to whether one poured the tea first and then added milk or did the reverse. Most of the men present found this ridiculous, but Fisher immediately decided to test her assertion. How would one design an experiment to demonstrate conclusively whether or not the lady could indeed taste the difference?
It might seem like a frivolous question, but it is quite similar to the kinds of questions that scientists and social scientists need to resolve by their experiments.5 Medical research also depends on carefully designed experiments of this kind. Fisher's work firmly established statistical tools as a necessary part of any scientist's toolkit.
The 20th century saw the application of statistical techniques to a widening array of human affairs. Public opinion polls in politics, quality control methods in manufacturing, standardized tests in education, and the like have become commonplace features of everyday life. Computers now allow statisticians to work with truly massive amounts of data, and this is beginning to affect statistical theory and practice. Some of the more important new ideas came from John Tukey, a brilliant man who contributed significantly to pure mathematics, applied mathematics, the science of computation, and statistics.6 Tukey invented what he called "Exploratory Data Analysis." a collection of methods for dealing with data that is becoming more and more important as statisticians have to deal with today's large data sets.
Today, statistics is no longer considered a branch of mathematics, even though its foundations are still strongly mathematical. In his history of the subject, Stephen Stigler says:
Modern statistics... is a logic and methodology for the measurement of uncertainty and for an examination of the consequences of that uncertainty in the planning and interpretation of experimentation and observation.7
Thus, in only a few centuries, the seeds planted by mathematical questions about data have blossomed into an independent discipline with its own goals and standards, one whose importance to both science and society continues to grow.
For a Closer Look: The best scholarly study of the history of statistics is [170]. See [89] for short biographies of important statisticians and [153] for accessible popular history of statistics in the 20th century.
1 There is a technical sense of statistic which is more precise than this, but we're focusing on popular usage here.
2 See [20], Ch. 9, or [89] for more about Graunt and the Bills of Mortality.
3 See Dava Sobel's fascinating book [168] for more about this.
5 Rumor has it that the experiment was made and that the lady did correctly identify each cup of tea. See chapter 1 of [153].
6 Tukey was also a genius at coining new words, including "software" and "bit."