Chapter 9. Automated ML for Everyone
So far, you’ve seen how data scientists can use the automated ML capability in Microsoft Azure Machine Learning to build machine learning models using the Azure Machine Learning Python SDK. Not everyone has the data science expertise or is familiar with Python. Figure 9-1 shows data from a recent Gartner study indicating lack of skills as the top challenge or barrier in the adoption of artificial intelligence (AI) and machine learning.
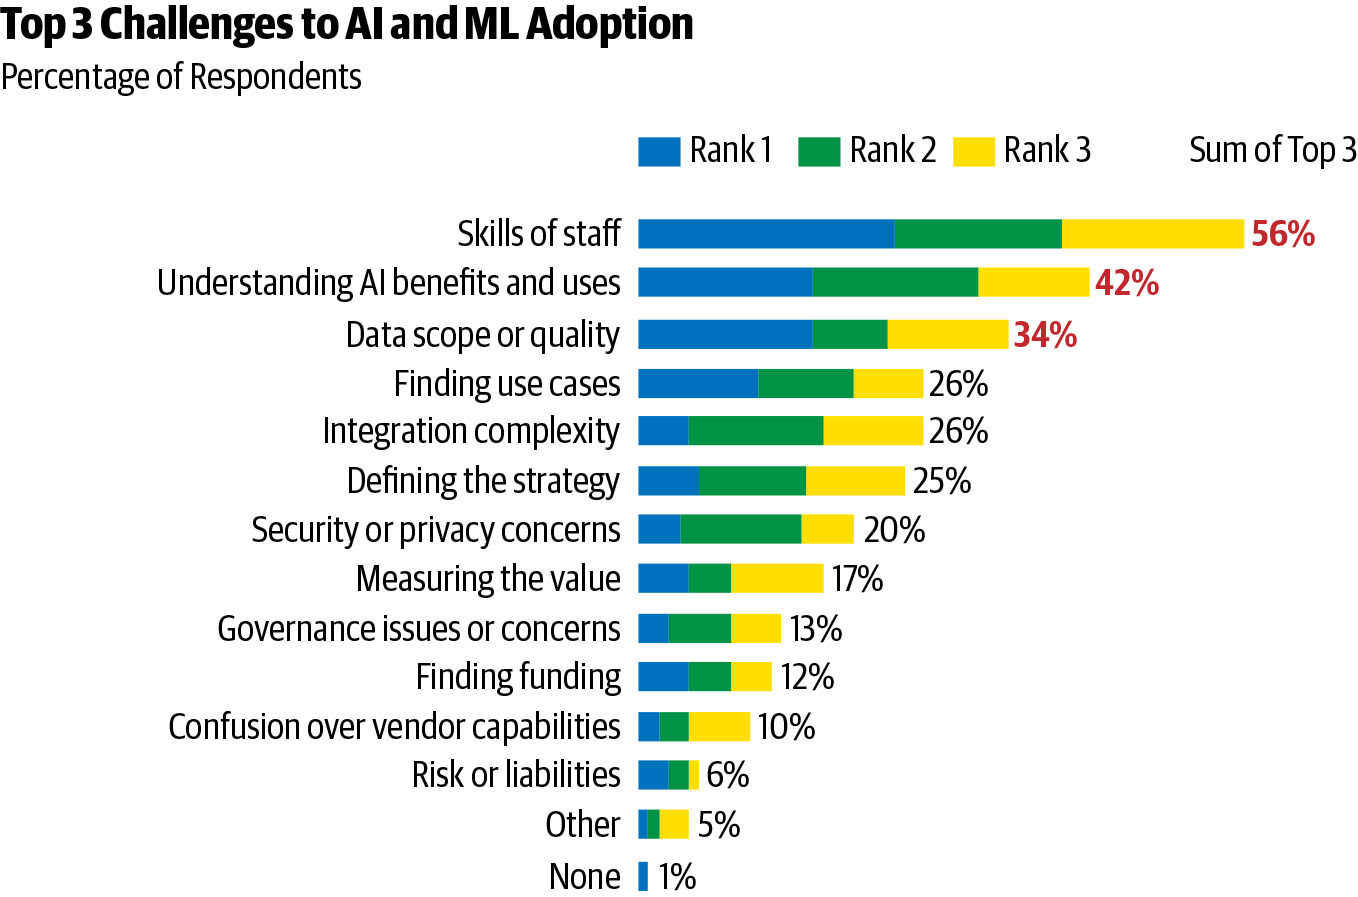
Figure 9-1. Top AI and ML adoption challenges
What if we can remove this barrier? Given the increasing demand for AI and machine learning, people in various departments and roles are becoming interested and involved. Here are a few examples of roles in which people would love to build machine learning models but lack the expertise or familiarity with Python (or other programming languages like R):
-
Domain experts or Subject Matter Experts (SMEs)
-
Citizen data scientists
-
Data analysts
-
Data engineers
-
Developers
There needs to be a simpler way to use automated ML—ideally, no-code experiences in familiar interfaces instead of having to learn new tools and techniques. In this chapter, we focus on how automated ML is being made available to users who are not experts in machine learning, with the goal of democratizing it.
Azure Portal UI
Although businesses are beginning to fully realize the potential of machine learning, they are also realizing that it requires advanced data science skills that are difficult to find. Many business domain experts have a general understanding of machine learning and predictive analytics; however, they prefer not to delve into the depths of statistics or coding, which are required when working with traditional machine learning tools. This is where we think the Azure portal UI, or Azure UI, will help.
To begin with automated ML in Azure UI, first create an Azure Machine Learning workspace and then create an automated ML experiment. We’ve covered these steps in earlier chapters, so let’s use the same workspace and create a new experiment, as shown in Figure 9-2.
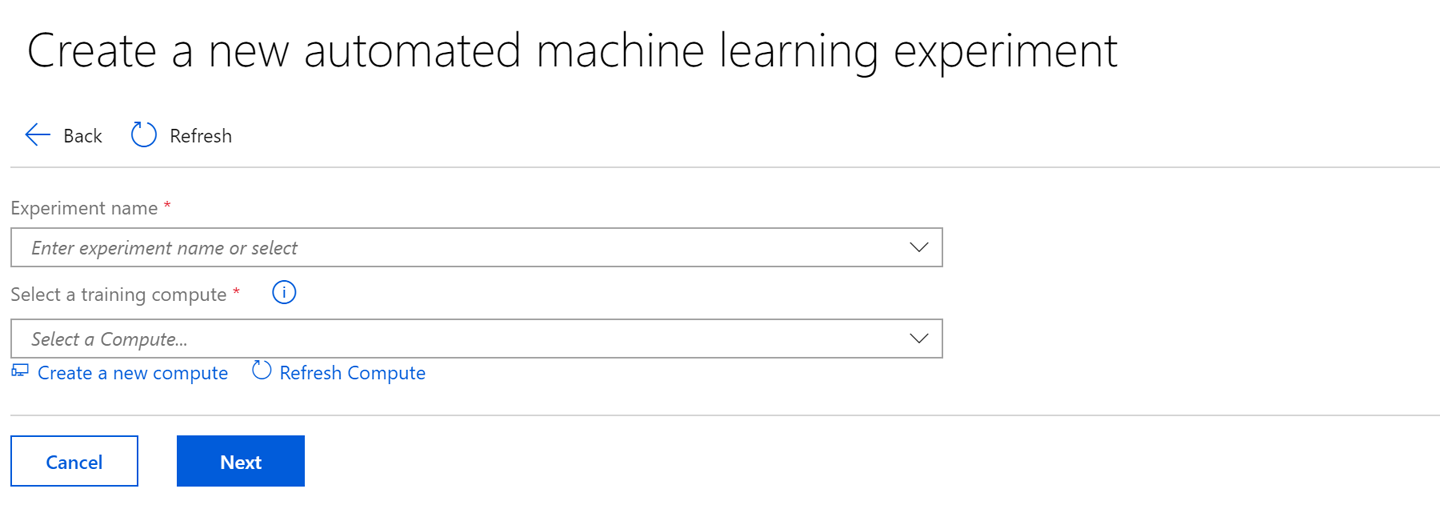
Figure 9-2. Creating a new automated ML experiment
Provide a name for your experiment. You must provide a training compute name. This is an Azure Machine Learning managed compute that will run the experiment. You can also use an existing experiment and compute, as shown in Figure 9-3.
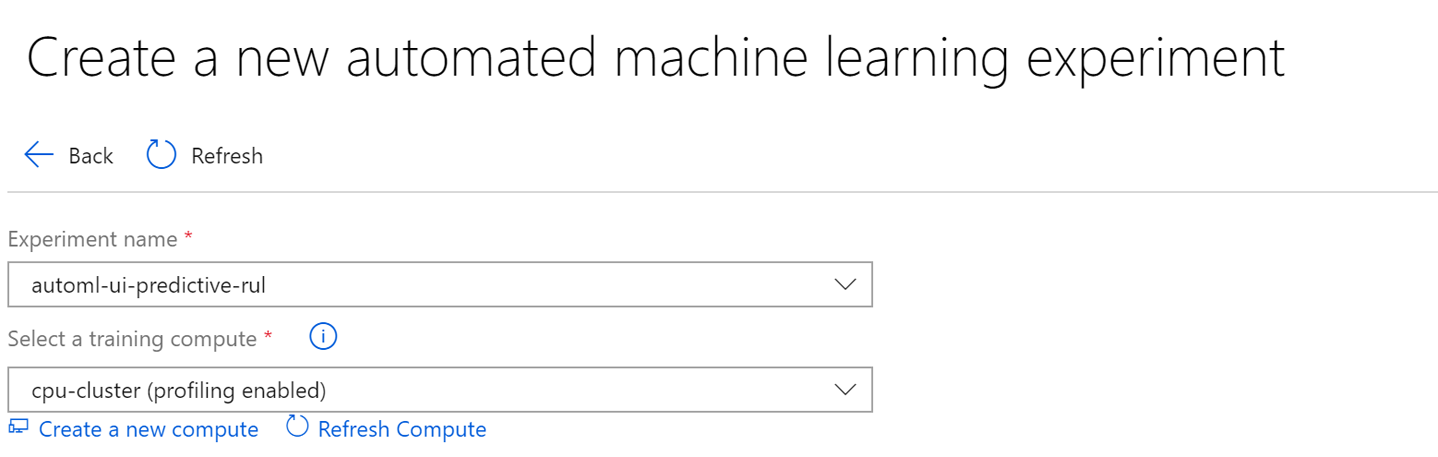
Figure 9-3. Providing an experiment name and compute selection
Next, select the Storage account that has the data for our training. As shown in Figure 9-4, you are asked to pick a comma-separated values (CSV) file from a Blob storage container that will have the full dataset including the prediction label column. This dataset is available at the GitHub repository for this book.
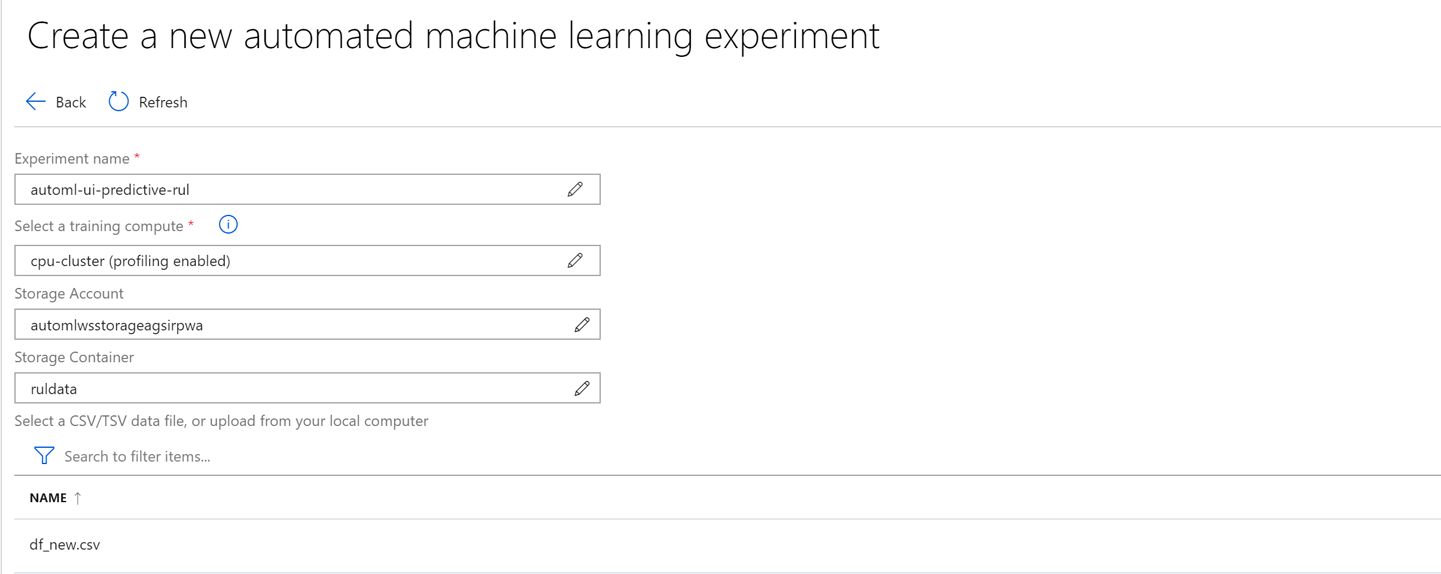
Figure 9-4. Dataset selection
Select the sensor data from NASA’s turbofan engine dataset. Once you have selected your dataset, you can preview the data and select columns that you think are relevant for the experiment, as shown in Figure 9-5.
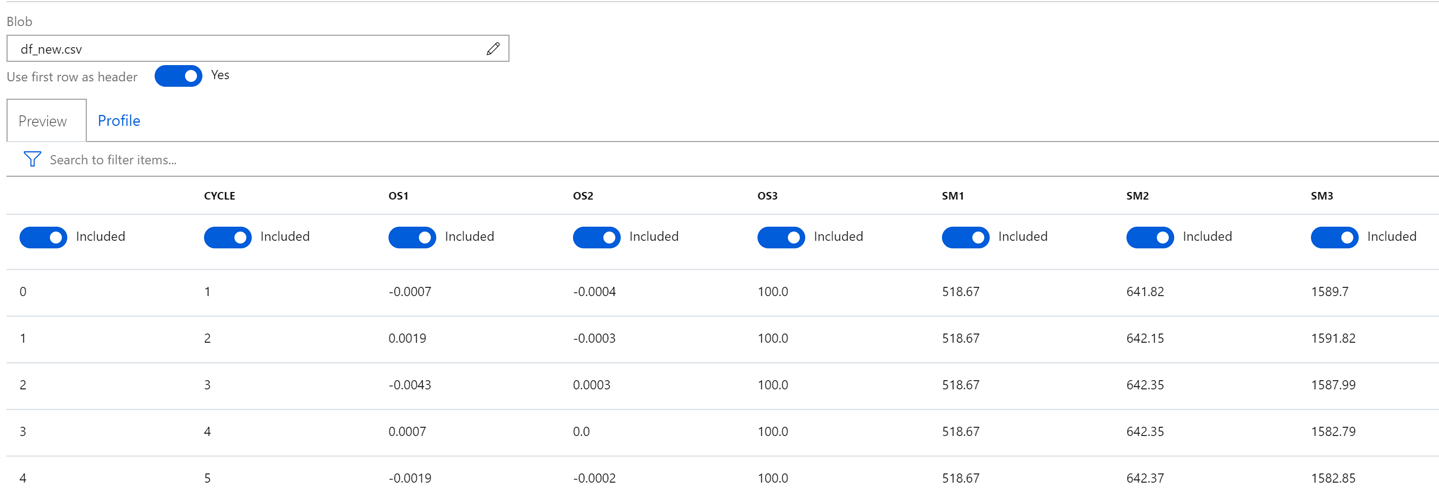
Figure 9-5. Explore the dataset
You can also see the profile of your dataset to understand key characteristics for every column within it, as shown in Figure 9-6. You can see Min, Max, and other types of profiling in the dataset.
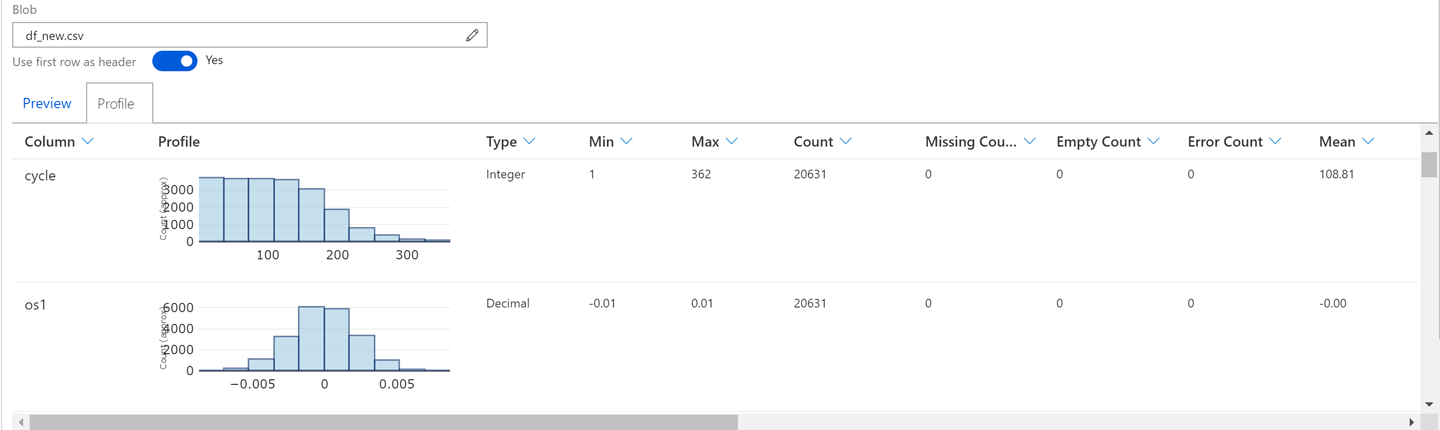
Figure 9-6. Dataset profiling
In this experiment, we will not include the index column because it won’t add value for the prediction. As shown in Figure 9-7, select Regression as the experiment type.
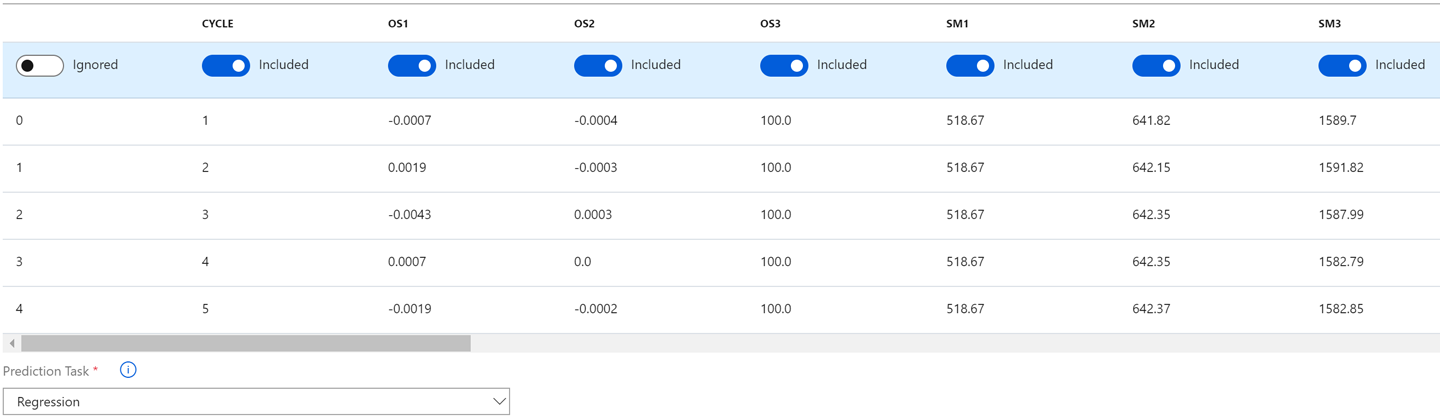
Figure 9-7. Excluding columns for training
Every automated ML experiment needs a label column. In this case, choose “rul” as the label column, as shown in Figure 9-8. This represents remaining useful life of the turbofan engine.
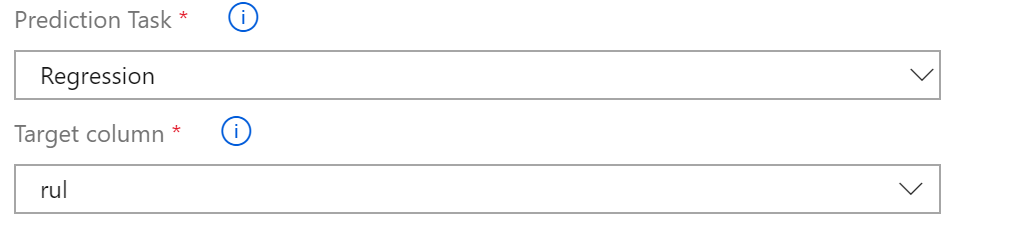
Figure 9-8. Select the task and target column
You’ll need to change some of the Advanced Settings for this experiment. Use “r2_score” as the metric, which is a common metric for regression-type problems. Next, change the “Training job time” to 30 minutes and “Max number of iterations” to 50. In real life, you might want to set the training job time to 120 minutes and maximum iterations to at least 100 to get good results.
Leave the remaining parameters as is. Figure 9-9 shows these settings.
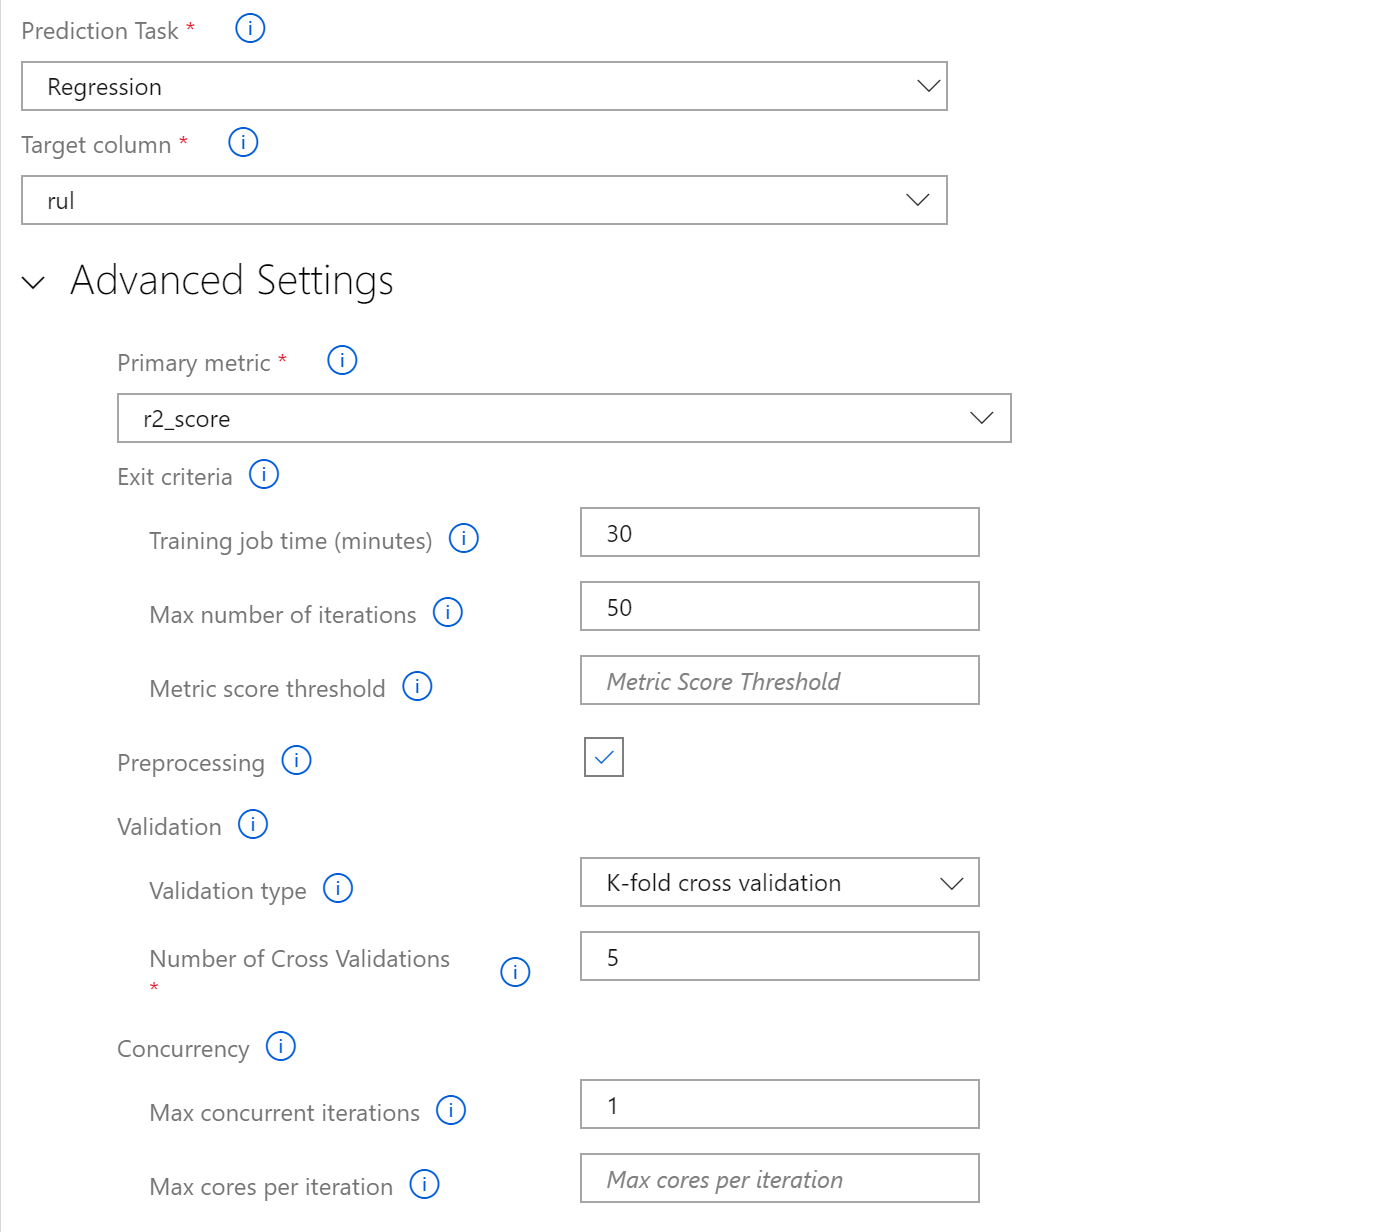
Figure 9-9. Automated ML settings
Click Start to commence the training. Figure 9-10 shows a pop-up with the new run ID.
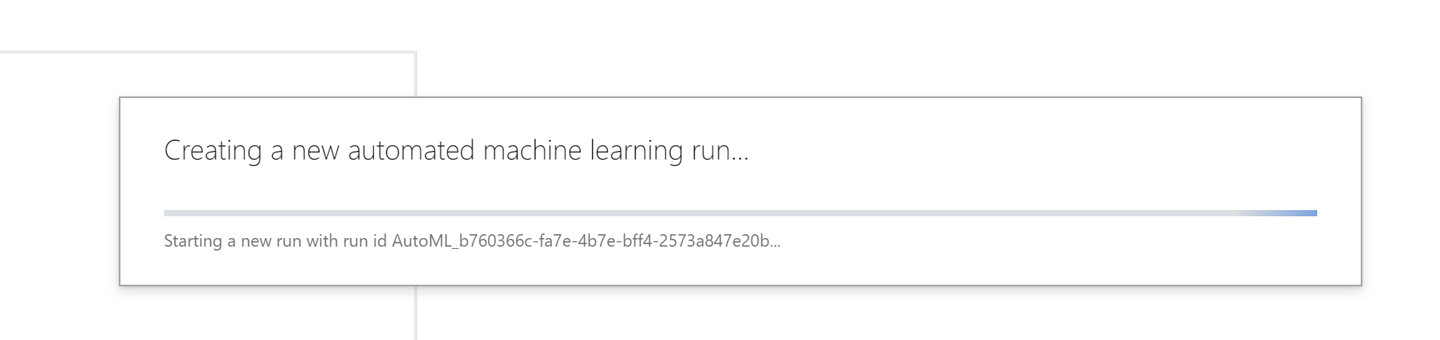
Figure 9-10. An automated ML run getting started
Initially, when the run starts, it will begin preparing the compute for the experiment, as shown in Figure 9-11. This can take a few minutes.
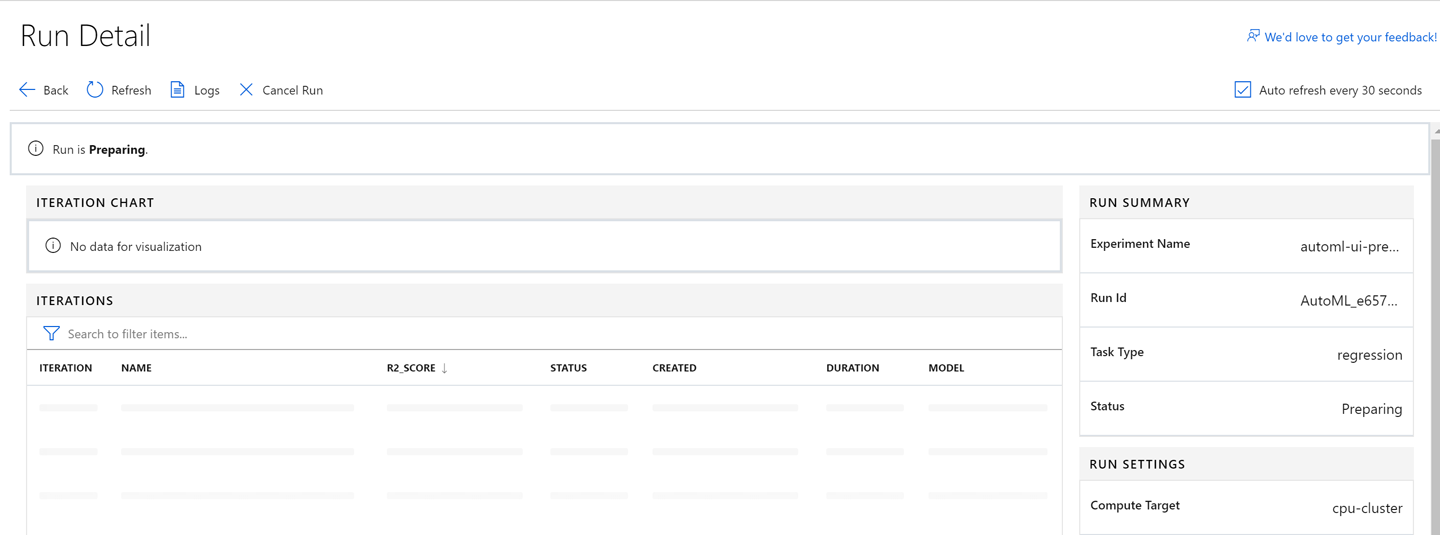
Figure 9-11. Run in preparation
When the training is running, you will see the list of models ranked based on the metric. You can also see how many iterations have been completed. The UI autorefreshes, as shown in Figure 9-12.
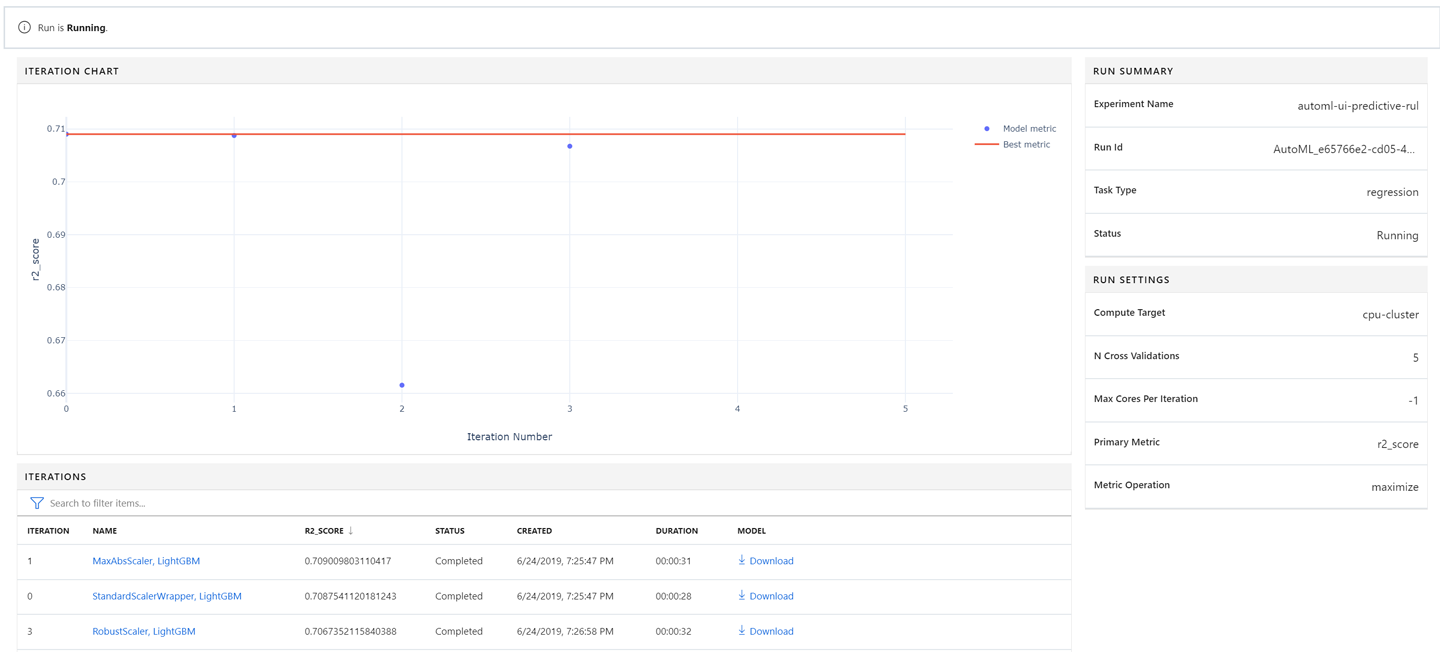
Figure 9-12. Training in progress
After a few minutes, you see the experiment has completed and can see a nice chart with all iterations, as shown in Figure 9-13.

Figure 9-13. View of completed training
You will also see a table with a list of iterations sorted based on highest to lowest r2_score metric, as shown in Figure 9-14.

Figure 9-14. View of all iterations
You can look at details of each run by clicking its name. You can see graphs and metrics that help you to understand the model better. For example, during iteration 49, as shown in Figures 9-15 and 9-16, you can see the predicted versus true values as well as the metric associated with the model evaluation.

Figure 9-15. Summary for a selected iteration

Figure 9-16. Metrics for a selected iteration
As shown in Figure 9-17, you can download the best-trained model associated with the experiment, or from any of these iterations, and deploy it. You can do this in Azure or any suitable environment. After you’ve downloaded it, this model is in the form of a .pkl file. You can also click the Deploy Best Model button instead of manually looking at the table.
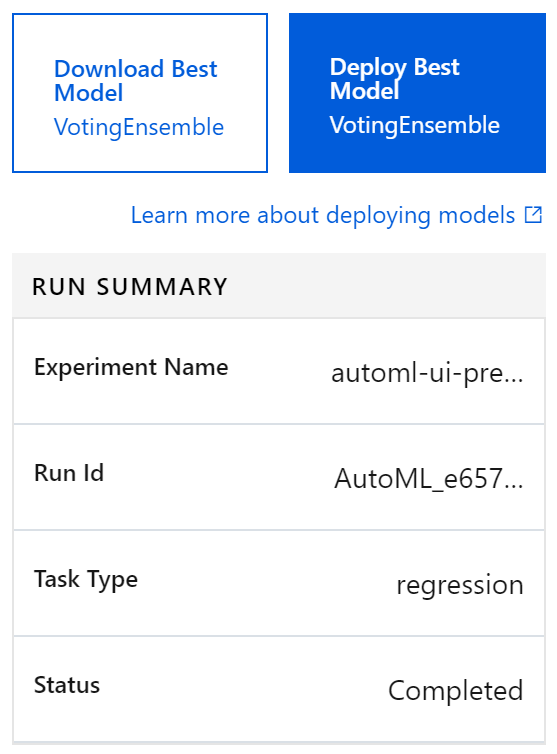
Figure 9-17. Download or deploy the best model
The steps to deploy the model appear when you click the Deploy Best Model button after the experiment has completed running, as shown in Figure 9-18.
The steps for model deployment are the same across the Azure Machine Learning service, independent of the method used to train the machine learning model. Chapter 5 covers deployment, so we don’t go in the details of it here.
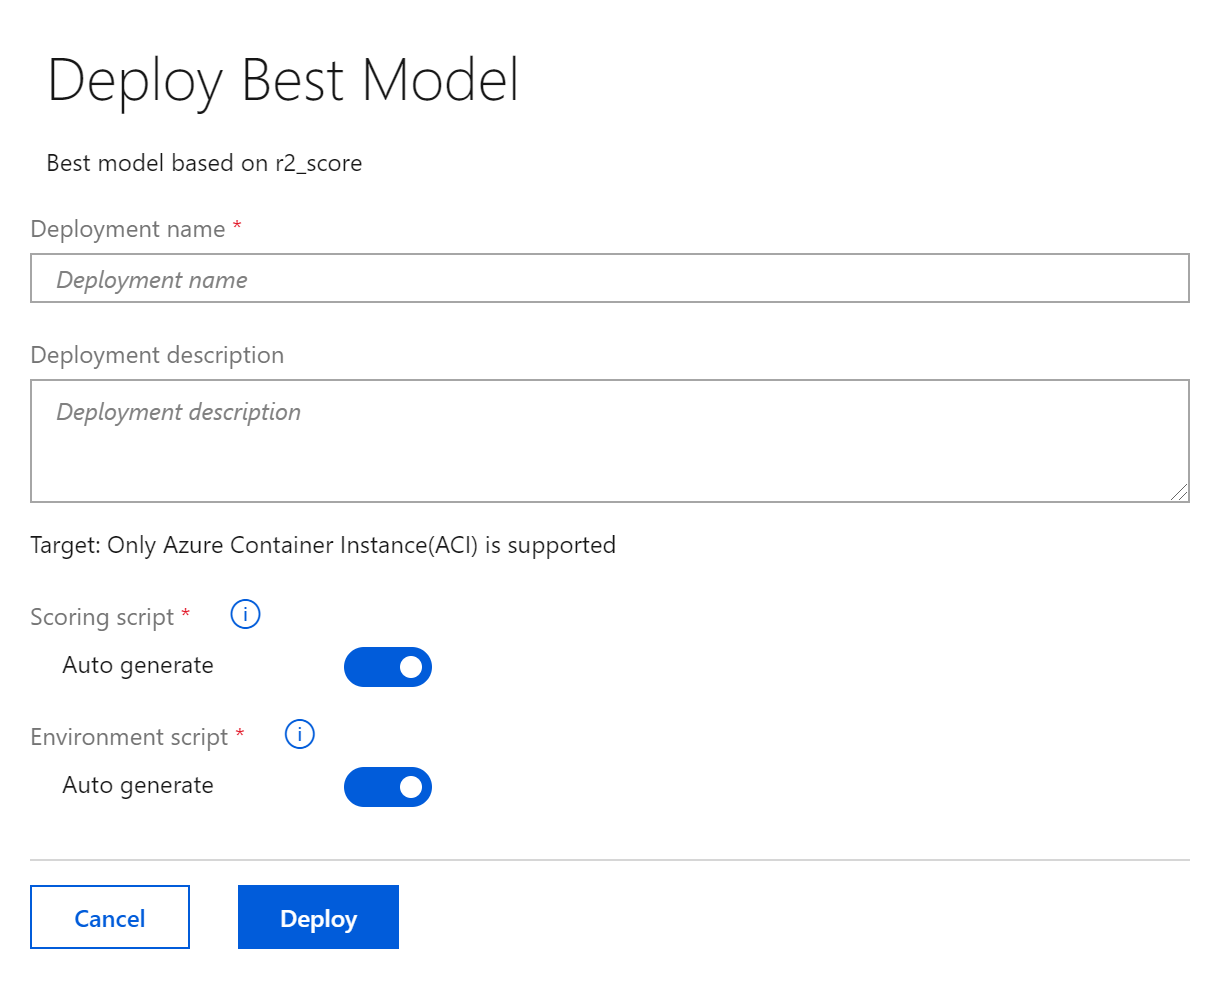
Figure 9-18. Deploying the best model
Next, let’s look at how to use Power BI to train an automated ML model.
Power BI
Many data analysts and BI professionals use Power BI for metrics, dashboards, and analysis purposes, but they’re looking to take advantage of machine learning to create intelligent experiences and processes.
We’ll use the same NASA dataset and learn how to build machine learning models in Power BI using automated ML.
Preparing the Data
As a first step, you need to create a new dataflow in Power BI. Load the NASA dataset using file Chap_9_PBI_Democratizing_machine_learning_with_AutomatedML.csv from http://bit.ly/2meKHs8.
Go through a new dataflow creation and create a new entity. Power BI dataflows support importing data of many formats and sources, as shown in Figure 9-19. For this experiment, choose the Text/CSV option.
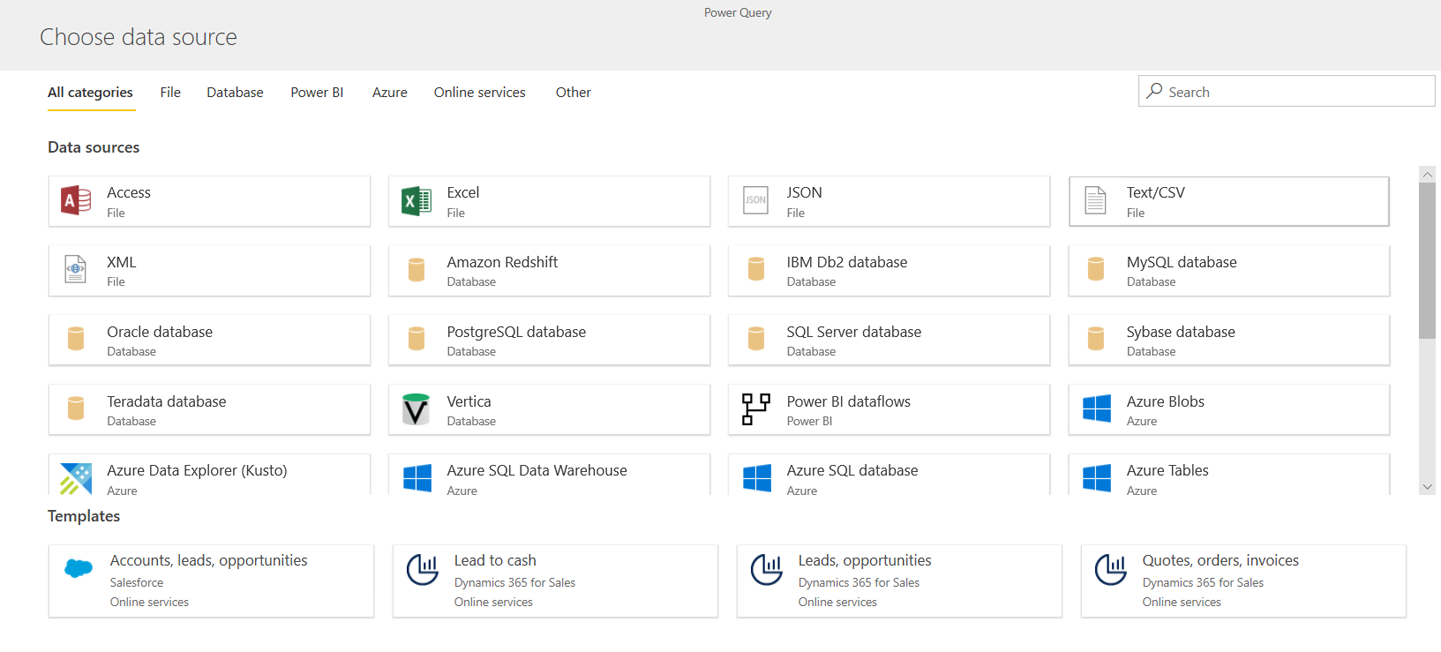
Figure 9-19. Data source selection
Select the dataset path as shown in Figure 9-20.
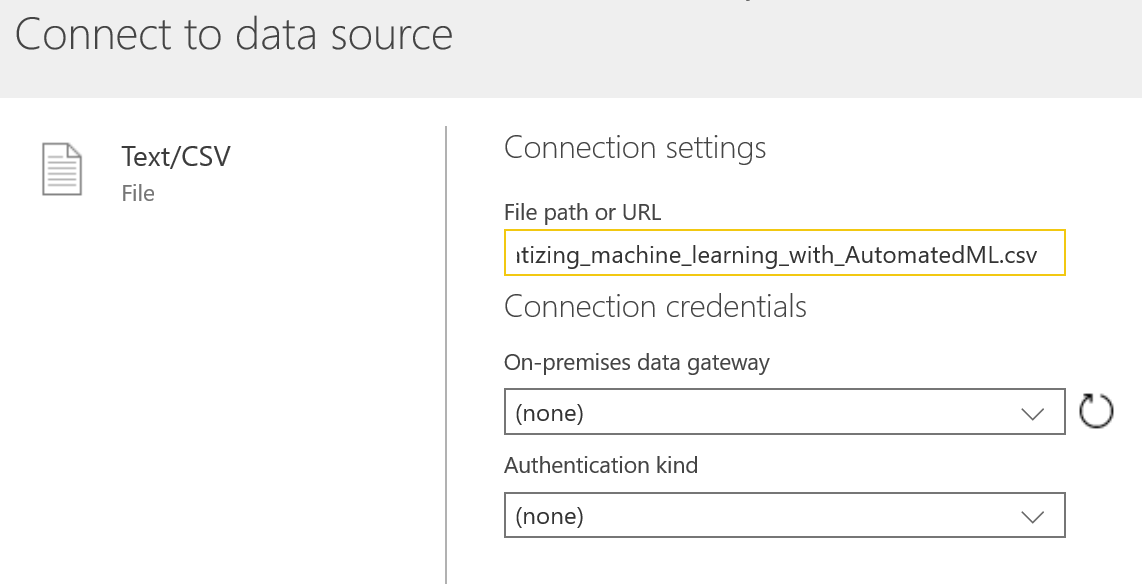
Figure 9-20. Select path for CSV file
Review the data in the newly created entity and then click “Save & close,” as demonstrated in Figure 9-21.

Figure 9-21. Reviewing the data
Automated ML Training
Now, you have a data entity ready to go. You will notice a brain icon in the options for the newly created entity. You can create a new machine learning model by clicking this option, as shown in Figure 9-22.

Figure 9-22. Adding a machine learning model
Next, you’ll go through the automated ML authoring steps. Given that the focus is on data analysts and BI professionals who might not have sophisticated data science expertise, this process is very simple. The first step is to choose the data entity (which is autoselected here because we started from that data entity) and the label column that you want to train on. This is shown in Figure 9-23.
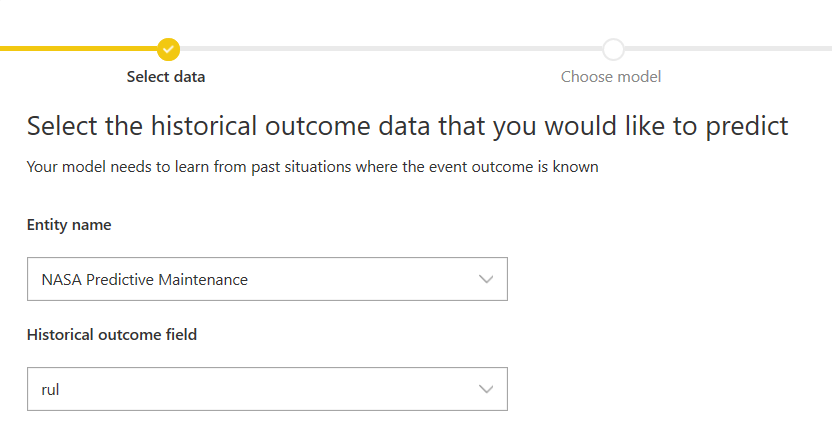
Figure 9-23. Selecting the data entity and label column
The system will try to analyze the label column and recommend the appropriate model type. In this case, it is a regression model, as shown in Figure 9-24.
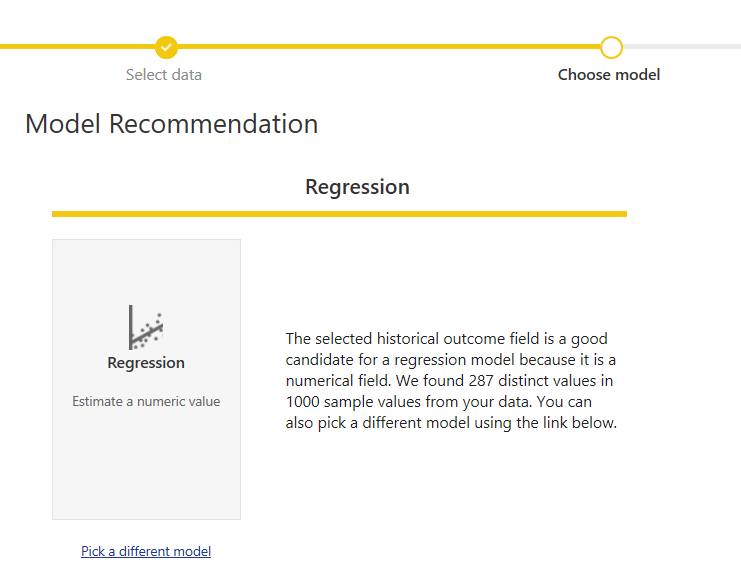
Figure 9-24. A model type recommendation
You also have flexibility to choose a different model type if you want, as shown in Figure 9-25.
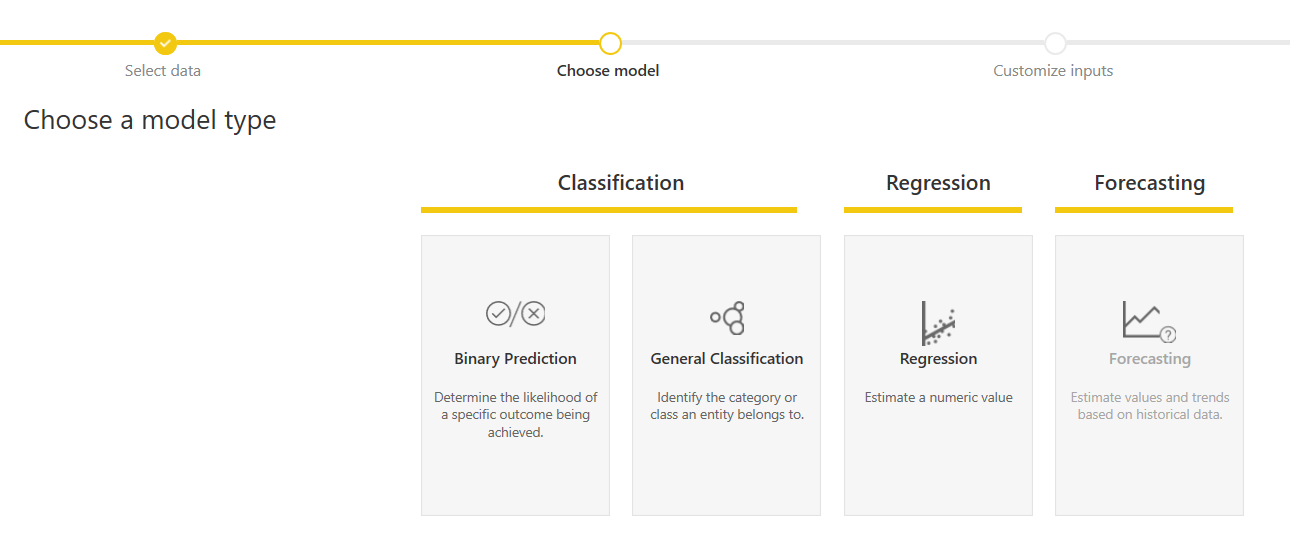
Figure 9-25. Model type selection
Going ahead with modeling this as a regression problem, the next step is to select input features. The system will suggest features, but you have the option to select the ones that you prefer, as shown in Figure 9-26. You can manually deselect a column like “unit,” which is not helpful for predictions.
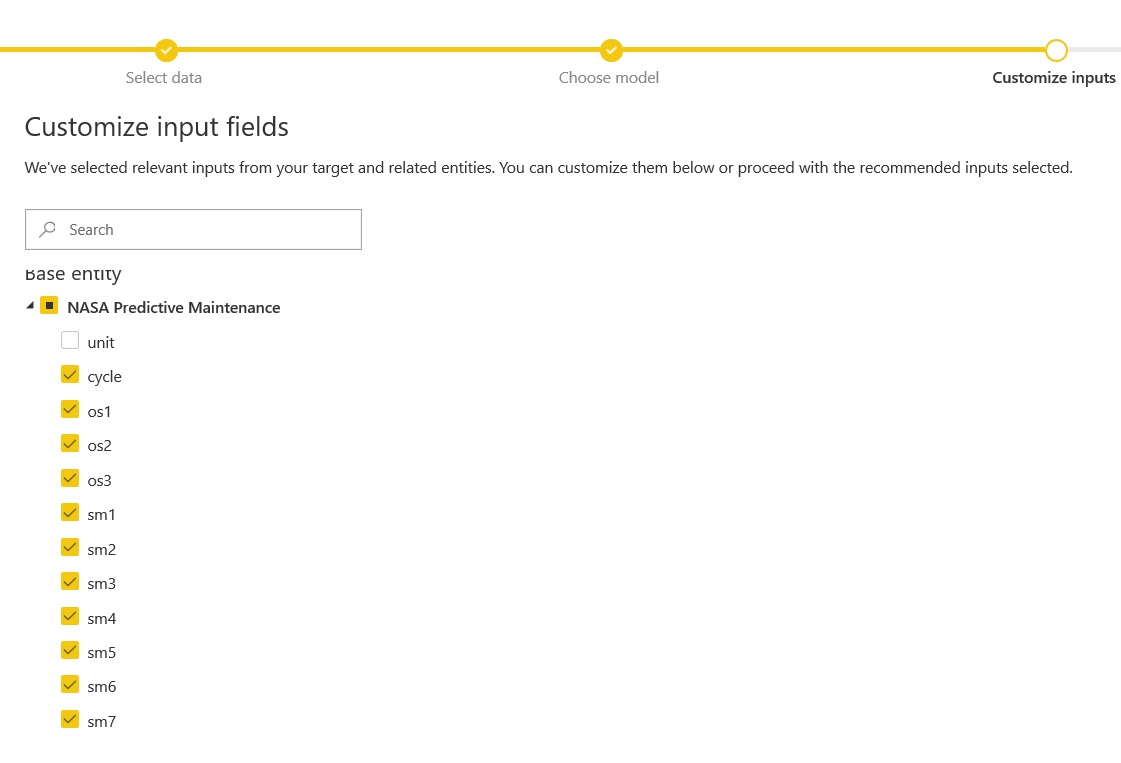
Figure 9-26. Feature selection
In the final step, shown in Figure 9-27, you provide the model with a name and submit it for training.
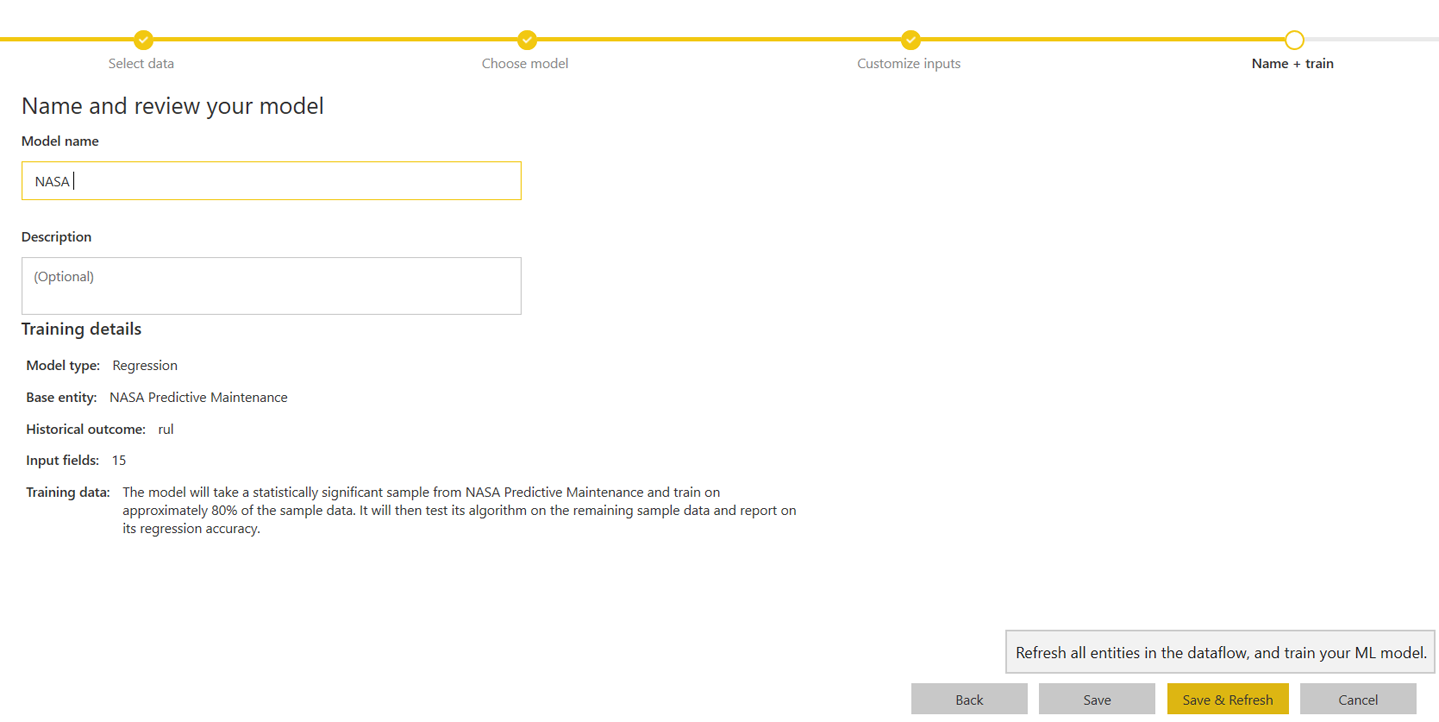
Figure 9-27. Starting training
This is when automated ML is invoked to train multiple models with the goal of producing a good one for this scenario.
Understanding the Best Model
When the training is complete, you will receive a notification with a link to a report that can help you to more clearly understand the best model as well as the training process.
For the best model, Figure 9-28 shows metrics and details of model performance. Unlike Azure UI that you saw earlier, Power BI directly gives you the best model to simplify decision making.
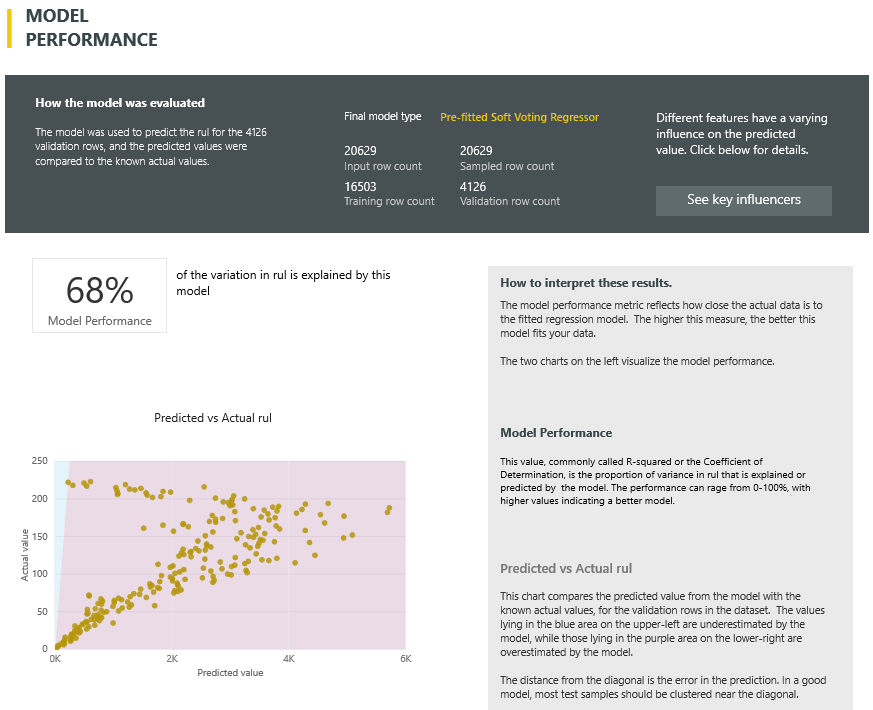
Figure 9-28. Model performance
Figure 9-29 demonstrates how this report also provides details on featurization as well as algorithm and hyperparameter values for the best model.
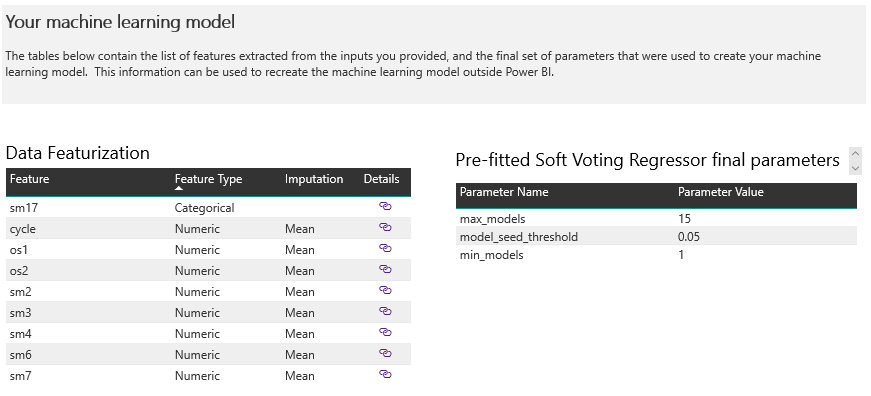
Figure 9-29. Featurization and algorithm/hyperparameters
In this example, the best model is an Ensemble model, and so we get to see more details on the composition of this model, as depicted in Figure 9-30.
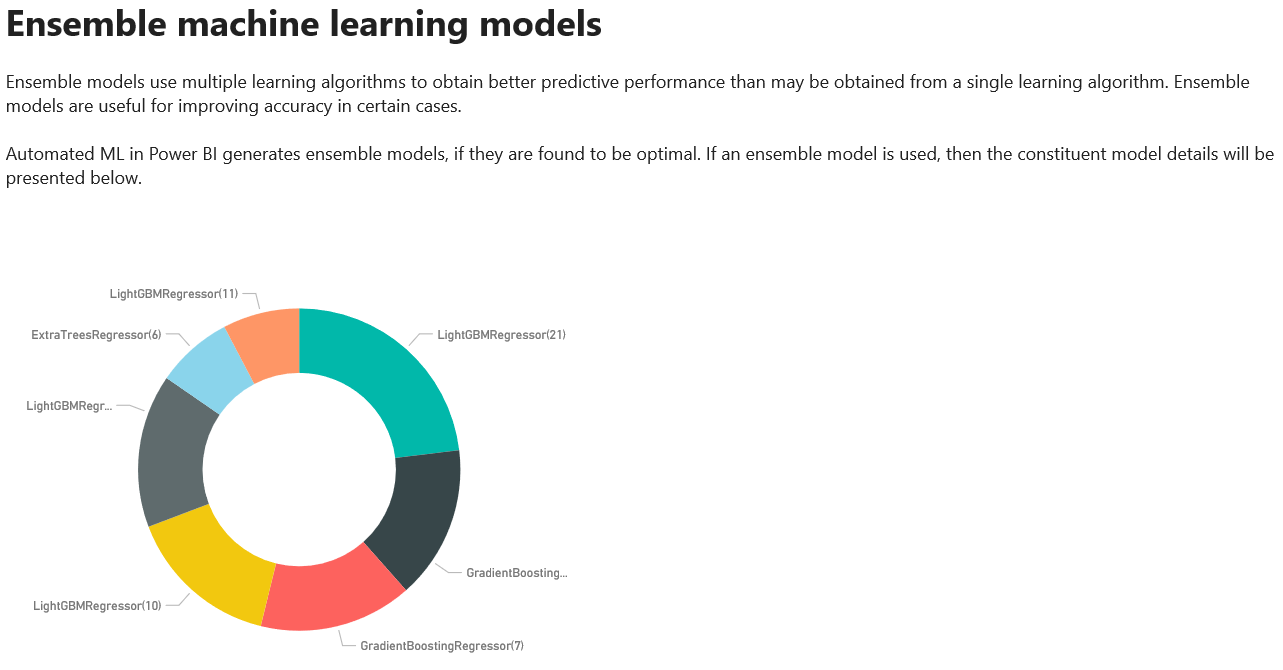
Figure 9-30. The Ensemble model details
This report also has an option to get feature importance or key influencing features for the model. Figure 9-31 illustrates that number of cycles and sm4 are the top features influencing the model quality.
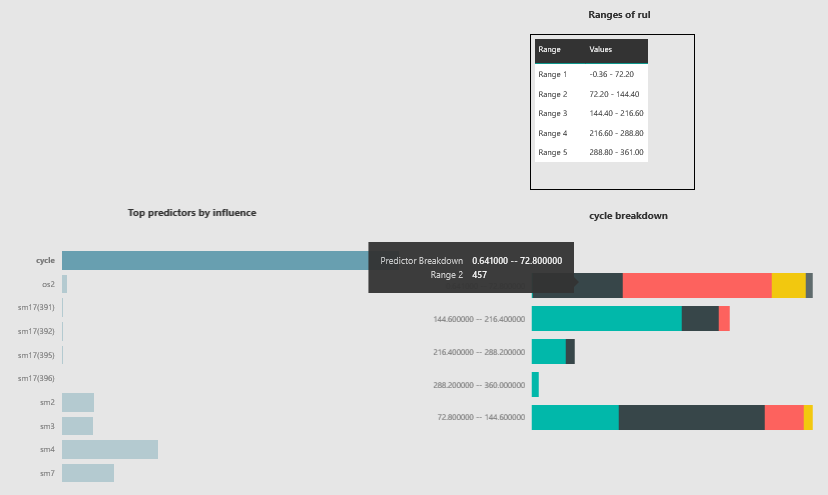
Figure 9-31. Feature importance
Understanding the Automated ML Training Process
The next section of the report provides details on the training process, as shown in Figure 9-32. Here, you can see the model quality across different iterations.
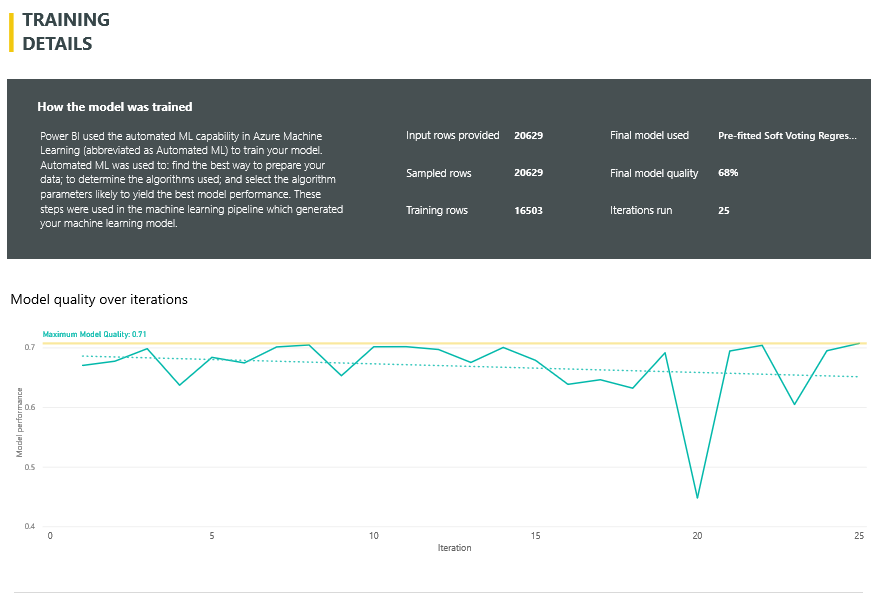
Figure 9-32. Automated ML training details
The model performance report also provides options to update the model training with new parameters and repeat the process. Figure 9-33 shows the “Edit model” option in the upper right of the screen.
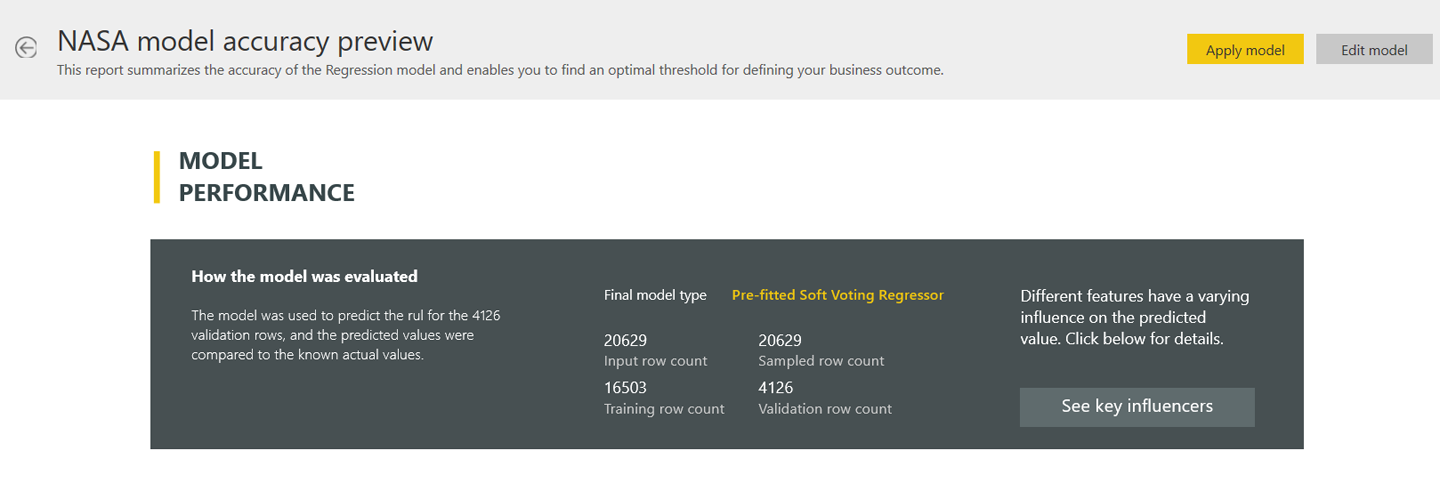
Figure 9-33. The “apply model” and “edit model” options
Model Deployment and Inferencing
When you’re satisfied with the model, click the “Apply model” option from the model performance report (as shown in Figure 9-33). This takes you through a simple and intuitive flow of selecting a testing data set/entity and having column(s) added to it, which will be populated based on this trained model. As new data records come into this dataflow entity, the newly added column will be automatically populated, inferencing the model we just built and deployed.
Enabling Collaboration
So far, you have seen how automated ML is becoming available in multiple products and tools to help users of different levels of expertise train machine learning models. As enterprises begin investing more and more in machine learning and AI, a trend is emerging in which people of different roles want to collaborate to enable the end-to-end machine learning workflow. In this section, we discuss two scenarios that demonstrate this.
Azure Machine Learning to Power BI
Although automated ML in Power BI enables data analysts to easily build machine learning models, they would also like to take advantage of models built by professional data scientists from their organization. With the AI Insights feature of Power BI, it is very easy to consume any machine learning model trained using Azure Machine Learning, including those built using the Azure UI.
You saw earlier in this chapter how you can train models using the automated ML UI in Azure and deploy the trained model as a web service. With the Power BI AI Insights feature, analysts can discover and use all such deployed web services in their Power BI workloads. Let’s walk through the flow.
The first step is to edit the already created dataflow entity in Power BI, as shown in Figure 9-34.
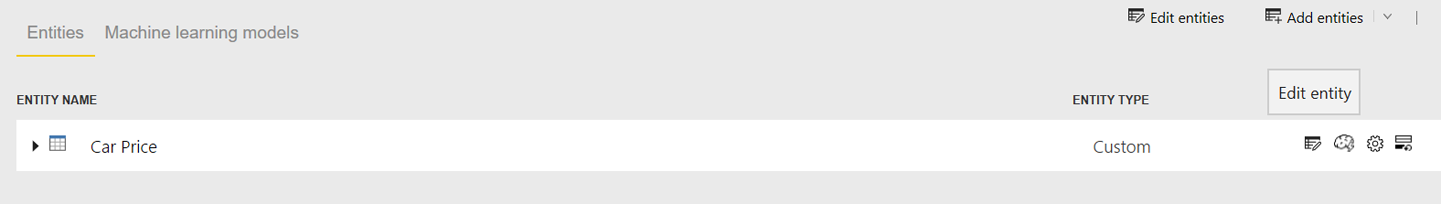
Figure 9-34. Editing a dataflow entity
Next, click “AI insights,” as illustrated in Figure 9-35.

Figure 9-35. Selecting “AI insights”
This queries all Azure Machine Learning–deployed models available to use. As shown in Figure 9-36, select the relevant model for the dataflow entity that you’re using and then click Apply.

Figure 9-36. AI Insights; selecting the relevant model
This appends a new column to the entity with a prediction based on the model, as depicted in Figure 9-37.

Figure 9-37. Prediction
You now understand how analysts can consume a model trained using Azure Machine Learning in Power BI. The flow from right to left in Figure 9-38 shows this collaboration scenario.
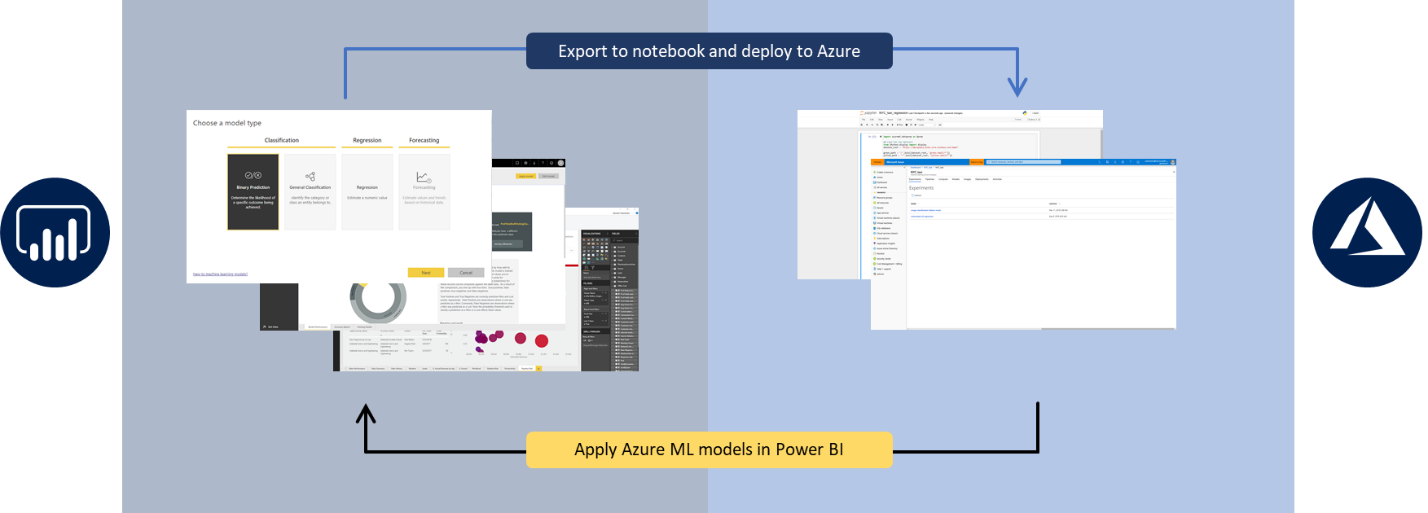
Figure 9-38. Enabling collaboration
Power BI Automated ML to Azure Machine Learning
Earlier in this chapter, you saw how analysts can use automated ML in Power BI to build machine learning models. Perhaps these analysts would like to share their models as well as training processes with professional data scientists in their organization to review, approve, or improve. This scenario could come to life if there were a way to generate Python code covering the automated ML training process that happened in Power BI. In fact, there is a way, and the flow from left to right in Figure 9-38 shows this collaboration scenario.
We expect a lot more scenarios like these to come to life in the near future to enable collaboration between different roles to make it easy to build and manage machine learning models at scale.
Conclusion
Congratulations for reaching the last chapter of the book!
In this chapter, you saw how anyone can use automated ML, regardless of their data science and Python expertise. This trend is expected to continue as automated ML continues to integrate with various products and tools that users already know and love. This demonstrates true simplification and democratization of machine learning and AI.
You began this book learning about the innovations happening in the machine learning community and on Azure. These innovations are enabling automated machine learning. You learned how Azure Machine Learning is making it possible for data scientists to manage the entire machine learning life cycle, training various types of models (e.g., classification, regression, and forecasting) using Automated Machine Learning. We also examined model interpretability and how Azure Machine Learning is providing data scientists with insights into feature importance, and more. You learned how to build container images, test the deployed model, and deploy it to various compute environments–from a REST API on Azure, to containers or edge devices, and more.
We are excited about what Automated Machine Learning will enable you to do, and we can’t wait to hear about the AI solutions that you’ve built!