Wireshark (née Ethereal; see http://www.wireshark.org/faq.html for details) is the premier free open source multiplatform packet capture and protocol analysis tool. It outperforms tools costing thousands of dollars. It really does deserve its own book (in fact, there already are several), so this is a quick-and-dirty overview of how to use Wireshark in common situations. If this tool excites you, I recommend digging deeper; there is a lot under the hood. Wireshark itself does not actually capture packets; it leverages libpcap (or WinPcap if on Windows) to perform those duties. Incidentally, you can install Wireshark without these libraries, and it works fine for analyzing static pcaps; it just does not capture new ones. libpcap and WinPcap both use the Berkeley Packet Filter (BPF) syntax, just like tcpdump does, which is handy since you do not have to learn yet another filtering language to use it.
This concept is important when using Wireshark. BPF filters control what is loaded into memory for analysis, while Wireshark Display Filters (WDF) controls what gets shown on the screen at any one moment.
What if you want a console-based packet capture utility such as tcpdump, but still use the advanced display filters that Wireshark provides? Say hello to TShark (née tethereal), Wireshark's console-based little brother. TShark even lets you use display filters to select which packets to save to disk (see the "TShark Techniques" later in this chapter).
Wireshark and TShark also support reading pcap files captured from other sniffers (such as tcpdump) in almost every conceivable packet capture format, and can also save pcaps into several formats as well, making it a sort of pcap file conversion program as well.
Getting Wireshark installed depends on your operating system, of course, but it comes as a precompiled binary for Windows. Several distributions of Unix also include precompiled binary packages, most notably OS X (through Darwin Ports or Fink), Debian, FreeBSD, Gentoo (although compiling is recommended), HP-UX, Mandriva, NetBSD, OpenPKG, Red Hat/Fedora Core, rPath, and Sun Solaris. More distros are adding Wireshark (instead of Ethereal) as a package, so check with your distribution's package manager to make sure. If your distro is not supported with a precompiled package, you can always download source from http://www.wireshark.org/download.html and compile it by hand.
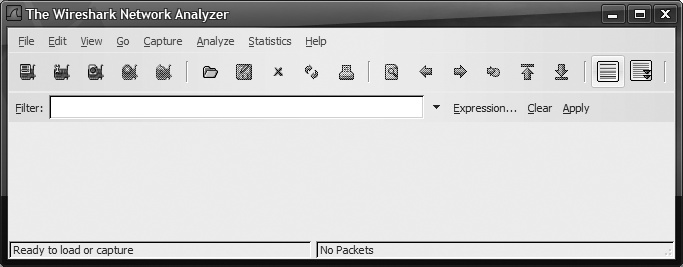
Figure 18-1 shows the initial startup screen from the Windows version of Wireshark, but thanks to GTK+, other operating systems look very similar.
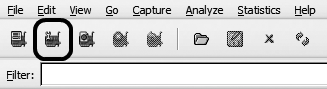
The button bar across the top has some very useful buttons. The first one we are going to play with is the second button from the left. This is the Capture Options configuration button, shown in Figure 18-2. Before we can tell Wireshark to capture for us, we need to tell it what we want to capture and from what interface. Click the wrench to open the Capture Options window shown in Figure 18-3; alternatively, you can press Ctrl-K or select Capture → Options from the menu bar.
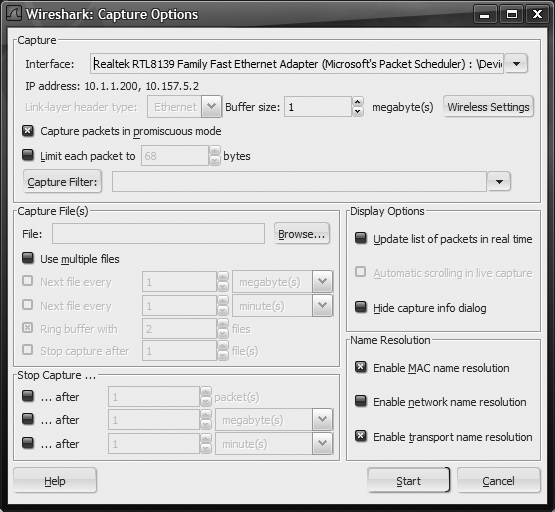
- Update list of packets in real time
- Automatic scrolling in live capture
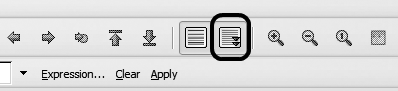
Only relevant if the "Update list of packets in real time" option is set. Always scrolls the display so the last packet (at the bottom) is displayed. Can be frustrating in a high-bandwidth environment in case you are trying to select one packet you saw, but the display keeps scrolling. Very useful in medium-to-low bandwidth situations; otherwise, leave it off. This can also be set on the fly with the Auto Scroll Packet List in Live Capture button on the toolbar. See Figure 18-4 for an example of the Autoscroll Button.
- Hide capture info dialog
- Enable MAC name resolution
A network card's burned-in MAC address consists of six bytes—the first three are the Organizationally Unique Identifier (OUI) assigned to the manufacturer by the IEEE (see http://standards.ieee.org/regauth/oui/index.shtml for a searchable database), while the last three are a generally incremented serial number generated by the manufacturer. The database is about 1.5 MB and is included in Wireshark. What this means from a practical standpoint is that Wireshark can guess at the manufacturer of the NIC you are capturing. Turning on this option enables the display (Wireshark uses an internal database to determine the manufacturer). If you want to hunt down a machine, turning this on might help, as companies such as IBM and Dell sometimes use their OUI's for their systems.
- Enable network name resolution
- Enable transport name resolution
If you are using Windows Remote Desktop Protocol (RDP) to remote into a system that you are using Wireshark to capture traffic, it is also smart to filter out RDP traffic using
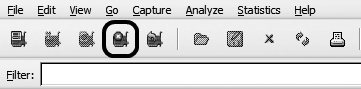
not tcp 3389. This is similar to thenot tcp 22filter (mentioned in tcpdump) when performing tcpdumps from an SSH session.When you have had enough capturing, click the Stop button in the Capture Info dialog window (if you have not disabled it), click on the Stop button on the toolbar (as shown in Figure 18-5), press Ctrl-E, or select Capture → Stop from the menu. If you are not already displaying in real-time during the capture, the different display panes now fill with packets and packet details.
If instead of capturing packets live on your system, you want to analyze a previously captured pcap, you can select File → Open from the menu bar, press Ctrl-O, drag-and-drop a pcap file into an open Wireshark window, or just double-click on a pcap file to open it (if your system is configured to use Wireshark as your default pcap file handler). If it is an especially large pcap, a progress bar displays showing you how long it takes to load the entire pcap. I tend to avoid pcaps larger than 20 MB.
Once you have a pcap in memory (either from performing a capture or from loading a file), you will see three different panes (by default, they are arranged top-to-bottom as Packet List, Packet Details, and Packet Bytes, which can be adjusted in the preferences).
The Packet List pane at the top provides a list of all packets in memory; it should be quite colorful. This is where you select which packet to view the details of; click a line to select that packet for viewing.
The Packet Bytes pane at the bottom shows the raw packet bytes in both hexadecimal and ASCII. As you select different fields in the Packet Details pane, this bottom pane updates, highlighting where this field is in the raw bytes. The panes themselves are resizable: hover your mouse over the partition between panes and the mouse cursor changes to a resize pointer, allowing you to drag the bar to your desired size. See Figure 18-6 for an example of a packet capture loaded in Wireshark.

Take a look at Figure 18-6 for a bit—see how there is a bar highlighting a packet in the upper pane (packet 4)? The bar appears as light blue on the screen. This shows you which packet detail you see in the middle pane. Now look at the bar highlighting the GET / HTTP 1.1 line in the middle pane. This shows what is being selected for highlight in the bottom pane. The bottom pane shows the raw bytes from the packet, and the GET / HTTP 1.1 is highlighted in both hexadecimal (to the left) and ASCII text (to the right).
Wireshark analyzes each packet layer by layer and breaks out all kinds of useful information. Sometimes, there's just too much information to see what we are looking for—the proverbial needle in the haystack. This is where the Wireshark Display Filters come in handy (i.e., the Filter bar underneath the button toolbar). Earlier versions of Ethereal placed the Filter bar at the very bottom of the window (and in fact, you can move it back down there by changing a preferences parameter). The bar is color-coded to indicate when a properly formatted display filter has been set—red for error, green for valid.
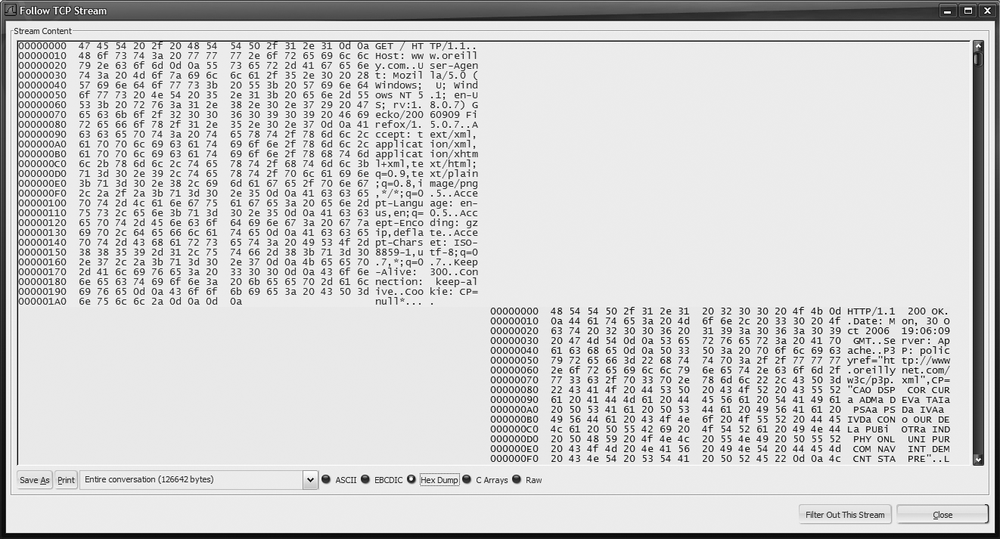
This session display window is extremely useful. By default, it opens in ASCII mode (which is useful for printable protocols such as HTTP, SMTP, FTP, and POP3). It displays client-side packets (the side that started the connection) in red and server-side packets in blue. In ASCII, EBCDIC, and Raw modes, it streams packet payloads together in a continuous stream, while in Hex Dump and C Arrays modes, it displays each packet payload's content as a separate element. See Figure 18-7 and Figure 18-8 for examples.
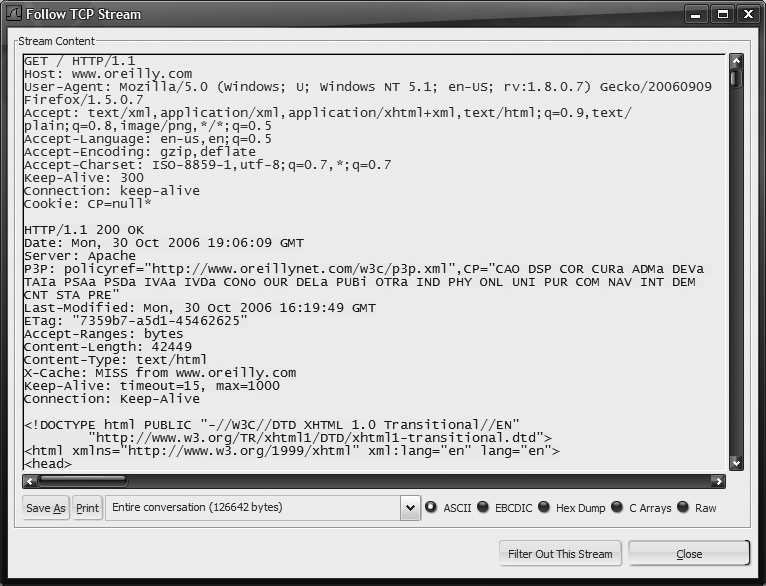
As you can see from Figure 18-7, ASCII mode is especially useful at viewing printable protocol stream contents.
Looking back at the main packet-viewing window, you see this also generated a filter similar to the following:
(ip.addr eq 10.157.6.234 and ip.addr eq 10.157.4.10) and (tcp.port eq 80
and tcp.port eq 47438)
Notice that the syntax for WDF is decidedly different than BPF. We can still use Boolean logic and even nesting, but there is also a sense of object model or structure here. You select a decoder as your base filter object and then use dots to select parameters from that decoder. In this case, the ip and tcp decoders are being leveraged and we are checking the addr subparameter on the ip decoder as well as the port parameter on the tcp decoder. As new decoders are added, additional filter options are created. The ability to use add-on modules to expand its features is one of the powerful aspects of Wireshark.
Another useful filter is http.request, which gives you all HTTP URLs.
The following combination cleans out any non-IP traffic and ignores SSH and RDP:
ip && !(ssh || tcp.port == 3389)
In addition, nearly any decoded field can be turned into an instant filter. To do so, right-click a parameter, and drill-down a layer (for example, Hypertext Transfer Protocol → GET → Request Method), and the menu appears (where we used Follow TCP Stream earlier); this time, note the "Apply as Filter" and "Prepare as Filter" options, which are shown in Figure 18-9.
The difference between the two is that Apply as Filter creates and applies the new filter, while Prepare as Filter simply creates the new filter without applying it. The benefit of this is if you are crafting a complicated or multistep filter against a very large pcap file, you do not want to apply each incremental filter as they are created, since it would refilter after each application, which could take time. Going into either of these submenus gives you additional menu options:
- Selected
Replaces the existing filter with a filter that looks for the selected value in the selected parameter.
- Not Selected
Replaces the existing filter with a filter that looks for anything except the selected value in the selected parameter.
- And Selected
Appends to the existing filter an additional filter that looks for the selected value in the selected parameter with a Boolean AND; for example, both filters must match.
- Or Selected
Appends to the existing filter an additional filter that looks for the selected value in the selected parameter with a Boolean OR; for example, either filter can match.
- And Not Selected
Appends to the existing filter an additional filter that looks for anything except the selected value in the selected parameter with a Boolean AND; for example, both filters must match.
- Or Not Selected
Appends to the existing filter an additional filter that looks for anything except the selected value in the selected parameter with a Boolean OR; for example, either filter can match.
So by simply poking around your pcap, seeing things you want to see more of (or not see more of), and clicking and selecting appropriately, you can make some very complicated and powerful filters.

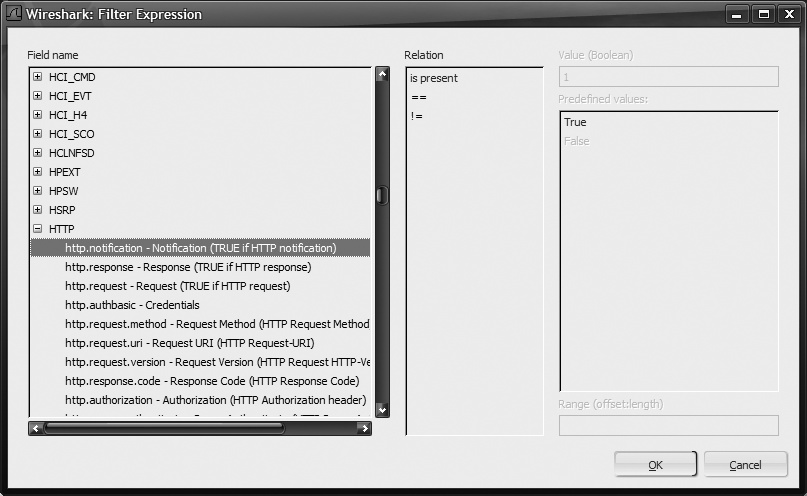
Figure 18-10 shows the Wireshark Filter Expression window, which provides an alphabetical list of every single decoder module installed with your version of Wireshark. The actual contents of this list may vary, depending on what modules you received with your build. From a quick glance, however, it is easy to see that the list is extensive.
One of the handy things you can do once you've filtered your packets such as you want them is to save just those packets to disk. The interpacket timing is maintained. To do so, just choose File → Save As, which will bring up the Save As dialog box. This next step is important and typically forgotten. To save only those packets filtered by a display filter, change the radio button at the bottom of the dialog from Captured to Displayed. Finally, give the file a new name and click the Save button. Your new pcap file will have only those packets that were allowed by the display filter.
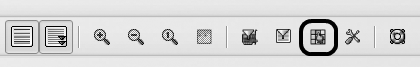
You may have noticed that the packet display pane can get quite colorful, and you may have wondered what those colors mean. Click on the Edit Coloring Rules toolbar button shown in Figure 18-11 or choose View → Coloring Rules to display the packet Coloring Rules window shown in Figure 18-12.
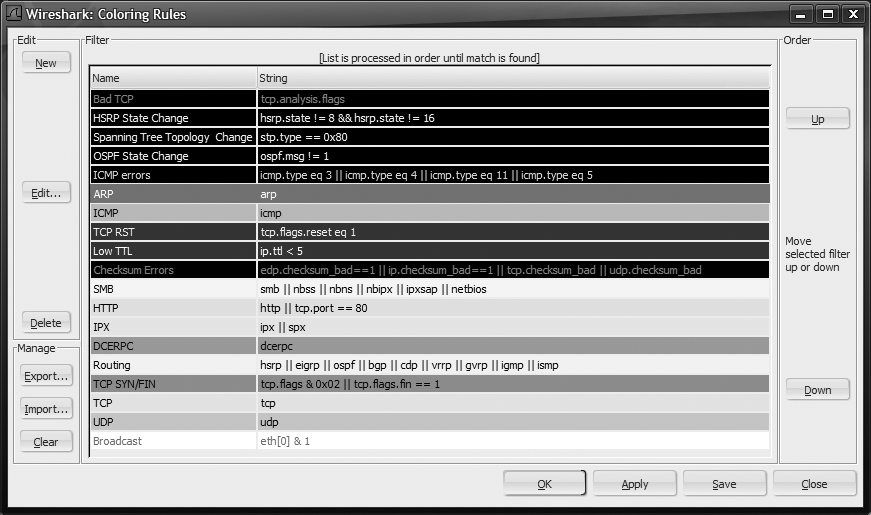
You'll have to use your imagination for Figure 18-12, since the book is in black and white (or just fire up a copy of Wireshark, and this will make more sense). The coloring rules use Wireshark Display Filters to colorize packets so they stand out from other packets. You can check what the colors mean in this window and either change the ordering, delete rules, or create your own rules. Use the tricks and techniques you learned in the previous Wireshark Display Filter sections to craft specific rules used for packet coloring.
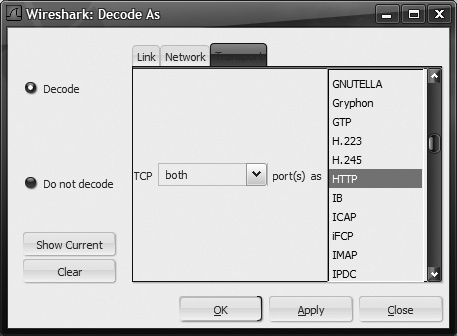
The Decode As window, shown in Figure 18-13, defaults to the highest level of decoding it knows for this particular flow, but allows you to fall back to lower levels if you wish to decode IP protocol 6 as something other than TCP, or to decode Ethertype 0x0800 as something other than IP. Generally, however, you will be playing with the Transport tab.
Change the drop-down to both, as it is also very rare to be speaking one kind of protocol in one direction and a different protocol in another (though I suppose you could do it). Select which protocol you are actually seeing here, then click either Apply to see the change right away or OK to apply and close the Decode As window. As an alternative, you can also select the "Do not decode" option, and it ignores the decoder for that layer, which is useful for when there is no decoder module for the application being examined.
If you are using Wireshark for capture (instead of tcpdump) and are experiencing some packet drops, using TShark is a smart alternative, as it uses less resources (generating a GUI costs CPU cycles). All of the Wireshark Display Filters you learned how to use can be used in TShark to display traffic as it is captured, and as a filter to save packets to disk.
The TShark manpage (http://www.wireshark.org/docs/man-pages/tshark.html) lists the complete command-line switches you can use, but the most common day-to-day switches are covered here. Many of the command-line options are the same as tcpdump. For example:
-snExamines n bytes of each packet (for example, snaplen).
-wfilenameWrites packets to
filename.-rfilenameReads packets from
filename.-iinterfaceCaptures from
interface.-DShows a list of valid capture interfaces.
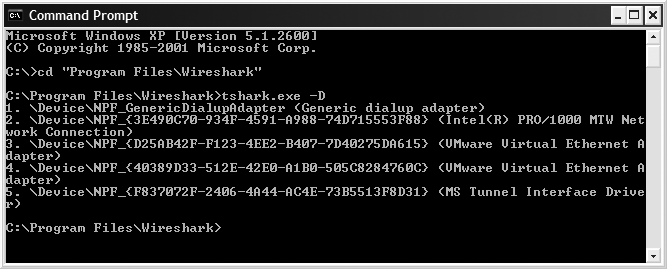
That last one is a bit of a kicker, however. For Unix systems that support
ifconfig -a, it works as expected, similar to tcpdump, in that the usual suspects are valid: eth0, ath0, wifi0, and bge0. But, for Microsoft Windows-based systems, there is no clean way to identify interfaces. For Windows, it is easiest to use the-Doption to see what interfaces are available and then use the index number from that. See Figure 18-14 for an example (note the lack of a loopback interface, as WinPcap currently cannot capture on the loopback).-f"bpf filter"Applies the supplied Berkeley Packet Filter (BPF)
bpf filterto the capture.-R"wdf filter"-dlayer type==selector,decode-as protocol
Some examples, based on Figure 18-14:
tshark.exe -i 2 -R "http.request"
This looks for HTTP requests on my Intel PRO/1000 interface (interface number 2 found from doing tshark -D).
tshark.exe -i 2 -R "http.request" -f "port 8888" -d tcp.port==8888,http
This looks for HTTP requests only on TCP port 8888 and ensure that TCP/8888 is decoded as HTTP.
Wireshark has a huge amount of ever-increasing modules that provide statistics, which is briefly discussed here. If you see a particular statistic option that you want more information about, play around with it and you will quickly become accustomed to how it works. To see how many statistic modules are currently installed, select Statistics from the menu. If VoIP is of interest to you (SIP, H.225, GSM), be sure to check out this section in detail. Of particular interest might be the Protocol Hierarchy Statistics and Conversations module.
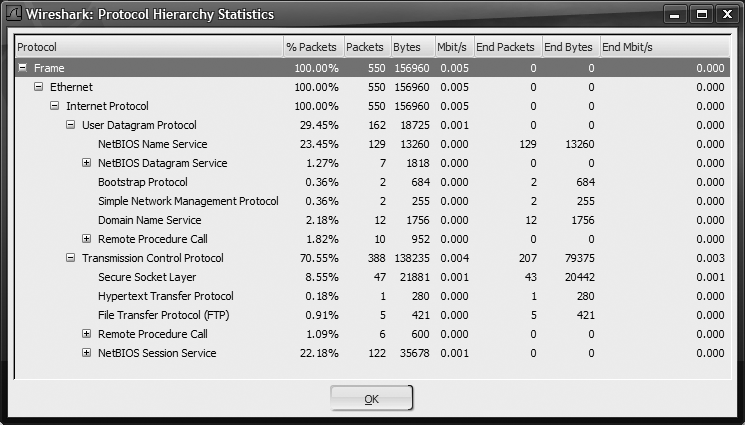
Figure 18-15 shows the Wireshark Protocol Hierarchy Statistics window. This is opened from the menu by choosing Statistics → Protocol Hierarchy. This provides a nice summary that can be drilled-down to determine exactly what sort of traffic you see in a particular capture. If you are curious to see just how much bandwidth is being wasted on NetBIOS, take a look at Figure 18-15.
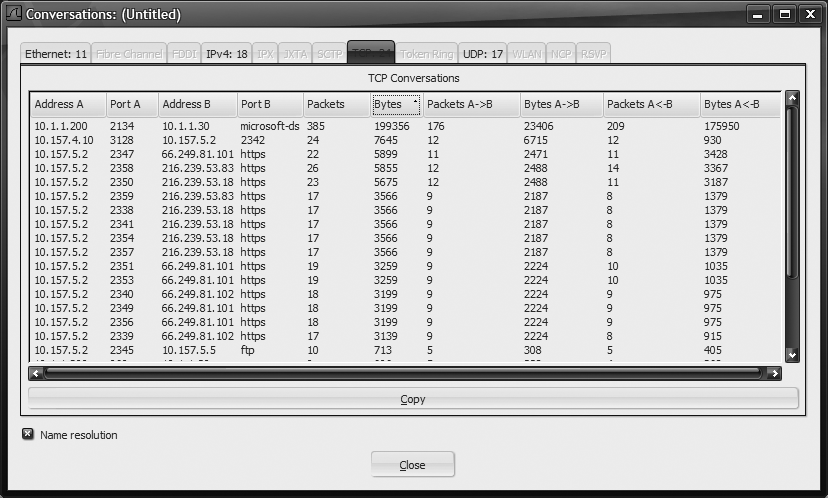
The other statistics module that is especially useful is the Conversations module, shown in Figure 18-16. This analyzes the entire pcap and sorts it by different layers. By clicking a column header, it sorts by that column; clicking an already selected column reverses the sort. This is very useful to find top talkers when using the IPv4 tab and very useful for finding large sessions when using the TCP tab.
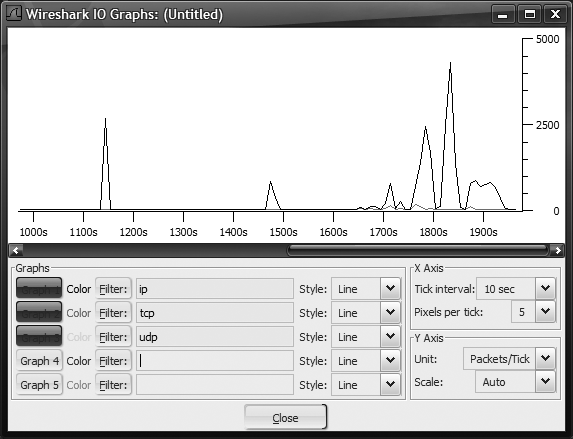
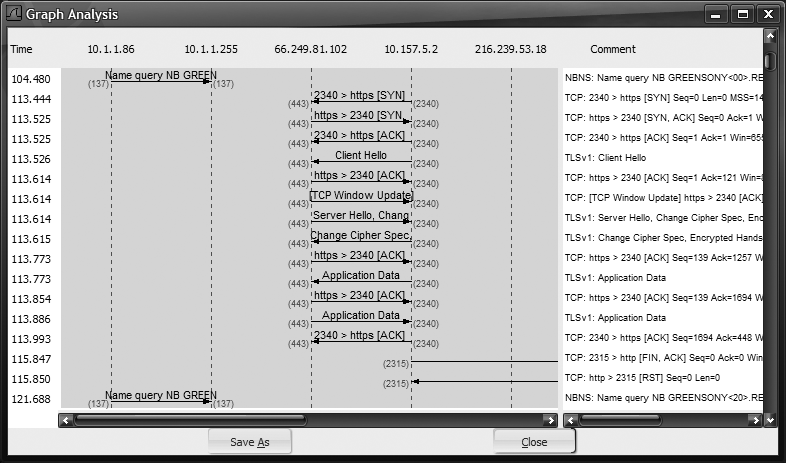
Other analytics worth mentioning are the IO Graphs, which show bandwidth used over time, and the Flow Graphs, which draw host-to-host communication flows over time They can be accessed from the Statistics menu. Samples of these graphs are shown in Figure 18-17 and Figure 18-18. What is nice about these is that you can use WDF's to filter your results.
Now that you had a chance to play with Wireshark, you no doubt noticed some things you might like to change: perhaps the packet pane layout is not how you like it, or you find yourself always selecting the same capture options and interfaces all the time. Fortunately, Wireshark allows you to make changes to the defaults that are then saved. If you find yourself always selecting all three display options in the Capture Options window, you can set it that way by default. If youare tired of confirming that you lose packet data when you start a new capture, then you can set it to not ask by default.
To bring up the Preferences Window shown in Figure 18-19, click the crossed wrench-and-screwdriver icon, and select Edit → Preferences, or press Shift-Ctrl-P.
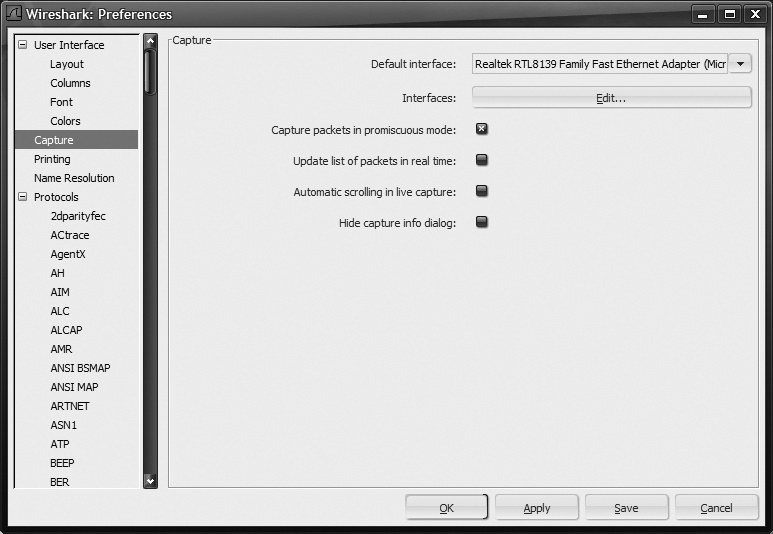
Simply make any changes you like and click Save to keep them that way.