The suite of tools available from Sysinternals is an incredible resource for anyone looking to get more information about the inner workings of a Microsoft Windows system. That means forensics and much more. The tools are in fact so good that Microsoft recently acquired the company that developed these and their commercial counterparts. The free tools are often used by developers, researchers, and reverse engineers. Here at Juniper, we use them extensively when breaking down worms or trying to get more information about a new Windows vulnerability. They really are a necessity for any sort of Windows-based live analysis.
Tip
The Sysinternals web site (http://www.sysinternals.com) is also a great resource. Check out the Information section of the site and Mark's Blog. They have the source code for most of the tools available if you care to look that far into it. Though I document some uses of the tools here, do not forget to have a look at the comprehensive documentation for each tool on the web site; it is thorough and well done.
Unlike the Forensic Toolkit from Foundstone, the Sysinternals tools tend to be more standalone in nature. Most of them are graphical tools, but a few are offered with a command-line interface. Following are descriptions of a handful of the ones that have been particularly useful when unraveling an intrusion.
Under Windows, there are so many ways to start a file automatically, but no really great tool for managing them. If you suspect your system of being infected with a backdoor or some malware, it is highly likely that something's been configured to start the bad stuff every time the system boots. Autoruns, from Sysinternals, provides an easy interface for finding out what exactly is starting itself on your system and even a few ways to look a bit deeper.
Download the latest copy of Autoruns from the Sysinternals web site at http://www.sysinternals.com/utilities/autoruns.html. Unzip the archive to a convenient location, such as c:\sysinternals. This package comes with two binaries: autoruns.exe (a graphical utility) and autorunsc.exe (the command-line version).
Figure 21-1 shows the main GUI of autoruns.exe, which we discuss in this section (you can learn more about the command-line version of Autoruns from the Sysinternals web site).
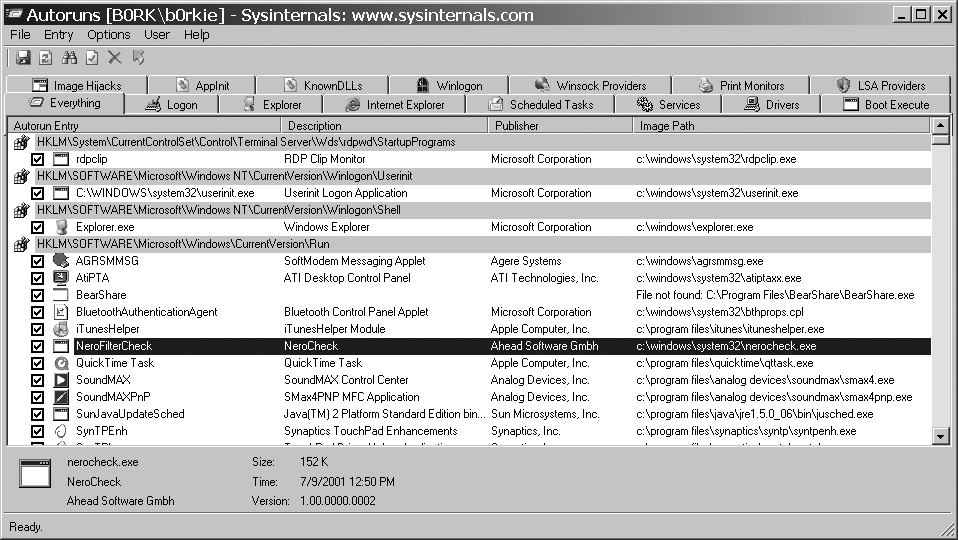
Upon startup, Autoruns presents us with a main display window, separated into 15 or so different tabs. The tab that is opened on startup, called Everything, displays a list of all of the programs configured to start automatically on your system, separated by line items with a grey background, indicating their location or type. Most of them are references to registry entries, but there are also other types, such as items from the Task Scheduler and startup folders. If you are concerned with only certain types of startup files (e.g., programs started when a user logs on), you could select the appropriate tag (e.g., Logon), and the list in the display window is trimmed down to contain only those entries. If you highlight a certain entry, details about it (e.g., description, source, location) are displayed at the bottom of the window. Also note the most important of these are displayed along with the name in the window that lists all of the Autorun entries.
By now you have noticed that there are several entries that start up, and that most of them are probably legitimate. Most autorun executables, if created by a trustworthy source, have their publisher listed in the file's header. Some files even have a certificate that allows you to check their authenticity against a database stored by a trusted certificate authority (CA). This is not always the case, even for larger software developers, but you can check easily by right-clicking on the entry and selecting Verify from the pop-up menu. If the file's certificate checks out with the CA, then a tag indicating (Verified) appears before the publisher's name. If the check fails, the publisher's name is prefixed with a (Not verified) tag.
Tip
You can verify all entries at once by selecting Options → Verify Code Signatures from the top menu. After you Refresh (F5), each entry should have the appropriate prefix before its Publisher tag. Do not be surprised if most show up as Not Verified.
Another way to find out whether an entry is commonplace is to look it up in a search engine. Autoruns has a quick shortcut that uses your default web browser to look up the autorun's name in one of two search engines. First, configure Autoruns to use Google by heading to the top menu and selecting Options → Search Engine → Google; if you would prefer MSN Search, select that here instead. To use the search feature, right-click on an entry and select either Google or MSN Search. This often reveals a page from one of the many sites on the Internet that catalog the names of common autorun files.
Tip
Features such as Verify and Google require that the system you are auditing have Internet access to work properly. If it does not, you may have to verify using other means; there is no substitute for experience and common sense here.
Entries with a publisher of Microsoft Corporation are, if they verify properly, legitimate or uninteresting autoruns. To narrow down our search for malware, it is best to hide these from view. Do this by heading back to the top menu bar and selecting Options → Hide Signed Microsoft Entries. After you Refresh (F5), the number of entries is diminished significantly. The remaining entries are usually from third-party device drivers and helpers for other software you have installed, as in Figure 21-2.

If you see anything here that does not look like something you might have installed, it warrants further investigation. Figure 21-2 highlights a not-so-stealthily installed BO2k server. Right-clicking brings up a menu with the following items:
- Delete
Deletes the autorun entry. If this is in the registry, it deletes only the registry entry. If somewhere else, such as the Startup folder, it may delete the file completely.
Tip
Unchecking the box on the far left of an autorun entry causes it to be disabled on startup, but not deleted. This is great for testing whether or not the item you are removing affects anything that you use regularly before deleting it permanently.
- Copy
Copies the text of the entry to the clipboard. This may be useful when writing reports.
- Verify
Verifies the signature of the executable against a trusted Certificate Authority. It was explained earlier in this section.
- Jump to...
Opens and locates the file in Windows Explorer or Regedit, depending on whether the entry in question is a file or a registry entry.
- Google... or MSN Search...
Opens the default web browser and performs a search for the entry name using the chosen search engine.
- Process Explorer...
Opens the Process Explorer Properties window if Process Explorer (http://www.sysinternals.com/utilities/processexplorer.html) is in the system's
PATHvariable or already running.- Properties...
Acts as a shortcut to viewing an executable's properties using Windows Explorer.
Tip
On a system with multiple users, the autoruns may differ from user to user. To choose which user to emulate, from the top menu bar, select the User option, followed by the user you wish to use.
In the last few years, rootkit technology for Windows has seen several advancements. Dozens of advanced rootkits are now easily available and web sites such as http://www.rootkit.com/ offer a place for rootkit developers and users to interact and exchange information. This book contains a whole section dedicated to using rootkits (see Chapter 12), but trying to find one after the fact is another ballgame. RootkitRevealer from Sysinternals uses a number of techniques to detect files, processes, and registry keys that are actively being hidden by a rootkit running on the system. By accessing a file using different methods, RootkitRevealer looks for discrepancies between them that act as telltale signs of the presence of a rootkit. Often, rootkits use these methods to conceal their own presence on the filesystem and registry, so these files turn up during a scan.
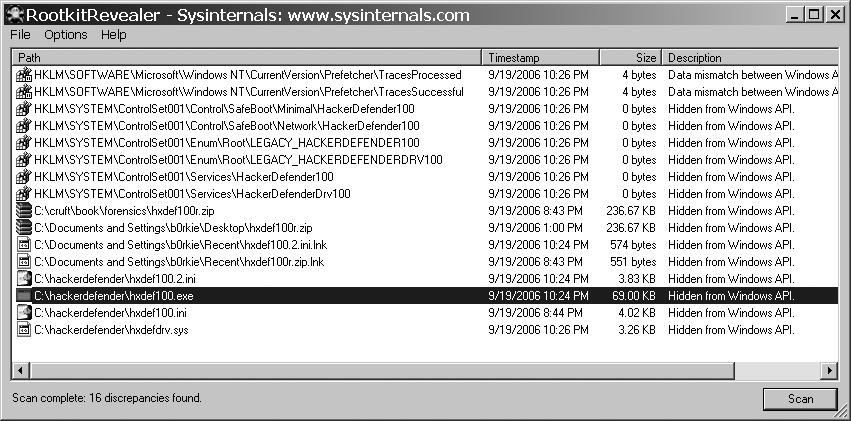
This utility and its official documentation can be found at http://www.sysinternals.com/utilities/rootkitrevealer.html. If run without any arguments, RootkitRevealer defaults to its graphical interface, shown in Figure 21-3.
Before you begin a scan, make sure that both the "Hide standard NTFS files" and the "Scan Registry" options are checked in the Options menu. The first hides files specific to the NTFS filesystem that are legitimately hidden from the Windows API using methods similar to the techniques of some rootkits. The second tells RootkitRevealer to search for discrepancies in the registry as part of its scan. The benefits of seeing hidden registry entries far outweigh the performance advantages gained by not scanning the registry.
Now begin the scan by clicking the Scan button in the bottom-right corner of the window. The scan may take several minutes, and progress is indicated by a status field in the lower lefthand portion of the window. RootkitRevealer displays any discrepancies that it finds in the main window as it finds them during the scan. In Figure 21-3, an installation of Hacker Defender was uncovered. As Hacker Defender attempts to hide the files and registry keys associated with its setup, RootkitRevealer takes note and adds them to the list. Now would be a good time to consult Google about how to get rid of this rootkit. Rootkits are wily; it might not be as simple as deleting the files and registry keys.
To avoid repeating your scan across reboots, save off the output of this scan to a text file by selecting File → Save....
Tip
Since the hacker is using a rootkit to disguise files, sometimes RootkitRevealer detects hidden files that the intruder used that you never would have suspected otherwise. They are detected simply because of attempts to hide them.
If you are working remotely, it might be easier to run RootkitRevealer from the command-line. Though the command can be run from the console in such a way that no further interaction is required, it is worth noting that the graphical interface and status of the scan is still visible on the desktop. If you were hoping to keep a low profile on the desktop of a system that may have been compromised, this might not be the best method to use.
To tell RootkitRevealer to scan automatically, and then save the results of the scan off to a file named rootkits.log, run it with the following syntax:
C:\sysinternals> rootkitrevealer -a rootkits.logIf you are automating the process among several machines and need to incorporate the output into some sort of script or database, you can tell it to save the output in CSV format instead of the typical readable text by supplying the -c flag along with the preceding syntax.
Streams: Find and Delete Data Hidden in Streams the Sysinternals Way
Sysinternals also provides the streams.exe command-line utility to detect data stashed in alternate data streams. Personally, I find the Forensic Toolkit's Sfind to be more reliable (see the earlier section "Sfind.exe: Discover Files Hidden in Alternate Data Streams"), but streams.exe has one really cool feature that I like: a flag that allows you to tell it to delete the alternate streams as it finds them. It is also quite nice in that it is much faster than Sfind when scanning large amounts of files. The downside is that it is a bit buggy. For example, in some cases, it does not detect alternate streams in the specified directory without the Recurse Subdirectories flag set. I have also found that it throws out several noisy errors when it cannot inspect a file due to that file being used by another process. Because of all this, I tend to use Streams only when I want to search an entire disk quickly and delete all of the streams on the fly, as follows:
C:\sysinternals>streams -s -d c:\

Streams v1.53 - Enumerate alternate NTFS data streams
Copyright (C) 1999-2005 Mark Russinovich
Sysinternals - www.sysinternals.com

...

c:\WINDOWS\system32\calc.exe:
   Deleted :boserver.exe:$DATA
   Deleted :scanner.exe:$DATA
...
The output is truncated, so this does not show that running this command deletes all those harmless Zone.Identifier and .encryptable streams. However, this has not caused me any problems so far. Use discretion when running this if there are potentially useful alternate data streams on the system that you may want to keep. For a usage summary, run streams.exe without any arguments.
TCPView does more than simply view TCP connections as the name implies. It is more like a graphical version of Netstat (see Netstat) that takes only the information we care about, presents it in a useable format that is updated in near real-time, and then allows us to perform a few extra operations on each connection (e.g., ending the associated process). Sound cool? It is.
Like the rest of the Sysinternals utilities, you can download TCPView from its web site at http://www.sysinternals.com/utilities/tcpview.html. The TCPView package also includes a utility called tcpvcon.exe, which functions as a console version of TCPView. It is neat, but does not offer the same big picture overview that TCPView and Netstat present.
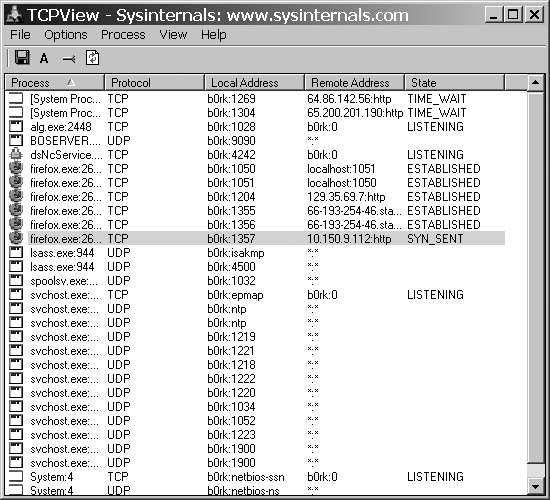
Running TCPView.exe provides a list that contains almost the same information as our Linux Netstat. It is so similar that you can safely consult that section if you need an explanation of each field displayed. The only thing presented differently is that the process name and ID are now located on the left side of the window, separated by a colon (:) instead of a forward-slash (/), as shown in Figure 21-4.
One of the first things you will probably notice about the interface is that certain sockets may be highlighted for a moment or two as green, yellow, or red. This happens because when the list is refreshed, new endpoints are highlighted in green, updated endpoints are highlighted in yellow, and closed endpoints are highlighted in red until the next update. You can set the speed at which the list refreshes from View → Update Speed. Also there is an option to pause everything, should you wish to examine something without running the risk of losing the information if the endpoint disappears.
For your purposes, it is always a good idea to make sure that all listeners are shown. You can do this by ensuring that Options → Show Unconnected Endpoints is checked. Without this, something like the backdoor that you are looking for could easily go undetected.
The process name of the endpoint is already shown on the left, so in contrast to what I do with Netstat, I tend to focus on the process information rather than the port, but it is nice to be able to so easily correlate the two. To get more information about a process, such as the arguments it was called with or its full path on disk, double-click on its line to bring up a small dialog like that shown in Figure 21-5.
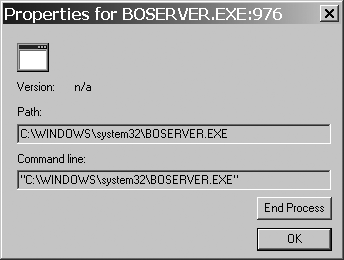
If you decide that the process needs to be immediately killed, you can do so now by clicking the End Process button. Click the OK button to close this window.
After this you are left with only a few more options to explore. Bring up the endpoint-specific menu by right-clicking on its line. You are presented with a handful of choices, some of which were already covered:
- Process Properties...
Opens the Process Properties dialog (see Figure 21-5).
- End Process...
Kills the process directly. Do this instead of killing the process through the Properties dialog if you already know you want to terminate it.
- Close Connection
Kill only the connection. Choose this if the process appears legitimate, but the connection itself is questionable, and you want to investigate the process.
- Whois...
Performs a Whois query to get more information about the remote host, if there is one.
- Copy
Copies the basic information about the connection to the clipboard; possibly useful if you are trying to write a report.
Several tools listed in this chapter do a fine job of revealing to us a process that is up to no good, but when I bring up the Windows Task Manager, I find myself wanting to get an idea of what the process is up to. The Process Explorer from Sysinternals offers a powerful replacement for the Task Manager. It allows us to see detailed information about a process; anything from complex performance statistics to which registry keys the process currently has open. Keep in mind, however, that with this tool, you are treading the thin line between forensics and live malware analysis. Process Explorer does a great job of showing me that there are several things I have yet to learn about Windows' internals.
You can download Process Explorer from the Sysinternals web site at http://www.sysinternals.com/Utilities/ProcessExplorer.html. Unzip the archive and extract the files to a convenient location. I like to keep all of the simpler Sysinternals tools in C:\sysinternals. Run procexp.exe to get started.
Tip
Also remember that many of the other Sysinternals tools allow you to open Process Explorer indirectly to explore a related process. For example, Autoruns allows you to explore autorun entries in the Process Explorer by selecting it in the right-click menu.
Upon startup, Process Explorer displays an interface with the two large panes shown in Figure 21-6.

The top pane is the actual process list. Like the endpoint list in TCPView, it is refreshed at a timed interval (anywhere between a half-second and 10 seconds). This can also be paused to explore an active process without fear of being interrupted.
Tip
For simple tasks and monitoring, you may be interested in this upper pane only. You can disable the lower pane by hitting Ctrl-L, unchecking View → Show Lower Pane, or clicking the Hide Lower Pane icon just above the upper pane.
A process may have its line background highlighted to demonstrate activity or process type. Following a refresh, a bright green background indicates a new process, while a bright red background indicates a process that was just terminated. Processes with a light pink background are run as services, and light blue indicates that the process is being run by a user. You can actually interact with the user in question, should you need to. Check out the options by exploring the User menu. Also note that processes in this window are shown in a sort of tree view. The tree demonstrates the calling order of processes. The highlighted process in Figure 21-6 was called by services.exe. It is not visible in the image, but it is evidenced by its light-pink background.
When you select a process in the top pane, information specific to that process is displayed in the lower pane. This pane (if not hidden) defaults to what is called the DLL view. The DLL view is a list of all the DLLs accessed by the process. By learning what libraries it has loaded, you can try to figure out what a mystery process is up to. The Handle view is even more useful because it causes the lower pane to display information about what registry keys, files, ports, and threads a process is using. Activate this lower pane view by selecting View → Lower Pane View → Handles.
As an example, by using Autoruns, I found a reference to boserver.exe in a registry key that starts it as a service. If the name of the found file did not make the identity of this mystery process obvious to me, I could have a closer look by highlighting it in the process list to bring up some information about what handles it has open in the lower pane, exactly as shown in Figure 21-6. The handles do not tell me much in this case, but I can see that it has several of the important autorun registry keys open and is performing some sort of UDP network communication because of the open file handles.
Tip
By right-clicking in the Handles pane, you can tell Process Explorer to close any specific handle that the process is trying to access. This may cause the process to behave unpredictably, but it might also help you to clear up conflicts with other processes or stop a malicious process from doing something unsavory.
Figure 21-7 shows the Process Properties dialog. Summon the dialog by double-clicking an entry in the process list (e.g., boserver.exe) or by selecting Process → Properties. It can also be accessed by right-clicking the appropriate entry in the process list.

The Properties window contains several features, and each tab is worth exploring. The few that I am concerned with when attempting to learn more about a process are the Image, TCP/IP, and Strings tabs.
- The Image tab
Provides the important basic information about a process, such as the owner, parent, full path, and command line. If it has a potentially important graphic interface that may be hidden or hard to get to, you can bring that to the front using the "Bring to Front" icon. The process can also be killed using the appropriate icon.
- The TCP/IP tab
Provides a Netstat-like list of endpoints opened by the process. It might be worth using something like Netcat to connect to these ports to see what it is doing. If you know and have access to a specialized client to interact with the process, you could use that instead.
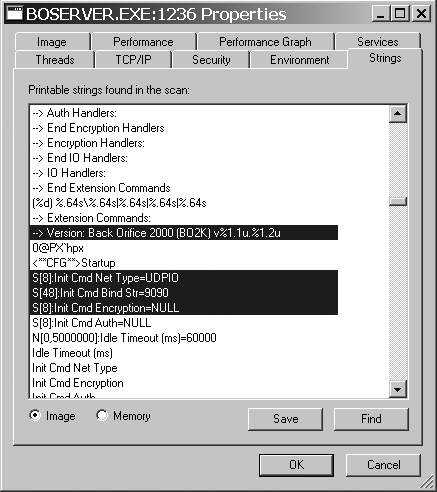
- The Strings tab
Runs a search for printable characters against both the process memory space and the binary. You can control the search by selecting the appropriate radio button at the bottom of the window.
Strings can be a very interesting method of turning up surprising information about an unknown binary, as shown in Figure 21-8. If you did not know what boserver.exe was already, the strings gleaned from the binary not only identify it as Back Orifice 2000, but they tell you what port it is configured to listen on, and what encryption and authentication modules it is using on startup. This is more than enough information to use your own BO2k client to connect to the backdoor and see your computer exactly as the hacker does.
With all the Process Explorer can do, you might as well replace the default Windows Task Manager application with it. Process Explorer gives you a quick way to do it: from the main menu, simply select Options → Replace Task Manager. Nothing else is required. Next time you escape to the Task Manager by using Ctrl-Alt-Delete, Process Explorer appears in its place.
If you were hoping to use the Task Manager to get a performance graph, Process Explorer does that too. Bring up the System Information window shown in Figure 21-9 by pressing Ctrl-I, by clicking its icon at the top of the Process Explorer window, or by selecting View → System Information.
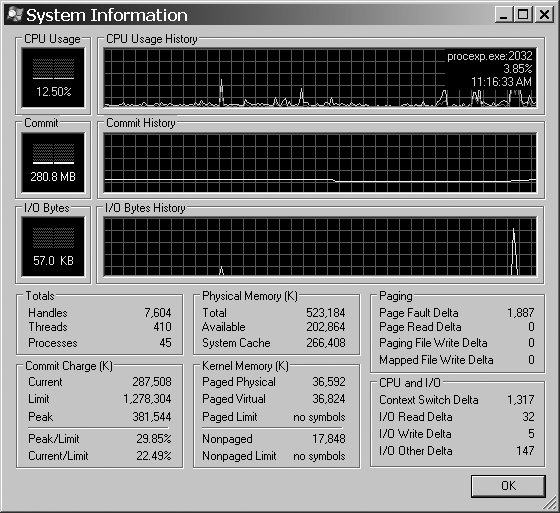
If this is not enough information, note that you can also get detailed history for each graph as a function of type by moving the cursor over the appropriate portion of the graph. A dynamic window displaying the process and usage statistics for that time should appear.
One more powerful features embedded into the Process Explorer is the ability to run any process as any user or a limited user. To use it, select File → RunAs..., or File → "Run as Limited User." You will first be prompted for the command you wish to run. If you chose "Run as Limited User," then that command is run in an extremely limited environment that prevents it from doing any permanent damage to your system. If you selected RunAs..., you will be prompted to choose a user after you select which command you wish to run.
Warning
Be very careful with this! Running an unknown process as a user with elevated privileges could allow malicious code to run amuck in your system.
This is a neat feature, but if you plan on doing any serious malware or backdoor analysis, rather than running it as a limited user in a sensitive environment consider using something like VMWare to simulate a real environment without any chance for things to backfire. The Sysinternals suite of tools is ideally suited for this purpose.
Finding the bad stuff is one thing, but what you do when you find it is highly situational and beyond the scope of this chapter. If it's a matter of dealing with some automata such as a worm or malware, many common virus and malware scanners are good at getting rid of these. If you've been able to identify it, but not get rid of it, you might also have some luck with a Google search. Chances are that lots of people out there have been infected by the same thing you have and are asking themselves the same questions.
In the case of a human intruder, the only real way to ever be sure that your system is clean is to format, reinstall, and start from scratch. Good luck!
—Chris Iezzoni