 Read the Overview to learn what the TASC Mathematics Test covers.
HOW TO USE THIS CHAPTER
 Read the Overview to learn what the TASC Mathematics Test covers.
 Take the TASC Mathematics Pretest to preview your knowledge and skills.
 Study the TASC Mathematics Test Review to refresh your knowledge of TASC test math skills.
 Take the TASC Mathematics Practice Test to sharpen your skills and get ready for test day.
Overview
On part of the TASC Mathematics Test, you are allowed to use a calculator. For the rest of that section, calculators are not allowed. The TASC Mathematics Test is the only part of the 2014 exam that will include gridded responses as well as multiple-choice answers. In other words, for some TASC test Mathematics questions, you will need to solve a problem yourself with no answer choices to guide you.
The TASC Mathematics Test is based on the Common Core State Standards for Mathematics. You can see these standards at www.corestandards.org/Math. The TASC test does not test the most advanced of those standards, which are the ones marked with plus signs. The main standards covered by the TASC test include the following:
Number and Quantity
1. CCSS.Math.Content.HSN-RN.A.1–2, B.3 The Real Number System
2. CCSS.Math.Content.HSN-Q.A.1–3 Quantities
3. CCSS.Math.Content.HSN-CN.A.1–2, C.7 The Complex Number System
4. CCSS.Math.Content.HSA-SSE.A.2 Seeing Structure in Expressions
5. CCSS.Math.Content.HSA-APR.A.1, B.2–3, C.4, D.6 Arithmetic with Polynomials and Rational Expressions
6. CCSS.Math.Content.HSA-CED.A.1–4 Creating Equations
7. CCSS.Math.Content.HSA-REI.A.1–2, B.3–4, C.5–7, D.10–12 Reasoning with Equations and Inequalities
Functions
8. CCSS.Math.Content.HSF-IF.A.1–3, B.4–6, C.7–9 Interpreting Functions
9. CCSS.Math.Content.HSF-BF.A.1–2, B.3–4 Building Functions
10. CCSS.Math.Content.HSF-LE.A.1–4, B.5 Linear, Quadratic, and Exponential Models
11. CCSS.Math.Content.HSF-TF.A.1–2, B.5, C.8 Trigonometric Functions
Geometry
12. CCSS.Math.Content.HSG-CO.A.1–5, B.6–8, C.9–11, D.12–13 Congruence
13. CCSS.Math.Content.HSG-SRT.A.1–3, B.4–5, C.6–8 Similarity, Right Triangles, and Trigonometry
14. CCSS.Math.Content.HSG-C.A.1–3, B.5 Circles
15. CCSS.Math.Content.HSG-GPE.A.1–2, B.4–7 Expressing Geometric Properties with Equations
16. CCSS.Math.Content.HSG-GMD.A.1, 3, B.4 Geometric Measurement and Dimension
17. CCSS.Math.Content.HSG-MG.A.1–3 Modeling with Geometry
Statistics and Probability
18. CCSS.Math.Content.HSS-ID.A.1–4, B.5–6, C.7–9 Interpreting Categorical and Quantitative Data
19. CCSS.Math.Content.HSS-IC.A.1–2, B.3–6 Making Inferences and Justifying Conclusions
20. CCSS.Math.Content.HSS-CP.A.1–5, B.6–7 Conditional Probability and the Rules of Probability
The Common Core State Standards also feature Standards for Mathematical Practice, which are not tested directly on the TASC test but are featured throughout as a starting point and foundation for the types of questions asked. Those standards are the following:
1. Make sense of problems and persevere in solving them.
2. Reason abstractly and quantitatively.
3. Construct viable arguments and critique the reasoning of others.
4. Model with mathematics.
5. Use appropriate tools strategically.
6. Attend to precision.
7. Look for and make use of structure.
8. Look for and express regularity in repeated reasoning.
Use the items that follow to preview your knowledge of high school mathematics. Answers appear on page 146.

1. A standard deck of 52 cards holds 4 cards each of twos through aces in four equal-sized suits—hearts, diamonds, clubs, and spades. If you choose a card at random, what is the probability of choosing an ace or a heart?


2. Which is a simplified version of ((2–4)(3–3))–2?
A. (2–8)(3–6)
B. (22)(3)
C. (2–6)(3–5)
D. (28)(36)
3. Zolar Moving Company drove a truck from Dryden, New York, to Morgantown, West Virginia, at an average rate of 55 miles per hour. If the trip is 396 miles, how long was the truck on the road?
A. 6 hours 3 minutes
B. 6 hours 20 minutes
C. 7 hours 12 minutes
D. 7 hours 20 minutes
4. Solve for x: log2. 64 = x.
A. 3
B. 4
C. 5
D. 6
5. Density  Gold has a density of 19.3 grams per cubic centimeter. What is the mass in kilograms of a bar of gold that measures 10 centimeters by 4 centimeters by 5 centimeters?
A. 3.67 kg
B. 3.86 kg
C. 10.36 kg
D. 386 kg
6. If isosceles triangle ABC is similar to isosceles triangle DEF, what must the value of x be?
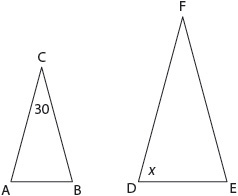
Mark your answer in the grid on your answer sheet.
7. Julius measured the heights of a random sample of boys in his high school senior class. Here are his results.

Which is the most reasonable estimate of the average height of all boys in Julius’s high school senior class?
A. 5.3 feet
B. 5.5 feet
C. 5.7 feet
D. 5.9 feet
8. A team of engineers is drilling a tunnel through a mountain, as shown.
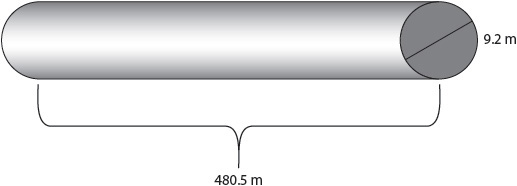
To the nearest cubic meter, how much dirt and rock must be cleared away in order to create the tunnel? Use 3.14 as pi.
A. 4,421 m3
B. 13,881 m3
C. 31,926 m3
D. 127,702 m3
9. What is the greatest whole number that when added to this data set would result in a data set that skews left?

Mark your answer in the grid on your answer sheet.
10. In 1871, most of Chicago was destroyed by fire. This graph shows the population from 1880 until 1910.
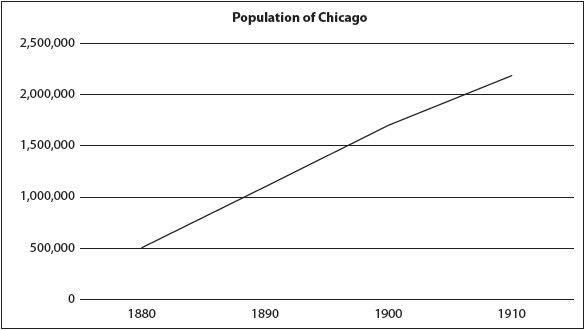
Which is the best estimate of the rate of change in population?
A. 25,000/year
B. 50,000/year
C. 100,000/year
D. 400,000/year
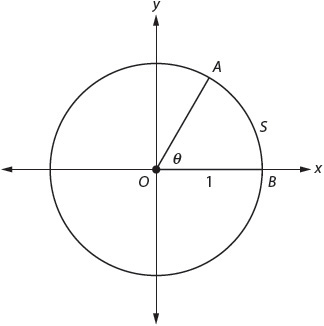
11. The diagram shows a unit circle, a circle with a radius of 1.
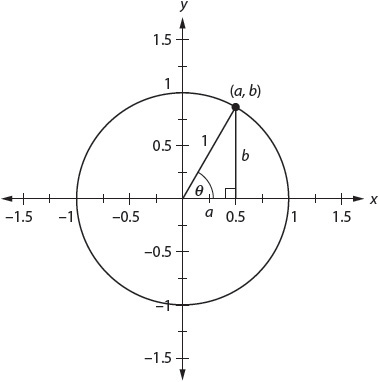
If the cosine of θ in this unit circle is a, what would be true of the cosine of θ in a circle with a radius of 2?
A. The cosine would be  .
.
B. The cosine would be 2a.
C. The cosine would be b.
D. The cosine would be a.
12. What is the solution to the equation 4(x + 12) = –3x + 6?
A. –6
B. 6
C. –7.7

13. The cost of a software package, S, is $290 less than the cost of a laptop, L. The total price for both laptop and software is $500. Which system of equations could you use to find the price of each item?
A. L = S – 500
L – S = 290
B. L = S – 290
L + S = 500
C. L = S + 290
S = L – 290
D. S = L – 290
S + L = 500
14. Find the value of f(–4) for the function f(x) =  x + 5.
A. 3
B. 4
C. 5
D. 7
15. This scatter plot shows the time between eruptions and the duration of each eruption for Yellowstone Park’s Old Faithful Geyser.

Based on the scatter plot, which types of eruptions are most common?
A. short wait, long duration eruptions and long wait, long duration eruptions
B. short wait, short duration eruptions and long wait, long duration eruptions
C. short wait, short duration eruptions and long wait, short duration eruptions
D. short wait, long duration eruptions and long wait, short duration eruptions
16. Which statement is not true?
A. The product of two irrational numbers is always rational.
B. The sum of a rational and an irrational number is always irrational.
C. The product of two rational numbers is always rational.
D. The product of a rational number (other than zero) and an irrational number is always irrational.
17. Which expression is equivalent to 
A. 2(xy)


18. The function f(x) is shown on the graph. Find f(–3).
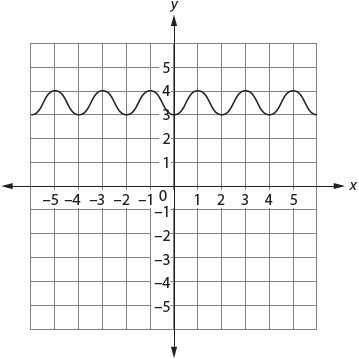
Mark your answer in the grid on your answer sheet.
19. What is the sum of these polynomials?
(3x2y + 6x – 5) + (2x2y + 4x2 – 6x)
A. 9x2y – 5
B. 5x2y + 4x2 – 5
C. 5x2y + 10x2 – 6x –5
D. 6x2y + 4x2 – 36x – 5
20. Point O is the center of this circle. What is the measure of ∠A?

Mark your answer in the grid on your answer sheet.
 This is the end of the TASC Mathematics Pretest.
1. B Review 20. Conditional Probability and the Rules of Probability (pp. 207–210).
2. D Review 1. The Real Number System (pp. 147–149).
3. C Review 6. Creating Equations (pp. 160–163).
4. D Review 10. Linear, Quadratic, and Exponential Models (pp. 175–177).
5. B Review 17. Modeling with Geometry (pp. 199–200).
6. 75 Review 13. Similarity, Right Triangles, and Trigonometry (pp. 186–188).
7. C Review 19. Making Inferences and Justifying Conclusions (pp. 205–207).
8. C Review 16. Geometric Measurement and Dimension (pp. 196–198).
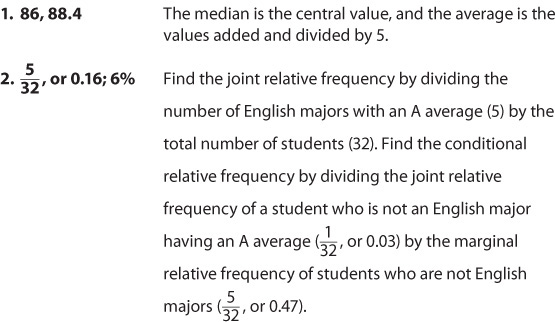
9. 6 Review 18. Interpreting Categorical and Quantitative Data (pp. 200–205).
10. B Review 8. Interpreting Functions (pp. 169–172).
11. D Review 11. Trigonometric Functions (pp. 178–180).
12. A Review 7. Reasoning with Equations and Inequalities (pp. 164–169).
13. D Review 6. Creating Equations (pp. 160–163).
14. A Review 8. Interpreting Functions (pp. 169–172).
15. B Review 18. Interpreting Categorical and Quantitative Data (pp. 200–205).
16. A Review 1. The Real Number System (pp. 147–149).
17. D Review 4. Seeing Structure in Expressions (pp. 154–157).
18. 4 Review 8. Interpreting Functions (pp. 169–172).
19. B Review 5. Arithmetic with Polynomials and Rational Expressions (pp. 157–160).
20. 85 Review 14. Circles (pp. 189–192).
The pages that follow briefly review each of the twenty standards listed in the Overview. To learn more about number and quantity, algebra, functions, geometry, and statistics and probability, find books on those topics in the library or look for instructional webinars online. An excellent, free source for math review of concepts and skills is available at www.khanacademy.org.
 The Real Number System
The real numbers are all those numbers that can be thought of as points along a number line. There is an infinite number of real numbers.
KEY TERMS: exponent, integer, irrational, radical, rational, root
Integers
The set of integers consists of the whole numbers (1, 2, 3 …), the negative whole numbers (–1, –2, –3 …), and zero.
Rational Numbers
A rational number may be expressed as a/b, where both a and b are integers, and b ≠ 0. The sum or product of two rational numbers is always rational.
Irrational Numbers
An irrational number is a real number that cannot be expressed as a/b, where both a and b are integers, and b ≠ 0. A repeating decimal is rational, but a decimal that does not repeat is irrational. Examples of such numbers include π and  .
.
The sum of a rational number and an irrational number is irrational. The product of a rational number other than zero and an irrational number is also irrational.
Integer Exponents
For any number a where n is a positive integer, a with an exponent of n, or an, is equal to

For example, 54 = 5 × 5 × 5 × 5 = 625
(–2)3 = –2 × –2 × –2 = –8
For any number a where n is zero, an is equal to 1.
For example, 50 = 1
(–2)0 = 1
For any number a where n is a positive integer, 

Roots and Radicals
The radical sign (√) is used to indicate square roots or nth roots. A square root is a number that when multiplied by itself results in a real, non-negative number, a square.
For example,  because 3 × 3 = 9
You may indicate other kinds of roots other than square roots by placing a number in the radical sign.
For example,  means the number that when multiplied by itself 4 times equals b.
 because 5 × 5 × 5 = 125
Fractional Exponents
Exponents may be integers, or they may be other rational numbers, including fractions. Fractional exponents equate to roots.
For example, 42 = 16
41 = 4
40 = 1


There are a few useful tricks to understand when it comes to dealing with exponents. Some were shown previously. Here are some others.
Laws of Exponents

CHALLENGE The Real Number System
CHALLENGE ANSWERS
The Real Number System
1. 7 7×7×7 = 343.
2. 151 Solve each one, and then add them together.
3. 
4. 2  is the same as the cube root of 8, which is 2.
5.  Cube the numerator. Then cube the denominator.
 Quantities
The skills that the Common Core State Standards call “quantities” are modeling skills. At the high school level, they involve using units to guide the solution of problems. You need to choose units correctly in formulas and data displays, and you should understand levels of accuracy.
KEY TERMS: accuracy, convert, precision, unit
Accuracy and Precision
The accuracy of a measurement is the degree of closeness of that measurement to a quantity’s actual value. The precision of a measurement is the degree to which repeated measurement yields the same results. Here is a common example that shows the difference. Imagine that you are aiming at a bull’s eye. If your aim is accurate, you get within the same measurement of the center each time. If your aim is precise, your shots are grouped close together, no matter how many times you shoot.
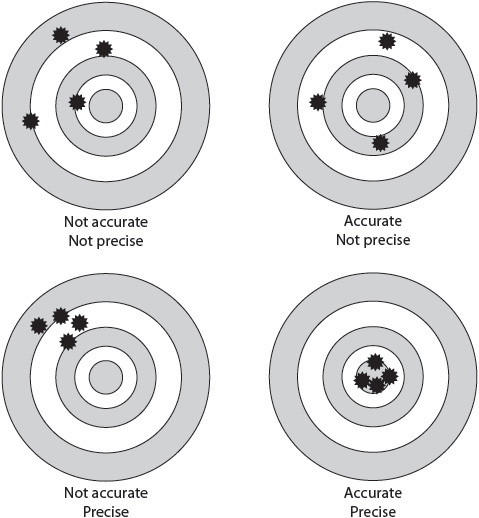
If you are weighing a bag of potatoes that is known to weigh 5 pounds, and your scale reads 3 pounds, the scale will not give you an accurate measurement. You may get a weight of 3 pounds every time you try. That means that your measurement is precise, but it is still not accurate. Your scale may need adjusting.
Unit Conversion
A variety of units are used to measure objects and substances. To measure length or distance, you may use meters, inches, miles, and so on. To measure temperature, you may use degrees Celsius or degrees Fahrenheit. To measure capacity, you may use cups, milliliters, gallons, and so on.
As you respond to word problems, make sure that you understand what units are being used. At times, problems may require you to make a conversion from one unit to another.
Jack drank a pint of milk at lunch and another pint at dinner. How many quarts of milk did Jack drink?
The square fence measures 6 yards on each side. How many feet of fencing is required?
In the first example, you need to convert pints to quarts—a smaller unit to a larger unit. If you know that 2 pints = 1 quart, this should be easy. In the second example, you must convert yards to feet—a larger unit to a smaller unit. By multiplying the number of yards (24) by 3 feet to the yard, you find that the number of feet of fencing will be 24 × 3, or 72 feet.
To convert from a smaller unit to a larger unit, divide. To convert from a larger unit to a smaller unit, multiply.
CHALLENGE Quantities
1. centimeters, neither precise nor accurate The important unit is centimeters. Pete’s measurements are neither highly accurate nor highly precise, because the rats are probably moving as he views them, and he measures each one only once. The range of his observations is well above and below the average rat size, making lack of accuracy a problem.
2. feet, both precise and accurate The important unit is feet, because Kyra must compare her measurement to the rule regarding 5 feet. Kyra’s measurements are probably both precise and accurate—she measures five times and gets the same measurement each time, and she compares the results from her measurement tool to one that she knows is accurate.
 The Complex Number System
Beyond the real numbers lie the imaginary numbers, numbers such as the square root of –4. Since there is no real number that when multiplied by itself equals a negative number, the square root of –4 is not a real number, but it may exist as a concept. Mathematicians use imaginary numbers to create a whole new system of numbers, the complex number system. This allows certain problems that have no real solutions to have solutions, which sometimes comes in handy in engineering, economics, and the sciences.
KEY TERMS: complex, imaginary
Imaginary Numbers
The imaginary unit is represented by i in this equation: i2 = –1. An imaginary number is any number that can be written as a real number times the imaginary unit.
For example, 8i is an imaginary number whose square is –64.
10i is an imaginary number whose square is –100.
A complex number is a number that can be expressed in the form a + bi, where i is the imaginary unit. In this form, a is the real part of the complex number, and bi is the imaginary part of the complex number. The number may even be graphed on a coordinate plane where the x-axis represents real numbers and the y-axis represents imaginary numbers.

Computing with Complex Numbers
Complex numbers follow the same rules as real numbers when you add, subtract, and multiply them. You cannot add a real number to an imaginary number, so you handle the two parts of a complex number as though they were entirely separate.
Add complex numbers 2 + 3i and 4 + 5i.
2 + 3i + 4 + 5i =
(2 + 4) + (3i + 5i) =
6 + 8i
Subtract complex number 2 + 3i from 4 + 5i.
(4 + 5i) – (2 + 3i) =
(4 – 2) + (5i – 3i) =
2 + 2i
Multiply complex number 2 + 3i by 4 + 5i.
(2 + 3i)(4 + 5i)
= 2(4 + 5i) + 3i (4 + 5i) using the distributive property …
= 8 + 10i + 12i + 15(i2)
= 8 + 22i + 15(–1) because i2 is equal to –1 …
= –7 + 22i
CHALLENGE The Complex Number System
CHALLENGE ANSWERS
The Complex Number System
1. –36 |
The square of any number ni is –(n2). Since, i2 = –1, and 62 = 36, (36)(–1) = –36. |
2. 7 + 4i |
Add the real parts first and the imaginary parts second. |
3. 1 + 11i |
8i is the complex number 0 + 8i. |
4. –10 |
5 × 2 = 10, and i2 = –1. |
5. 13i |
Use the distributive property to get 3(2 + 3i) + 2i(2 + 3i) = (6 + 9i) + (4i + 6i2) = (6 – 6) + 13i = 13i. |
 Seeing Structure in Expressions
An algebraic expression may contain several parts, each with its own role in the expression.
KEY TERMS: coefficient, expression, factor, quadratic, simplify, terms, trinomial, variable
Variables, Terms, and Expressions
In algebra, letters called variables are used to represent numbers or unknown quantities. An algebraic expression is a group of numbers, variables, grouping symbols such as parentheses, and operation symbols. When an algebraic expression has several parts, the parts that are added or subtracted are called the terms of the expression.
For example, x2 + 6 is an expression containing terms x2 and 6.
2(y + 3) – 4 is an expression containing terms 2(y + 3) and –4.
5 – x + 3x is an expression containing terms 5, –x, and 3x.
The numerical part of a term is the term’s coefficient.
For example, in 7x, the coefficient is 7.
In 4(x + 2), the coefficient is 4.
In 
In –6x, the coefficient is -6.
Like and Unlike Terms
Like terms have the same variables with the same exponents.
For example, 6x and 17x are like terms.
2x2 and x2 are like terms.
5(x + 2) and 3(x – 1) are like terms.
But 6x and x2 are unlike terms, because their exponents are different.
17 and 2x are unlike terms, because their variables are different.
5x and 3y are unlike terms, because their variables are different.
Simplifying an Expression
The distributive property allows you to remove parentheses from an expression in order to simplify or solve it.
For example, 2(x + 4) = 2x + 2(4) = 2x + 8
3(x – 2) = 3x + 3(–2) = 3x – 6
(x + 2)(x – 1) = x2 – 1x + 2x – 2 = x2 + x – 2
When you simplify an expression, you remove parentheses and combine like terms. You may have learned this as the FOIL method:
 First: Multiply the first term in each set of parentheses.
 Outer: Multiply the outer term in each set of parentheses.
 Inner: Multiply the inner term in each set of parentheses.
 Last: Multiply the last term in each set of parentheses.
Solving Quadratic Equations
A quadratic expression is in the form ax2 + bx + c, where a, b, and c are real numbers, and a ≠ 0. Such expressions may also be called trinomials, because they contain three distinct terms. Quadratic equations may be solved in several possible ways.
1. Start with a quadratic equation; for example, x2 + 4x – 5 = 0.
2. To factor the expression, try to think of two numbers whose sum is b (4) and whose product is c (–5).
3. Find the two distinct factors of the expression: (x + 5)(x – 1).
4. Find the x values that make the expression equal to zero: (–5 + 5) or (1 – 1).
5. The solutions are –5 and 1.
6. Plug the solutions into the expression to check: (–5)2 + 4(–5) – 5 = 0; 12 + 4(1) – 5 = 0.
Completing the Square
1. Start with a quadratic equation; for example, x2 + 6x + 5 = 0.
2. Move the third term to get the squared and x terms on the left side of the equation. In this case, you subtract 5 from both sides: x2 + 6x = –5.
3. Determine  the coefficient of the x term:
  Square this. 32 = 9.
4. Add the square to both sides of the equation: x2 + 6x + 9 = 4.
5. You now have a perfect square trinomial on the left side of the equation. Express this as its factors: (x + 3)(x + 3).
6. Now take the square root of both sides of the equation: x + 3 = ±2.
7. Solve for x: x = 2 – 3 = –1; x = –2 – 3 = –5.
8. Plug the solutions into the expression to check: (–1)2 + 6(–1) + 5 = 0; (–5)2 + 6 (–5) + 5 = 0.
Using the Quadratic Formula
1. Start with a quadratic equation; for example, x2 + 2x – 8 = 0.
2. Substitute the values into the quadratic formula:

3. 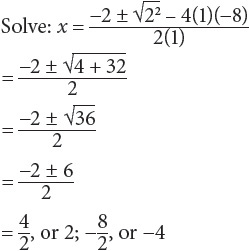
4. Plug the solutions into the expression to check: 22 + 2(2) – 8 = 0; (–4)2 + 2(–4) – 8 = 0.
CHALLENGE Seeing Structure in Expressions
CHALLENGE ANSWERS
Seeing Structure in Expressions
1. 15 Subtract x from both sides of the equation to solve.
2. 1 Add x to both sides to get 3x = 3.
3. –3, 1 Factor: (x + 3)(x – 1). Find the x that makes each factor equal to 0.
4. –9, –4 Factor: (x + 9)(x + 4).
5. 3, 5
 Arithmetic with Polynomials and Rational Expressions
Arithmetic with expressions is similar to arithmetic with integers. The systems are closed under the operations of addition, subtraction, and multiplication. In other words, just as an integer plus an integer results in an integer, so a polynomial plus a polynomial results in a polynomial.
KEY TERMS: identity, polynomial, rational expression
Polynomials
A polynomial is an expression that contains variables, constants, and non-negative, whole number exponents.
For example, 2x is a polynomial, but  is not.
x2 + 2x – 1 is a polynomial, but 3x2 – x–1 + 4 is not.
Polynomials are written in descending powers of the variable, so that x3 would precede x2, which would precede x, which would precede any integer.
For example, 2x2 + 15x – 3 is in correct form.
15x + 2x2 – 3 is not in correct form.
Adding Polynomials
To add polynomials, add the like terms of those polynomials.
(4x2 + 6x + 3) + (2x2 + 5x – 1)
= 4x2 + 2x2 + 6x + 5x + 3 – 1
= 6x2 + 11x + 2
Subtracting Polynomials
To subtract polynomials, begin by removing the parentheses. Notice that this changes the sign of each term within the parentheses for the polynomial being subtracted.
(5x2 – 4x + 5) – (x2 – 3x + 2)
= 5x2 – 4x + 5 – x2 + 3x – 2
= 5x2 – x2 – 4x + 3x + 5 – 2
= 4x2 – x + 3
Multiplying Polynomials
When you multiply terms with exponents, add the exponents.
For example, (x4)(x3) = x7
Just as you do when you multiply integers, when you multiply polynomials, be sure to multiply every term in the first polynomial by every term in the second polynomial. It may help to stack the polynomials so you can be sure to do so.
(x2 + 3x + 2)(2x2 – 3)
Stack the polynomials:

A polynomial expression that is true for all values of x is a polynomial identity. Here are a few useful identities to learn.
(a + b)2 = a2 + 2ab + b2
(a + b)(c + d) = ac + ad + bc + bd
a2 – b2 = (a + b)(a – b)
x2 + (a + b)x + ab = (x + a)(x + b)
The Remainder Theorem
When you divide a polynomial f(x) by (x – c), the remainder r will be f(c).
For example, 2x2 – 3x – 2 divided by x – 3
Calculate f(3) using the 3 in (x – 3) in place of x in the polynomial.
2(3)2 – 3(3) – 2 = 2(9) – 9 – 2 = 7
The remainder in the division will be 7.
Try another: x2 – 3x – 4 divided by x – 4
(4)2 – 3(4) – 4 = 16 – 12 – 4 = 0
Here, the remainder is 0, so (x – 4) is a factor of x2 – 3x – 4.
Rational Expressions
A rational expression is an algebraic expression in the form a/b where a and b are polynomials and b ≠ 0. As with any fraction, a rational expression is reduced to lowest terms when the numerator and denominator have no common factors other than 1.
For example,  may be reduced by factoring out
Try another: 
CHALLENGE Arithmetic with Polynomials and Rational Expressions
CHALLENGE ANSWERS
Arithmetic with Polynomials and Rational Expressions
1. 2x2 + 9x – 4 Remember to add only the like terms.
2. 4x2 – 5x Subtract like terms: 6x2 – 2x2 = 4x2. 3x – 8x = –5x.
3. x4 – 36 Multiplying every term in the first polynomial by every term in the second results in x4 + 6x2 – 6x2 – 36.
4. x – 1 Factor the numerator: (x + 3)(x – 1). Then divide out the common factor, x – 1.
 Creating Equations
You may use algebra to solve problems by creating and solving equations and inequalities.
KEY TERMS: formula, inequality, linear, viable
Equations in One Variable
You can translate verbal statements into algebraic expressions.
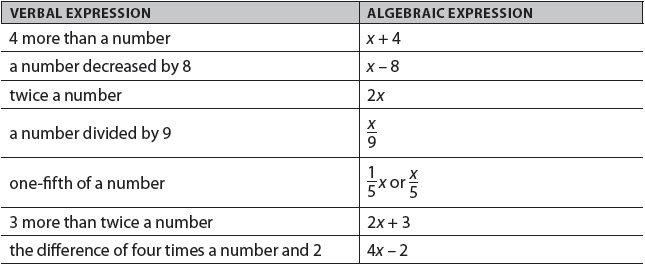
Moving beyond this, you can also use algebraic expressions to set up and solve verbal problems.
For example, John is 7 years younger than Mollie. If Mollie is 25, how old is John?
Let x = John’s age.
25 – 7 = x
x = 18
John is 18 years old.
Inequalities in One Variable
The symbols < and > are used to show that one number or quantity is less than or greater than another. The symbol ≥ means “less than or equal to.” The symbol ≤ means “greater than or equal to.”
Creating and solving inequalities of this kind is similar to creating and solving equations.
For example, John has a collection of 198 coins. Mollie’s collection is smaller than John’s.
Let x = Mollie’s collection.
x < 198
That is all we know. Mollie’s collection may contain anywhere from 0 to 197 coins. The solution to an inequality is often a set of numbers. In this case, you know that Mollie’s collection is not a negative number, because she cannot have a negative amount of coins. Replacing x with a negative number would not be viable in this case—it would not represent a practical answer.
Equations in Two Variables
Equations with more than one variable provide a means of comparing numbers or showing a relationship between two or more numbers.
For example, John has nickels and dimes in his collection totaling $2.00. If he has 25 nickels and dimes, how many of each does he have?
Use d to mean “dime” and n to mean “nickel.” Then set up two equations.

Now multiply the terms in the first equation by any amount that allows you to cancel out one variable:

So n = 10. John has 10 nickels and (25 – n) = 15 dimes.
Graphing Equations in Two Variables
A linear equation is one that can be expressed in the form ax + by = c, where a, b, and c are real numbers. Equations of this kind are straight lines when they are graphed.

Formulas in Two or More Variables
Many scientific and mathematic formulas are represented in more than one variable. You can manipulate the formulas to highlight the quantity that is important to your problem.
For example,  or
or  To focus on time in this equation, you could rewrite the equation as
  The volume of a cylinder is v = bh. To focus on the height of the cylinder, you could rewrite the equation as
CHALLENGE ANSWERS
Creating Equations
1. x ≤ 5 or 5 ≥ x See “Inequalities in One Variable.”
 You may use any variable you like to stand for Francine’s and Jake’s ages.
3. k = n + 2 Let x = Nate’s salary and y = Kelly’s salary. Your graph will include points (0, 2), (1, 3), (2, 4), and so on.

 Reasoning with Equations and Inequalities
In addition to solving equations of all kinds, you may be expected to explain your reasoning.
KEY TERMS: extraneous solution, parabola, systems of equations
Rational Equations in One Variable
When you compute with rational expressions ( you begin by factoring the numerator and denominator as completely as possible and dividing both by any common factors.

Both numerator and denominator are divisible by 3, so the answer is 

Both numerator and denominator are divisible by x, so the answer is 4.
When you divide rational expressions, invert the divisor and multiply.
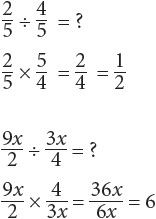
Radical Equations in One Variable
You may be asked to solve for x when there are square roots in the equation. Begin by isolating the square root term on one side of the equation.
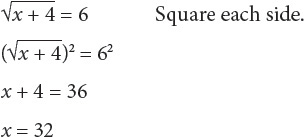
Anytime you square both sides of an equation, you run the risk of introducing an extraneous root and thus an extraneous solution. To make sure that you do not have an extraneous solution, always check your answer.
2x = 4
Imagine squaring both sides of the equation: (2x)2 = 16
x may equal either 2 or –2, but only 2 works in the original equation!
Quadratic Equations
See pages 155–156 for information on solving quadratic equations. Occasionally, the solution to a quadratic equation may be a complex number. If a and b are real numbers, complex solutions to quadratic equations may be written a ± bi.
Graphing Quadratic Equations
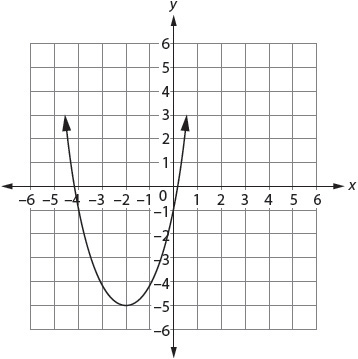
The solution to a quadratic equation forms a shape called a parabola when graphed. You can easily check your work by seeing where the parabola crosses the axes.
For example, graph this equation: y = x2 + 4x – 1.
It helps to start with a function table.
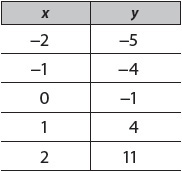
When you must find a common solution to two or more equations, the equations are called a system of equations. The solution is an ordered pair or pairs.
y = x + 3
y = 2x + 1
Solve by substitution:
x + 3 = 2x + 1
2 = x
Plug 2 into the original equations in place of x: y = 2 + 3; y = 4 + 1.
Therefore, y = 5
Solution: (2, 5)
Or solve by addition or subtraction:
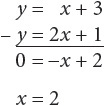
Therefore, y = 5
Solution: (2, 5)
Or solve by graphing:
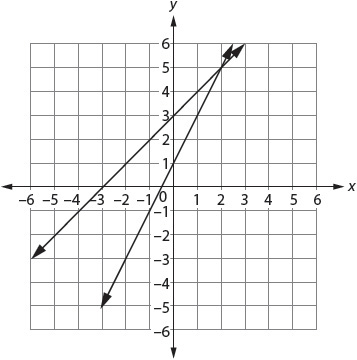
Where the lines intersect is the solution: (2, 5).
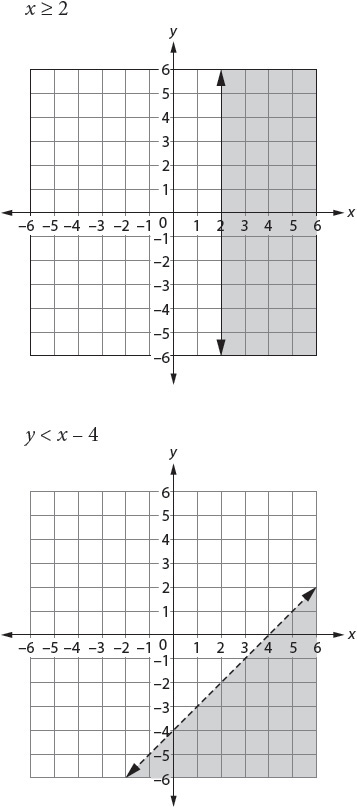
The solution to an inequality typically appears on a graph as a half-plane.
CHALLENGE Reasoning with Equations and Inequalities
CHALLENGE ANSWERS
Reasoning with Equations and Inequalities
1.  Multiplying by the inverse,
  yields
2. 139 Square both sides: 5 + x = 144, so x = 139.
3. (1, –2) By substitution, you might find that y = –5(y + 3) + 3, or y = –5y – 15 + 3, so 6y = –12, so y = –2 and x = 1. See the graph on the following page.
 Interpreting Functions
You can use functions to explore relationships among numbers.
KEY TERMS: domain, exponential function, function, intercept, interval, logarithmic function, maximum, minimum, range, rate of change
Defining Functions
For any number x, you can input that number into a function and derive a value: f(x). Ordered pairs form a function when for each value of x, there is one and only one value of y.
For example, suppose that f(x) = x2 + 2.
For f(2), the result is 6.
For  the result is
For f(100), the result is 10,002.
The domain of a function is all the values you can input and get a valid answer. In the example shown, the domain is equal to the set of real numbers. Any number outside of the complex numbers can be input into f(x) = x2 + 2.
However, suppose that 
In this case, the domain can be all the real numbers EXCEPT for zero, because there is no valid way to divide by zero.
In addition, suppose that 
In this case, the domain must be greater than or equal to zero.
You cannot find the square root of a negative number.
The range of a function is all of the outputs the function can produce.
For example, if you give the function f(x) = x2, the values x = {1, 2, 3, …}, the range of the function is the values {1, 4, 9, …}.
Sometimes the domain and range are a matter of common sense. If function f(x) gives the number of hours it takes to drive a certain distance x, then the domain must be positive, and so must the range.
Rate of Change Functions
Many familiar functions deal with rate of change. Some examples include miles per hour, cost per kilowatt, and revolutions per minute. On a graph, the slope of the line connecting the points in a rate of change function equals the average rate of change.
Here is the formula for average rate of change:

where x = the change in the input of function f, and f(b) – f(a) = the change in the function f as the input changes from a to b.
Rate of change may be positive, or increasing, as when speed is increasing. It may be negative, or decreasing, as when temperature is dropping.
A linear function has a constant rate of change. In a linear function, as x values change in a constant way, so do y values.
Intercepts and Intervals
The y-intercept of a function is the point where its graph intersects with the y-axis—the point or points at which x = 0. The x-intercept of a function is the point where its graph intersects with the x-axis—the point or points at which y = 0.
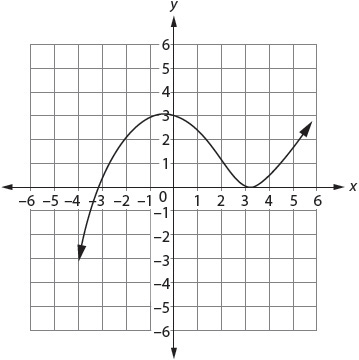
This graph of f(x) has a y-intercept of 3 and two x-intercepts: –3 and 3.
In the graph, the function is both increasing and decreasing. If you look at a given interval, a set of values that you select, you may see a specific pattern to the function. Suppose you choose the interval from x = 0 to x = 3. The function is decreasing for that interval. The maximum (highest value) for that interval is (0, 3). The minimum (lowest value) for that interval is (3, 0).
Exponential Functions
Exponential functions change by a given proportion over a set interval. An example might be a culture of bacteria whose population triples every day. A typical exponential graph shows a line that starts very close to the x-axis, never quite reaching y = 0, and then shoots upward dramatically.

Logarithmic Functions
A logarithm is the inverse of an exponential number, so the graph of a logarithmic function is the inverse of the graph of the related exponential. In this example, the top line represents f(x) = 2x. The lower line represents f(x) = log2(x), the inverse.

CHALLENGE Interpreting Functions
CHALLENGE ANSWERS
Interpreting Functions
1. No. It is not a straight line; the rate of change in x compared to y is not constant. A linear function may always be graphed as a straight line. This is more likely to show an exponential function.
2. The rate of change is positive, because the slope of the line increases. If the rate were negative, the line would slope downward.
3. 2 The line crosses the y-axis at (0, 2).
4. (0, 2) and (1, 5) At x = 0, the lowest point in the interval, y = 2.
At x = 1, the highest point in the interval, y = 5.
 Building Functions
You can construct a function to show the relationships between sets of numbers. In any function, each x value may output no more than one y value. Two x values may produce the same y value, as in f(x) = x2, where x may be positive or negative—but no x value may produce more than one y value.
KEY TERMS: arithmetic sequence, common difference, common ratio, explicit function, Fibonacci sequence, geometric sequence, inverse function, recursive function
Explicit Functions
An explicit function is simply one in which one variable may be written directly in terms of the other variable.
For example, y = 2x2
f(x) = x – 3
Recursive Functions
Recursion has to do with repetition. A recursive function is one that uses the function itself to define all applications of the function. The Fibonacci sequence is a common example.
Fib(0) = 0
Fib(1) = 1
For all other integers where x > 1, Fib(x) = (Fib(x – 1) + Fib(x – 2)).
Recursion is an especially important concept in computer programming. If you can define a function in terms of itself, you do not need to program endless specific examples.
Arithmetic and Geometric Sequences
Functions often result in sequences of numbers. An arithmetic sequence moves from one term to the next by adding a constant value called the common difference.

A geometric sequence moves from one term to the next by multiplying a constant value called the common ratio.

There are very few situations involving numbers that cannot be expressed in terms of functions. Here are some simple examples of problems expressed as functions.
There are 12 inches in a foot. How many inches are there in x feet?
f(x) = 12x
A cell phone company charges $50 for a phone and $32 per month.
What will the plan cost over the course of x months?
f(x) = 32x + 50
A population of bacteria doubles every 4 weeks. If you start with 100 bacteria, how many bacteria will there be in x weeks?

Inverse Functions
To find an inverse function, simply reverse the process in the original function.
For example, start with f(x) = 2x + 1.
The process: multiply by 2, add 1.
The inverse: subtract 1, divide by 2.
So the inverse function is 
CHALLENGE Building Functions
CHALLENGE ANSWERS
Building Functions
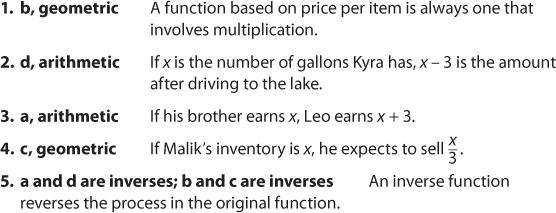
 Linear, Quadratic, and Exponential Models
You have seen that functions come in many versions. Knowing which situations call for which kinds of functions is a useful skill.
KEY TERMS: exponential function, linear function, logarithm, quadratic function
Three Kinds of Functions
The graph of a linear function is a straight line. The function increases or decreases at a constant rate. The graph of an exponential function has a horizontal line approaching zero and then moving rapidly upward. In this function, a constant change in x leads to a proportional change in y. The graph of a quadratic function is a parabola with an axis of symmetry parallel to the y-axis. The standard form for this function is f(x) = ax2 + bx + c.
Logarithms
A logarithm is the inverse of an exponential number. If an = b, then loga (b) = n.
For example, 23 = 8, so log2 8 = 3.
42 = 16, so log4 16 = 2.
104 = 10,000, so log10 10,000 = 4.
Suppose you are given a function table. How can you tell whether a function is linear, exponential, or quadratic?
For example,

To determine what kind of function this is, first look at the change in y, as illustrated. Here, the change in y is constant. For every increase in x, y changes by –5. The function is linear.
Now try this:
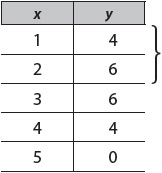
The change in y is not constant. As x increases by 1, y increases by 2, then 0, then –2, then –4. Instead of looking at the change in y, look at the change in the change in y. From 2 to 0 is –2. From 0 to –2 is –2. From –2 to –4 is –2. The change in the change in y is constant, so the function is quadratic.
Finally, consider this:

The change in y is not constant. As x increases by 1, y increases by 60, then 180, then 540, then 1,620. However, the change is proportional. The change in y increases threefold for every increase in x. Because the change is in proportion, the function is exponential.
CHALLENGE Linear, Quadratic, and Exponential Models
CHALLENGE ANSWERS
Linear, Quadratic, and Exponential Models
1. linear |
As x increases by 1, y increases by 5. |
2. exponential |
The change is proportional, so the function is exponential. |
3. exponential |
The graph skims the x-axis before ratcheting upward. |
4. linear |
As x increases by 1, y increases by 14. |
5. quadratic |
The change in the change in the y factors is constantly 2 |
 Trigonometric Functions
Trigonometry is the study of six special functions that involve relationships among the sides and angles of right triangles.
KEY TERMS: amplitude, arc, cosine, frequency, hypotenuse, periodic phenomena, Pythagorean theorem, radian measure, right triangle, sine, tangent, unit circle, wavelength
Angles on a Unit Circle
Any circle measures 360 degrees (360°). One full revolution of a ray around a circle covers 360°.
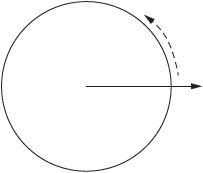
A unit circle is a circle with a radius of 1. On the diagram shown, four quadrants are labeled I through IV. Angles are measured around the circle counterclockwise from quadrant I to quadrant IV. The location of an angle in a given quadrant determines whether the points that define that angle have positive or negative values.
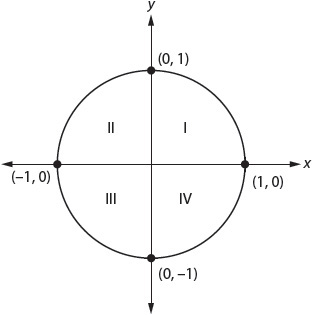
An arc of a circle is a portion of the circle’s circumference. We usually call that arc s. The radian measure (θ) of a central angle of a circle equals the ratio of the length of arc s to the length of the radius. In a unit circle, the radius is 1, so 
Right Triangles
A right triangle has one 90° angle. Here is a right triangle with central angle θ.
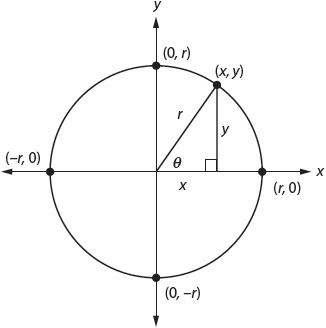
The longest side, the hypotenuse, has a length equal to the radius of the circle. The side adjacent to the central angle has a length of x, and the side opposite the central angle has a length of y.
For any right triangle, the Pythagorean theorem tells us that the sum of the lengths of the shorter sides squared equals the length of the hypotenuse squared. This is usually written a2 + b2 = c2. In the case of the triangle pictured, we could say that x2 + y2 = r2. This relationship is important to trigonometry.
Sine, Cosine, and Tangent
There are six trigonometric functions, but you will be responsible for only three. All trigonometric functions are simply ratios made from the numbers x, y, and r in a right triangle such as the one shown.

Using the diagram shown, then sin  cos
cos and tan
Practical Uses of Trigonometry
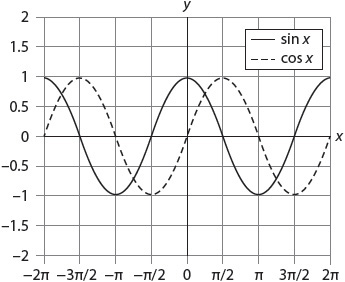
Trigonometry is used to compute angles and lengths for navigational purposes and in engineering problems. Sines and cosines are also often used to model periodic phenomena such as temperature variations, wave frequency, sound velocity, and so on.
The graph of a sine or cosine has a wave pattern that repeats. The length of the interval between repetitions is called the wavelength. The height of the wave is called the amplitude. The frequency is the number of ups and downs (oscillations) a wave has in a given period of time.
CHALLENGE Trigonometric Functions
CHALLENGE ANSWERS
Trigonometric Functions
1. 
2. 
3. 
 Congruence
Angles with equal measures, line segments with equal lengths, and figures with equal sizes and shapes are said to be congruent. Many of the important theorems that define geometry involve congruence.
KEY TERMS: bisect, congruent, dilation, parallel, parallelogram, perpendicular, reflection, rigid motion, rotation, transformation, translation
Points, Lines, and Planes
Most geometric figures are composed of points, which may be represented by ordered pairs of numbers; lines, which are defined by two points and extend forever in two opposite directions; and planes, which represent flat surfaces and extend in all directions.
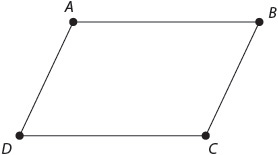
This shape is composed of line segments, sections of lines. Segment AB intersects with segment BC at point B. Segment CD intersects with segment AD at point D. Segments AB and CD never intersect. In fact, if you extended lines AB and CD forever, they would never intersect. Such lines are parallel. Because this shape is made up of two sets of parallel line segments, it is called a parallelogram.

A parallelogram exists in one plane. This figure, a cube, exists in more than one plane. Each of its faces is in a different plane. The planes intersect at segments AB, CD, CG, and so on.
Each face of a cube is a square. Each square is made up of four line segments. Segments AD and BC are parallel, but segments AB and BC intersect to form a right angle. Such segments are called perpendicular.
Congruence
When two geometric figures share the same angle measurements and lengths of sides, they are congruent. You can tell by looking at the parallelogram previously shown that its opposite sides are congruent, and its opposite angles are congruent as well.
The measures of the interior angles of any triangle add up to 180°. That does not mean that all triangles are congruent.
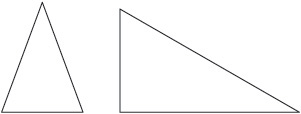
You can see at a glance that these triangles are not congruent. One has a right angle, and the other does not. One has a hypotenuse that is longer than any of the sides of the other triangle.
For triangles to be congruent, they must share angle measurements and side measurements.
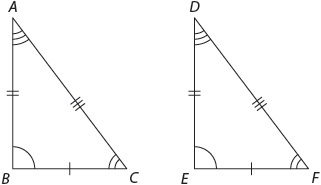
Here, triangle ABC is congruent to triangle DEF. Angle A is congruent to angle D, angle C is congruent to angle F, and angle B is congruent to angle E. Side BC is congruent to side EF, and so on.
There are three simple rules for congruent triangles.
1. SAS (Side-Angle-Side): If two sides and the angle between them in one triangle are congruent to the corresponding sides and angle of another triangle, the triangles are congruent.
2. SSS (Side-Side-Side): If three sides of one triangle are congruent to the corresponding three sides of another triangle, the triangles are congruent.
3. ASA (Angle-Side-Angle): If two angles and the side between them in one triangle are congruent to the corresponding angles and side of another triangle, the triangles are congruent.
Transformations
In a coordinate plane, any shape may be moved from one position to another. Such movement is called transformation. When a transformation maintains the shape’s congruence, it is called rigid motion. Nothing in the movement of the shape changed its angle measurements or side lengths.
The following page shows the three kinds of transformations that involve rigid motion.
A fourth kind of transformation does not maintain rigid motion. In a dilation, a stretching or shrinking, angles may remain the same, but sides do not. The result is not a congruent figure.
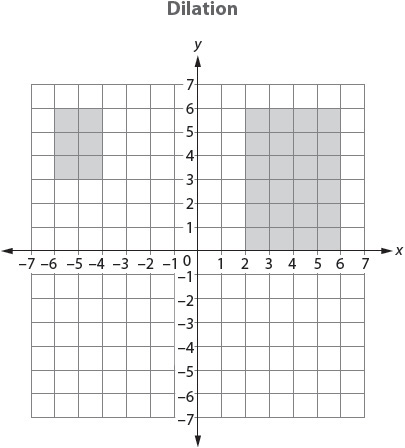
Important Aspects of Congruence
There are many important geometric rules that involve congruence. Here are just a few.
 The base angles of an isosceles triangle are congruent.
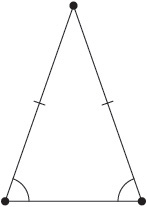
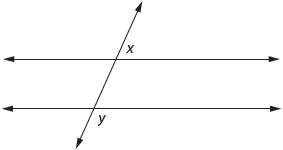
 When two parallel lines are crossed by another line, alternate interior angles are congruent, corresponding angles are congruent, and alternate exterior angles are congruent.
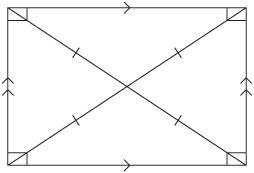
 The diagonals of any parallelogram bisect each other (intersect at their midpoints). Rectangles are parallelograms with congruent diagonals.
CHALLENGE Congruence
1. 

2. 

 Similarity, Right Triangles, and Trigonometry
In the two preceding sections of this review, you saw how relationships among sides and angles of triangles lead us to many conclusions about figures in space. You looked at situations in which sides and angles are identical. Now you will look at situations in which angles are identical, but sides are not.
KEY TERMS: complementary, dilation, scale factor, similar
Dilations
As you saw in the previous section, a dilation is a transformation that produces a figure that is the same shape but a different size from the original. A dilation may stretch the original figure, or it may shrink the original figure.
The following things remain the same when a figure is dilated:
 Angle measurements
 Parallel segments
 Midpoint
 Orientation
The figures are similar—but not congruent.

The scale factor of a dilation is the ratio of the figures’ sizes. In the figure shown, the scale factor is 2. Each segment in figure A’B’C’D’ is twice the length of the segments in figure ABCD.
If the scale factor < 1, the dilation is a reduction, or shrinking. If the scale factor > 1, the dilation is an enlargement, or stretching. If the scale factor = 1, the dilation creates congruent figures.
On page 182 you learned three rules of congruence in triangles: SAS, SSS, and ASA. There is a fourth rule for similarity: AA. If any two angles of a triangle are equal in measurement to any two angles in a second triangle, the triangles are similar.
Complementary Angles
Two angles are complementary if the sum of their measurements is 90°. In a right triangle, then, the two angles that are not right angles are complementary.
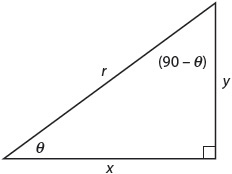
Sine and cosine then may be defined in terms of complementary angles.

In addition, because the sides of similar triangles are proportional and the angles are identical, the trigonometric ratios—sine, cosine, and tangent—of similar triangles are the same. For any right triangle with acute angle θ, the value of sin θ will be the same, and so will the values of cos θ and tan θ. You can see this easily with a 3-4-5 right triangle:

CHALLENGE Similarity, Right Triangles, and Trigonometry
CHALLENGE ANSWERS
Similarity, Right Triangles, and Trigonometry
1. 
2. 
3. 
 Circles
Circles have many interesting properties. Among them is the fact that all circles are similar.
KEY TERMS: central angle, chord, circumscribed angle, inscribed angle, intercepted arc, radian measure, radius, sector, supplementary, tangent, vertex
Relationships in a Circle
A line segment from the center of a circle to any point on the circle is a radius. A central angle is any angle formed by two intersecting radii. The vertex of the angle is the center of the circle. Remember that the measure in degrees of an entire circle is 360°. The measure in degrees of the central angle equals the measure in degrees of its intercepted arc, the arc shown here as ranging from A to B.
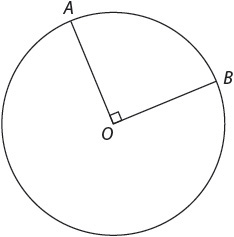
So if the measure of angle AOB is 90°, the measure of arc AB is 90° as well.
A chord is a line segment that joins any two points on a circle. A chord that runs through the center of the circle is a diameter. An inscribed angle is any angle formed by intersecting chords with its vertex on the circle. The measure of an inscribed angle is  the measure of its intercepted arc.
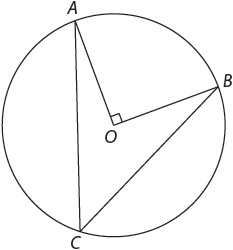
So if the measure of arc AB is 90°, the measure of angle ACB is 45°.
Inscribed angles on a diameter are always right angles.
A line that intersects one point on a circle is said to be tangent to the circle. Any radius that intersects the circle at that same point intersects the tangent at right angles.
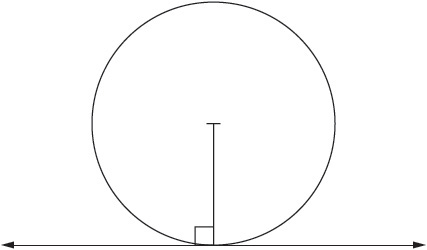
Any quadrilateral inscribed in a circle has opposite angles that are supplementary (their measurements add up to 180°). As with a circle, the angles of a quadrilateral add up to 360°.
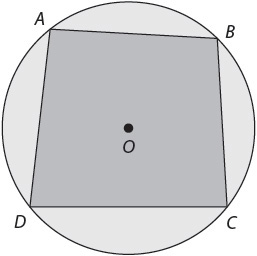
So in the figure shown, angles ABC and CDA are supplementary, and angles BCD and DAB are supplementary.
A circumscribed angle is one that has rays tangent to the circle.
In this figure, a circumscribed angle and a central angle share an arc. Because you know that the sum of the angles of a quadrilateral = 360°, and you know that the angles formed by a tangent are right angles (90° + 90°), you know that the measure of angle ABC must equal to 180° minus the measure of the central angle.
Area of a Sector
A sector of a circle is the part of the interior intercepted by a central angle.

In Section 11, Trigonometric Functions, you learned that the radian measure of a central angle of a circle equals the ratio of the length of the intercepted arc to the length of the radius. This leads to several formulas:
 The arc length s intercepted on a circle with radius r by a central angle of θ radians may be expressed as s = r θ
 The area of a sector A of a circle with radius r and central angle of θ radians may be expressed as
CHALLENGE ANSWERS
Circles

 Expressing Geometric Properties with Equations
You can use what you know about geometric figures to derive equations that will allow you to find measurements and prove theorems.
KEY TERMS: directrix, distance formula, focus, parabola
Equation of a Circle
The equation of a circle with center (h, k) and radius r is (x – h)2 + (y – k)2 = r2. You can see this more clearly by starting with a unit circle and thinking about the Pythagorean theorem.
The Pythagorean theorem tells you that in any triangle with sides a, b, and c, a2 + b2 = c2. In the triangle shown, side c (the hypotenuse) is the radius of the circle, r. Side b runs parallel to the y-axis from h to x, so its length equals (x – h). Side c runs along the x-axis from k to y, so its length equals (y – k). Plugging these new lengths into the Pythagorean formula gives you:

Distance Formula
You can use the Pythagorean theorem to find the length of any segment in the coordinate plane. When the theorem is used this way, the process is called the distance formula.
For example, find the distance from (0, 2) to (3, 6).
Begin by drawing lines to make a right triangle, as shown by the dotted lines in the figure.
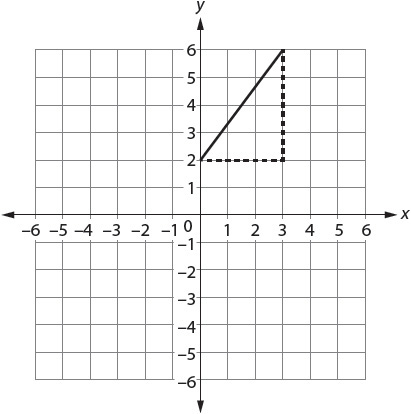
You end up with a triangle with vertices at (0, 2), (3, 6), and (3, 2).
Although the distance formula is usually written

it may be easier to think of it as
d2 = (change in x)2 + (change in y)2
In the example pictured, the change in x is 3 – 0 = 3. The change in y is 6 – 2 = 4.
d2 = (3)2 + (4)2
d2 = 9 + 16
d2 = 25
d = 5
So the distance from (0, 2) to (3, 6) is 5.
You can use this distance formula to compute the perimeter of any polygon as well as the area of any triangle or a rectangle in a coordinate plane.
Equation of a Parabola
Imagine a line parallel to the x-axis. Call that line the directrix. Then picture a point somewhere not on that line. Call that point the focus. A parabola is the set of points in that plane that are the same distance from both the directrix and the focus. Although parabolas may face in any direction, you will primarily deal with parabolas that face upward or downward.

Call the focus (a, b) and the directrix y = c. Then pick any point on the parabola and call it (x, y). Because the distance from the focus to (x, y) must be the same as the distance from the directrix to (x, y), you can use the distance formula to equate the distances and solve for y.

Square both sides.
(x – a)2 + (y – b)2 = (y – c)2
Expanding and simplifying leaves you with this equation, which is true for all parabolas:
(x – a)2 + b2 – c2 = 2(b – c)y
Equations of Parallel and Perpendicular Lines
The slopes of parallel lines are identical.
For example, y = 3x + 4
y = 3x – 1
y = 3x + 20
The slopes (coefficients of x) are all 3, so the lines are parallel. The slopes of perpendicular lines are opposite reciprocals.
For example, 
y = –2x
The slopes are reciprocals: and  and
and  They are also opposite: positive and negative. The lines must be perpendicular.
Try another example:y = 5x + 3

Again, the slopes are negative reciprocals, so the lines must be perpendicular.
CHALLENGE Expressing Geometric Properties with Equations
CHALLENGE ANSWERS
Expressing Geometric Properties with Equations

 Geometric Measurement and Dimension
You may explore the relationships between two-dimensional and three-dimensional figures using measurement or visualization.
KEY TERMS: area, Cavalieri’s principle, circumference, dissection, volume
Connecting Two and Three Dimensions
You should be able to visualize the shapes formed when you cut through a given three-dimensional figure. For example, if you cut this cylinder horizontally, the resulting two-dimensional shape is a circle. If you cut it vertically, the resulting two-dimensional shape is a rectangle.
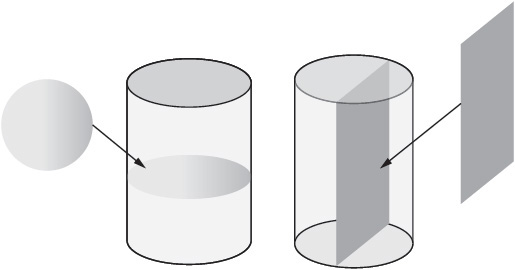
You should also be able to visualize the three-dimensional figure formed when you rotate a given two-dimensional shape. For example, rotating the following triangle in three-dimensions around the x-axis gives you a cone with the x-axis as its axis of symmetry.
Circumference and Area of a Circle
Circumference is the distance around a circle. Area is the inside space of any two-dimensional shape, measured in square units.
 Circumference of a circle = 2πr
 Area of a circle = πr2
Given a unit circle then with radius 1, C = 2π and A = π.
A common way to prove the area of a circle is through dissection, taking apart one figure to form a different, known figure. You can perform dissection on any plane figure.
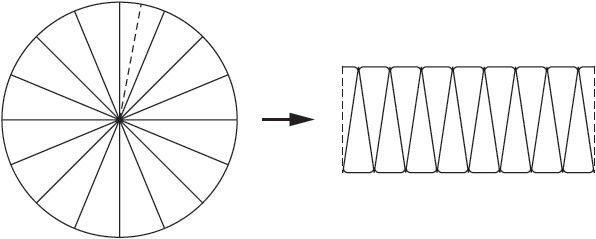
If you rearrange the parts of a circle to form a parallelogram whose base is  the circumference of the circle (or πr) and whose side is r, it should be easy to see that the area of the parallelogram is πr × r, or πr2.
Volume of a Solid Figure
The volume of a solid figure is the amount of space inside it, measured in cubic units.
Cavalieri’s principle states that given two regions in space between parallel planes, if every plane parallel to those two planes intersects both regions in cross-sections of equal area, then the two regions have equal volume. If you think of a cylinder as endless circles, all with the same area, you can easily derive the formula for the volume of a cylinder.
 Volume of a cylinder = base × height = πr2h
In other words, when you find the volume of a cylinder, you are multiplying the area of the circle that forms the base of the cylinder times the height of the cylinder.
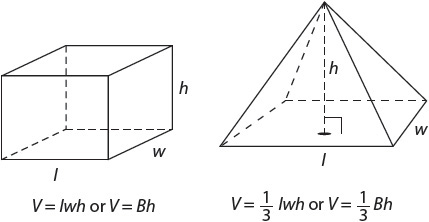
Cavalieri’s principle and dissection may also be used to find the volumes of other three-dimensional figures:
 Volume of a cone =
 Volume of a sphere =
 Volume of a pyramid =
  (base × height)
A pyramid may have a rectangular base or a triangular base. Either way, the formula is the same. Essentially, the volume of a pyramid is  the volume of a prism with the same base and height.
CHALLENGE Geometric Measurement and Dimension
CHALLENGE ANSWERS
Geometric Measurement and Dimension

 Modeling with Geometry
Geometric figures and their measurements can help you solve real-life problems.
KEY TERMS: density
Matching Shapes to Objects
Suppose you were asked to calculate the volume of a baby. It’s an odd request, but it is possible to figure out if you think about the baby in terms of geometric figures. Perhaps the baby’s head is a sphere. Her torso, arms, and legs might be a series of cylinders. Thinking about real-life objects in geometric terms can be useful when it comes to solving design problems. Architects do it when they determine how large a museum room should be to allow a given number of viewers to view art easily. Engineers do it when they consider how small a compact car can be and still seat four people comfortably. And those are only examples of thinking about people in geometric terms! For a grocery store, designers consider how many boxes (prisms) can fit on a shelf of a given size or how many oranges (spheres) can be displayed at once in a given bin. Because the Common Core State Standards try to provide real-life applications of the skills and concepts you are learning, you can expect to see real-life applications on the TASC test.
Concepts of Density
The density of any material is its mass per unit volume. The ratio of mass to volume can be expressed as density = 
For example, the density of water at sea level at a temperature of 4°C (39.2°F) is 
In some cases, you can use area instead of volume to determine density, because the material (a sheet of paper, an acre of land) is essentially two-dimensional. In the case of population density, for example, the ratio may be expressed as population density = 
For example, Hong Kong has 7 million people in an area of only around 1,100 square kilometers.
Hong Kong’s population density then is  or around 6,364 people per square kilometer.
CHALLENGE Modeling with Geometry
CHALLENGE ANSWERS
Modeling with Geometry

 Interpreting Categorical and Quantitative Data
Statistics are used to collect and analyze data. Using statistics allows you to group, compare and contrast, and report information. Often, that information is reported in the form of a graph.
KEY TERMS: box plot, conditional relative frequency, correlation, dot plot, histogram, joint relative frequency, marginal relative frequency, mean, median, normal distribution, outlier, quartile, range, relative frequency, scatter plot, standard deviation
Representing Data
Adot plot is a simple statistical chart that helps show at a glance the distribution of data. A histogram is more elaborate and often shows the frequency of observations over time. A box plot shows groups of data through their quartiles, dividing each data set into four equal groups.


Median, Range, Mean, and Standard Deviation
The box plot shown is based on medians. The median of a set of data is the middle number, or the number that separates the upper values of data from the lower values of data.
To find the median, you begin by arranging the data in numerical order.
For example, 180, 220, 220, 240, 240, 240, 260, 260, 260, 280, 320.
Because there are 11 values, the median is the sixth value.
Q2 = 240
To complete a box plot, you also need the medians of the top half of the values and the bottom half of the values, leaving out Q2.
For example, 180, 220, 220, 240, 240 represents the bottom half.
The median Q1 = 220.
260, 260, 260, 280, 320 represents the top half.
The median Q3 = 260.
As you can see in the box plot, the boxed section goes from Q1 to Q3. Then so-called whiskers are drawn to the minimum and maximum values in the data set.
The minimum and maximum values of the set shown are 180 and 320. The range of values is the maximum minus the minimum value; in this case, 320 – 180, or 140.
The mean, or average, of a set of data is the sum of the values in the data set divided by the number of items in the data set.

The standard deviation of a set of data shows how much variation there is from the mean of the data. You calculate the standard deviation by finding the mean, subtracting that mean from each value, and squaring the result. Then you average the differences and take the square root of that.
For example, let’s say that the mean is 247.
(180 – 247)2 = (–67)2 = 4,489
(220 – 247)2 = (–27)2 = 729
(220 – 247)2 = (–27)2 = 729
(240 – 247)2 = (–7)2 = 49
(240 – 247)2 = (–7)2 = 49
(240 – 247)2 = (–7)2 = 49
(260 – 247)2 = (13)2 = 169
(260 – 247)2 = (13)2 = 169
(260 – 247)2 = (13)2 = 169
(280 – 247)2 = (33)2 = 1,089
(320 – 247)2 = (73)2 = 5,329
Now average those values and take the square root.

In this population of football players, most players have a weight within 34.4 pounds of the mean. If a player were to deviate from the mean by two or three times the standard deviation (68.8 pounds or more), he might be considered an outlier, outside the normal distribution of data.
Outliers may affect the shape of the data. If the mean and median of a data set are identical, the data, when graphed, is symmetric. If the mean is less than the median, the data may skew left. If the median is less than the mean, the data may skew right.
Two-Way Frequency Tables
You can construct tables in a matrix format to show the frequency distribution of two variables. Such tables show totals in two places plus a grand total in the lower right corner.
Suppose you wanted to compare certain qualities of the members of the 11-man football team.

Such a table may show relative frequency, the ratio of the value of a subtotal to the value of the total. To find the relative frequency, you divide each value by the grand total, 11.

The joint relative frequency of a player’s being from Texas and having played in high school is  or about 0.55. The joint relative frequency of a player’s not being from Texas and not having played in high school is much smaller
  or around 0.09.
The marginal relative frequency of a player’s being from Texas is found in the Total row at the bottom  or around 0.64. The marginal relative frequency of a player’s not having played in high school is found in the Total column on the right
  or around 0.18.
To find conditional relative frequency, you divide the joint relative frequency by the marginal relative frequency. You may use conditional relative frequency to find conditional probability.
For example, find the probability that a player who’s from Texas did not play football in high school.
Start with the total for players who are from Texas. That marginal relative frequency is 0.64. Out of those players, only 0.09 (9%) did not play in high school. The conditional relative frequency then is  Given players on this team who are from Texas, there is a probability of 14% that they did not play football in high school.
Scatter Plots
You can represent two variables on a type of graph called a scatter plot. Going back to the data about the weight of football players, you could create a scatter plot that compares the players by weight in pounds and height in inches.
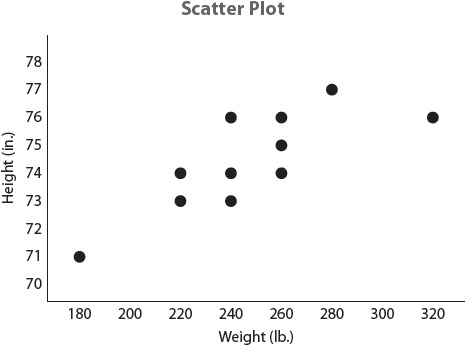
Although it is not perfectly consistent, you can see that there is a correlation (relationship) between players’ heights and weights. In general, the taller the player, the heavier he is. If you were to draw a line to show the trend, or direction, of the data, it would move upward diagonally from left to right. You could draw conclusions from the slope of the line about how closely height and weight are correlated.
Correlation and Causation
Just because two sets of data are correlated does not mean that one caused the other. For example, being heavy does not make you tall. Height is caused by a variety of factors, including genetics and overall health. Be careful not to assume that data set A causes data set B merely because you see a trend in the data.
CHALLENGE Interpreting Categorical and Quantitative Data
CHALLENGE ANSWERS
Interpreting Categorical and Quantitative Data
 Making Inferences and Justifying Conclusions
Statistics are used to make predictions or inferences about populations. It’s important to have enough data and to determine whether differences in data are meaningful.
KEY TERMS: confidence level, margin of error, model, random sample, significant
If you wanted to find the average height of students in a high school, you could measure all the students, add those measurements, and divide by the total number of students. If you wanted to find the average height of high school students in Vermont, that method would not be very efficient. Instead, you could measure a random sample of students and make a prediction based on what you found.
For a sample to be random, every item or person in that sample must have an equal chance of being picked. In the example shown, choosing every student with the last name Smith might seem random, but it would leave out students with different ethnic heritages. You might do better to pick students by ID numbers, birth dates, or some other attribute unrelated to their backgrounds.
Models and Simulations
You can start an experiment with a model in mind. For example, in an experiment involving tossing a coin, the model gives you the set of possible outcomes (heads, tails) and the probability of each response (0.5, or 50%). If you are looking at the heights of students, you might start with statistics from an earlier time and make a prediction about how heights may have changed with improved nutrition.
You then might conduct a simulation and compare your results to your predictions. Your coin-tossing simulation might involve tossing a coin 10 times. Your height-measuring simulation might involve testing a random sample. Today large simulations can be done on computers or graphic calculators without ever tossing a coin or measuring a student.
Margin of Error
When you use a random sample, you are using a subset to draw conclusions about a much larger population. Since your sample is not complete, the data you receive may vary from the expected data. How much variation is OK? That depends on how close you want to be.
The margin of error in an experiment or survey is the range of values within which results accurately measure what they are supposed to measure. These factors affect the margin of error:
 Confidence level
 Sample size
 Proportion in the sample
The confidence level is something you decide. Often, experimenters choose a 95% confidence level. That means that out of 100 attempts or measurements or surveys, they expect that 95 will return accurate results. The sample size matters. You might toss a coin 10 times and get heads 8 times. That does not mean that the probability of tossing a head is 80%. It means that your sample size is too small. You might need to toss the coin 100 times to even out at 50%.
The proportion in a sample makes a difference in the margin of error as well. In the coin toss, you expect to find  heads in 100 tosses. In your student height experiment, you might predict that
  students will be over 6 feet tall. An estimate of
  is subject to more variability than an estimate of
  is.
is.
You may find margin of error by using a formula, using a preexisting table, or using an online calculator.
Significance
If a result is significant, it is likely to be caused by something other than random chance. You measure significance using p-values, which represent the probability that random chance cannot explain the result. Usually, a p-value of 0.05 (5%) or less is considered statistically significant.
CHALLENGE Making Inferences and Justifying Conclusions
CHALLENGE ANSWERS
Making Inferences and Justifying Conclusions

 Conditional Probability and the Rules of Probability
Sometimes you look at more than one event at a time, as you did in the two-way frequency tables in Section 18. Conditional probability is the likelihood that given event B, event A will occur, or vice versa.
KEY TERMS: addition rule, complement, conditional probability, event, independent, intersection, sample space, subset, union
In a random experiment, the sample space is the set S that includes all possible outcomes.
For example, throwing a number cube yields the sample space
S = {1, 2, 3, 4, 5, 6}.
Tossing a coin yields the sample space S = {H, T}.
Within a given sample space are subsets known as events. An event is a set of outcomes of the experiment. Given two events, A and B, there are a variety of possible relationships.
 The union of events A and B is the event that takes place only if A occurs or B occurs.
 The intersection of events A and B is the event that takes place only if A occurs and B occurs.
 The complement of event A is all outcomes that are not the event. The event plus its complement equals all possible outcomes.
For example, toss a number cube. The sample space is
S = {1, 2, 3, 4, 5, 6}.
Let A be the event “an odd number” and B be the event “divisible by 3.”
A = {1, 3, 5} and B = {3, 6}.
The union of A and B = {1, 3, 5, 6}.
The intersection of A and B = {3}.
The complement of A = {2, 4, 6} and the complement of B = {1, 2, 4, 5}.
Independent Events
An independent event is not affected by previous events. Rolling a number cube and getting a 4 does not mean that the next time you roll a number cube, you will get a 1, or a 2, or any specific number. The events are unrelated. Every time you roll, you have a 1 in 6 chance of rolling a 4.
To calculate the probability of two or more independent events, multiply the probabilities of each.
For example, given a number cube, what is the probability of rolling three 4s in a row?

Given a coin, what is the probability of tossing heads five times in a row?
0.5 × 0.5 × 0.5 × 0.5 × 0.5 = 0.03125
The probability of achieving a series of independent events decreases rapidly as the series increases.
A good way to think about independent events is to consider the conditional probability of A and B this way: The conditional probability of A given B is the same as the probability of A. The conditional probability of B given A is the same as the probability of B.
Addition Rules
Sometimes two events are mutually exclusive. If one occurs, the other cannot. In such a case, to find the probability of event A or B, add the probabilities of each event:
P(A or B) = P(A) + P(B)
For example, given a number cube, what is the probability of rolling a 2 or a 4?
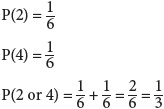
You have a 1 in 3 chance of rolling a 2 or a 4.
Sometimes two events are non-mutually exclusive. It is possible to have both events occur at once. You can chart events like this on a two-way table. (See page 203.) When two events are non-mutually exclusive, find the probability of event A or B by subtracting the overlap of the two events from the sum of the probability of each event:
P(A or B) = P(A) + P(B) – P(A and B)
For example, return to the table of football players on page 203. There are 11 players in all. Of those, 7 are from Texas, and 4 are not. In addition, 9 played ball in high school, and 2, including 1 Texan, did not. If you choose a player at random, what is the probability of choosing someone from Texas or someone who played ball in high school?
P(Texas or HS) = P(Texas) + P(HS) – P(Texas and HS)

CHALLENGE Conditional Probability and the Rules of Probability
CHALLENGE ANSWERS
Conditional Probability and the Rules of Probability
1. {10 of clubs} In this intersection, both A (clubs) and B (10s) must occur.
2.  The odds of drawing a 2 are
  because there are four 2s in the deck. In lowest terms, that is
  Because the events are independent when you put the card back and reshuffle, you can multiply to find the probability:
3.  These are mutually exclusive events—a card cannot be both a heart and a spade. Therefore, use the first addition rule. P(hearts) + P(spades) =
4.  These are non-mutually exclusive events, because one card is both a Jack and a diamond. Use the second addition rule. P(Jacks) + P(diamonds) – P(Jacks and diamonds) =
52 questions, 90 minutes
The following test is designed to simulate a real TASC Mathematics Test section in terms of question formats, number, and degree of difficulty. To get a good idea of how you will do on the real exam, take this test under actual exam conditions. Complete the test in one session and follow the given time limit. Answers and explanations begin on page 228.

1. Voltage = current × resistance. Voltage is measured in volts, current is measured in amperes, and resistance is measured in ohms. What is the resistance in ohms if the voltage is 3 volts and the current is 1.5 amperes?
A. 4.5 ohm
B. 3 ohm
C. 2 ohm
D. 1.5 ohm
2. Solve for x: log2 64 = x.
A. 3
B. 4
C. 5
D. 6
3. There are 52 cards in a standard deck of cards in four equal suits from 2 through Jack, Queen, King, and Ace. The suits are clubs, spades, hearts, and diamonds. If you pick a card at random, put it back, and reshuffle each time you draw, what is the probability of drawing four Aces in a row?


4. Solve for 
Mark your answer in the grid on your answer sheet.
5. Which number is equivalent to 216⅓?
A. 6
B. 36
C. 72
D. 612
6. Which city has the greatest population density?

A. Jakarta
B. Beijing
C. Delhi
D. Ho Chi Minh City
7. Which number is equivalent to 
A. 3
B. 9
C. 20.25
D. 36
8. Greta ran 5 kilometers in the Dryden Lake Festival 5K Race. How many meters did she run?
A. 5
B. 50
C. 500
D. 5,000
9. Use the distance formula to find the perimeter of ABC. Think:
d2 = (change in x)2 + (change in y)2

A. 15
B. 
C. 
D. 50
10.  Gasoline has a density of about 0.66 grams per cubic centimeter. To the nearest kilogram, what is the mass of a container of gasoline that measures 30 centimeters by 30 centimeters by 30 centimeters deep?
A. 136
B. 59
C. 40
D. 18
11. Solve: 42 + 43 + 40
A. 1,024
B. 84
C. 81
D. 0
12. If the moon’s circumference is 6,784 miles, what is its radius? Use 3.14 as pi, and solve to the nearest mile.
Mark your answer in the grid on your answer sheet.
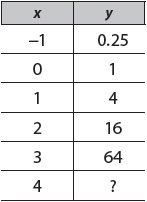
13. Find the next y-value in this exponential function.
Mark your answer in the grid on your answer sheet.
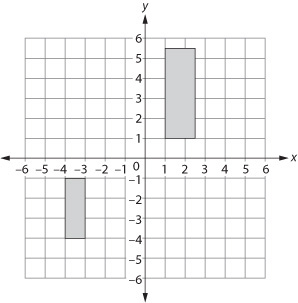
14. What is the scale factor of this dilation?
A. 1.5
B. 2
C. 3
D. 4.5
15. Which is another way to write x4 + y4?
A. (x + y)2 + (x + y)2
B. x5 + y3
C. (x + y)4
D. (x2)2 + (y2)2
16. Which names the function for this arithmetic sequence?
2, –13, –28, –43, …
A. f(x) = x – 5
B. f(x) = x + 11
C. f(x) = x – 11
D. f(x) = x – 15
17. In this drawing, the measure of angle θ= 55°. What is the measure of arc s?
A. 27.5°
B. 55°
C. 73.5°
D. 110°
18. For a grocery display, Matt constructed a pyramid with a square base measuring 3 feet on each side. If the pyramid was 5 feet high, what was the volume of Matt’s pyramid?
A. 5 ft3
B. 15 ft3
C. 45 ft3
D. 60 ft3
19. To calculate the standard deviation of a set of values, first find the mean of the values. Then subtract that number from each value, and square the result. Then average those differences and take the square root of that.
Jasmine measured five seedlings and got these results. Find the standard deviation for the values in the table.

A. 16
B. 8

D. 6
20. Quadrilateral ABCD is inscribed in circle O. If angle ABC measures 90°, what is the measure of angle BCD?
A. 45°
B. 90°
C. 135°
D. The answer cannot be found with the information given.
21. If f(x) = x2 – 1, what is f(x) when x = 12?
Mark your answer in the grid on your answer sheet.
22. Which is another name for 50–2?


C. 25
D. –2,500
23. Solve for x: 2x2 – 3x = 5
A. (–1, 2.5)
B. (2, 1.5)
C. (–2, 1.5)
D. (1, –2.5)
24. Ellen sliced a cylinder of icebox cookie dough to make cookies. In the package, the dough measured 12 inches long by 2 inches in diameter. As they bake, the cookies expand by about 10 percent. What is the least distance by which Ellen can separate the cookies on the cookie sheet to avoid overlap?
 inch
inch
 inch
inch
C. 1 inch
D. 2 inches
25. The function f(x) is shown on the graph. Find f(–2).

A. –5
B. –2
C. 2
D. 4
26. Find the positive value of x that solves this quadratic equation.
8x2 + 2x – 3 = 0
Mark your answer in the grid on your answer sheet.

27. Find an equivalent expression: (5x2 + x) – (2x2 + x)
A. 7x2 + 2x
B. 10x4 – x2
C. 3x2 + 2x
D. 3x2
28. Flora discovered that this year, she is  the age of her mother minus
  her own age. How could Flora express this algebraically?


29. If f(x) = 3x + 4, what is the inverse function?
A. f–1(x) = 4x + 3
B. f–1(x) = 3x – 4


30. What is the square of 4i?
A. 4i2
B. –4
C. –16
D. –2i
31. Two parallel lines are crossed by a transversal. What is the measure of angles x + y?

Mark your answer in the grid on your answer sheet.
32. This box plot shows the sales of water heaters over one year at Hefty Water and Heating.

What is the median number of water heaters sold in 2013?
A. 50
B. 75
C. 100
D. 125
33. The function m(g) tells the number of miles driven using g gallons of gas. What is a reasonable domain for that function?
A. only positive integers
B. all real numbers
C. real numbers except for zero
D. all rational numbers
34. Which number is equivalent to 


35. Nathan wrote the letters of his first and last name on separate cards:
NATHAN GOLD
Then he placed the cards face down in two piles, one for his first name, and one for his last name. If Nathan picks a card at random from each pile, what is the probability that he will choose an N and a G?


36. Steve has 10 U.S. coins in his pocket. Half of the coins are dimes, and the value of all 10 coins is $0.95. How many nickels does Steve have?
Mark your answer in the grid on your answer sheet.
37. Which system of equations corresponds to this graph?
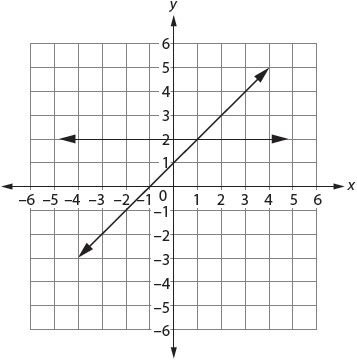
A. y = x + 2; y = x + 1
B. x = 2; y = x – 1
C. y = 2x; y = x + 2
D. y = 2; y = x + 1
38. What is the whole number between 2 and 9 that when added to this data set would result in a perfectly symmetrical data set?
2 5 6 6 8 8 9
Mark your answer in the grid on your answer sheet.
39. The diagram shows an arc on circle O with central angle θ.

What is the measure of θ?
A. 1 radian
B. 2 radians
C. π radians
D. 5 radians
40. Dahlia is using a measuring device with divisions of 0.1 mL. If she measures 3.4 mL of a liquid, what is true of the amount of liquid?
A. It is between 3.4 and 3.45 mL.
B. It is between 3.35 and 3.45 mL.
C. It is between 3.3 and 3.4 mL.
D. It is between 3.25 and 3.50 mL.
41. AB is a diameter of circle O. If angle x measures 52°, what is the measure of angle y?
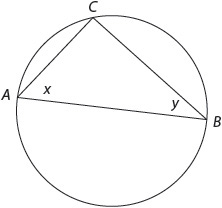
Mark your answer in the grid on your answer sheet.
42. On the graph shown, what is the maximum for the interval x = 1 to x = 2?
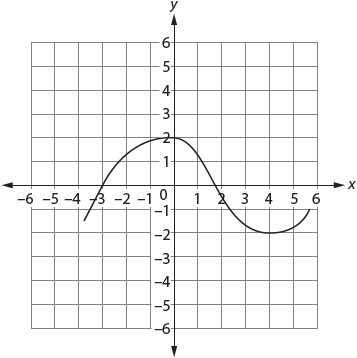
A. (0, 1)
B. (1, 1)
C. (0, 2)
D. (2, 0)
43. Which line would be perpendicular to a line whose equation is y = 2x – 3?

B. y = 2x + 3
C. –y = 2x – 3

44. Which of these describes two independent events?
A. Joan picks two cards in a row from the magician’s hand.
B. Joan rolls two number cubes, one in each hand.
C. Joan picks two coins, one after the other, from a pile of coins.
D. Joan pulls two socks from her drawer.
45. Imagine that this square rotates 360° around the y-axis. What three-dimensional figure will it form?
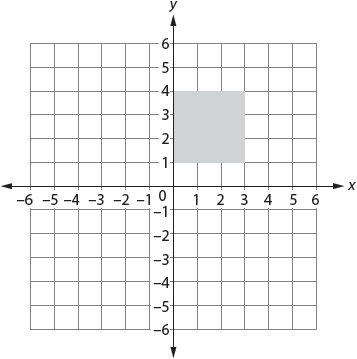
A. pyramid
B. prism
C. sphere
D. cylinder
46. What fraction is equivalent to 4–3?
Mark your answer in the grid on your answer sheet.
47. Find an equivalent expression: (3 + 4i) + (7 + i)
A. 28i + 3i
B. 15i
C. 10 + 4i
D. 10 + 5i
48. The human resources department at Widgets, Inc., prepared this scatter plot to show income relative to years of experience on the job.

What trend do the data show?
A. There is a positive correlation between experience and pay.
B. There is a negative correlation between experience and pay.
C. There are an unexpected number of outliers in the data.
D. There are not enough data points to draw a conclusion.
49. In fractional terms, what is the probability of tossing a nickel, a dime, and a quarter and getting heads on all three?
Mark your answer in the grid on your answer sheet.
50. The sum of  and pi is _____.
A. always a rational number
B. sometimes a rational number
C. always an irrational number
D. sometimes an irrational number
51. Find an equivalent expression: (x2 + 2x)(x2 – 2x)
A. x4
B. 2x2 – 4x
C. x4 – 4x2
D. x4 + 2x3 – 2x2
52. A geometric sequence moves from one term to the next by multiplying a constant value called the common ratio. If the common ratio in a sequence is  what number follows 75 in that sequence?
Mark your answer in the grid on your answer sheet.
 This is the end of the TASC Mathematics Practice Test.
1. C If voltage = current × resistance, resistance = voltage ÷ current. 3 ÷ 1.5 = 2.
2. D Log2 64 = x means that 2 is raised to some power to achieve 64. 26 = 64, so the answer is 6.
3. D The probability of these independent events is the product of their probabilities. The probability of drawing 1 Ace is  so the probability of drawing 4 Aces, assuming you put the cards back each time, is
  Another way to think of this is that the odds of choosing each Ace in a suit is
  and
and  , four times is
4. 190 Get rid of the square root sign by squaring each side. 6 + x = 196, so x = 190.
5. A An exponent of  is the same as the cube root. The cube root of 216 is 6.
6. B Population density is determined by dividing population by area. In this case, the greatest density is that of Beijing, with around 11,516 people per square kilometer.
7. A Which number multiplied by itself four times equals 81? The answer is 3.
8. D One kilometer equals 1,000 meters.
9. C The perimeter is the distance around the figure. You already know the lengths of two of the legs: segment BC is 5 units long, and segment A is 4 units long. To find the length of AB, use the distance formula. The change in x is from 4 to 0, or 4 units. The change in y is from 5 to 0, or 5 units. 42 + 52 = d2, so 16 + 25 = d2, making d equal to  The entire perimeter then is
  or choice C.
10. D Calculate the volume: 30 × 30 × 30 = 27,000 cm3. If density =  then mass = (density)(volume). 27,000 × 0.66 = 17,820 grams, or around 18 kilograms.
11. C Calculate each one, and then add: 16 + 64 + 1 = 81.
12. 1,080 If you know the moon’s circumference, you can work backward to find its radius by using the formula for circumference: C = 2πr. 6,784 = 6.28r, so r = 6,784 ÷ 6.28 = 1,080.2547, or 1,080 miles to the nearest mile.
13. 256 Look for the pattern. For every increase by 1 in the x-values, the y-values increase fourfold. Therefore, the missing value should be 64 × 4, or 256.
14. A The small rectangle measures 1 by 3 units. The large rectangle measures 1.5 by 4.5 units. The scale factor is 1.5—each length in the small rectangle is multiplied by 1.5 to form the large rectangle.
15. D If necessary, plug in real numbers as x and y to prove that only choice D names the same number as x4 + y4.
16. D To check, test the function on the sequence: 2 – 15 = –13, –13 – 15 = –28, –28 – 15 = –43.
17. B The arc contained by a central angle has the same measure as the central angle.
18. B The base is 3 × 3, or 9 feet. The height is 5 feet. The formula for volume of a pyramid is  bh. In this case,
  (9 × 5) = 15.
19. C Follow the steps. Find the mean: (18 + 12 + 15 + 15 + 20) ÷ 5 = 16. Subtract the mean from each value: 18 – 16 = 2. 12 – 16 = –4. 15 – 16 = –1. 15 – 16 = –1. 20 – 16 = 4. Square the results: 4, 16, 1, 1, 16. Now average those values: 4 + 16 + 1 + 1 + 16 = 38. Divide 38 by 5 = 7.6. Finally, take the square root of that: 
20. B Draw a picture if it helps. You should be able to figure out that if one angle of a quadrilateral is equal to 90°, and the opposite angle must also be 90° because the quadrilateral is inscribed in a circle, all the angles must equal 90°.
21. 143 Substitute 12 as x: 122 – 1 = 144 – 1 = 143.
22. A Any number n–2 is equivalent to 
23. A Put the equation in a form where the right side is 0: 2x2 – 3x – 5 = 0. Factor: (2x – 5)(x + 1) = 0. Find the numbers that make that equation true: 2x – 5 = 0, so x = 2.5. x + 1 = 0, so x = –1.
24. A The cylinder shape is irrelevant, except to help you recognize that the cookies will be circular. If the cookies’ diameter is 2 inches, and they expand by 10 percent, each cookie may end up with a diameter of 2.2 inches. Two cookies will expand toward each other by 0.1 inches apiece, or 0.2 inches in all. You will be safe if the cookies are 0.25 inches apart.
25. B At the point on the graph where x = –2, y = –2.
26.  or 0.5 Factoring that original equation gives you (4x + 3)(2x – 1) = 0. Make each of the parenthetical statements equal to zero: (4x + 3) = 0, so 4x = –3, so x = –0.75. (2x – 1) = 0, so 2x = 1, so x =
  or 0.5. You are asked for the positive value only.
27. D Subtract like terms. 5x2 – 2x2 = 3x2, and x – x = 0.
28. A Let F be Flora’s age and M be her mother’s age. Flora’s age is half her mother’s age  minus half her own age
  Only choice A shows that relationship. For example, Flora may be 18, and her mother may be 54. Plugging those numbers into the other equations should show you that they are incorrect choices.
29. D To find the inverse of the equation, picture y as a replacement for f(x) and then switch x and y:
y = 3x + 4
x = 3y + 4
Then solve for y:

Finally, replace y with the inverse notation: f–1(x).
30. C The square of any number ni is –(n2).
31. 180 The transversal crosses both parallel lines to form angles x and y on each. Since the angles are complementary, they must add up to 180°.
32. B The median appears as the central line in the box on a box plot. Here it equals around 75.
33. A You cannot drive negative miles using negative gallons of gas, so it makes sense that the domain should be all positive integers.
34. C Cube the numerator and then the denominator. The result is 
35. D These are independent events. The first may result in 2N, 2A, T, or H. The second may result in G, O, L, or D. The odds of choosing an N are  or
or  . The odds of choosing a G are
  . Multiplying those odds yields
  .
.
36. 4 You may guess-and-check, or you may use algebra. Because you know that half the coins, 5 coins, are dimes, you may subtract that $0.50 and think of the total as $0.45, not $0.95. It should be clear that none of the remaining coins can be pennies or half dollars, so write an equation involving quarters and nickels: Q + N = 5 coins in all; 25Q + 5N = 45. You may not need to go farther and substitute, but if you wish to do so, rewrite the second equation as 25(5 – N) + 5N = 45. Factor out 5: 5 (5 – N) + N = 9. 25 – 4N = 9. 4N = 16. N = 4. Check against the original problem: 5 dimes + 4 nickels + 1 quarter = 10 coins. 5(0.10) + 4 (0.05) + 1(0.25) = 0.95.
37. D You should see at a glance that y = 2 for the horizontal line, so only choice D is possible. To check the second equation, pick any point on that line and see whether y = x + 1. It is true for (0, 1), (2, 3), and so on.
38. 4 For the data set to be exactly symmetrical, the mean must be equal to the median. In the given data set, the median is 6 and the mean is about 6.286. Adding 4 to the data set gives you a median of 6 and a mean of 6.
39. A The definition of a radian is the angle made by taking the radius of a circle, in this case 5 inches, and wrapping it around the circumference of the circle. In any circle where the radius equals the measure of the arc formed by a central angle, that central angle measures 1 radian.
40. B For a measuring instrument calibrated at 0.1 mL intervals, the expected level of error would be ± 0.05 mL.
41. 38 Because one angle is formed by two chords with endpoints on the diameter, that angle must measure 90°. The sum of the angles in a triangle is 180°. Therefore, 180 – (52 + 90) = the measure of angle y. Angle y measures 38°.
42. B Look for the highest point within that interval. The interval ranges from (1, 1) to (2, 0).
43. A For the lines to be perpendicular, the x-coefficients must be inverse reciprocals. The inverse reciprocal of 2 is –  .
.
44. B In choices A, C, and D, removing one object means that the second pick is dependent on the first, because the first has eliminated choices from the second. Only choice B offers truly independent choices, because the result of the first roll has nothing to do with the result of the second.
45. D Imagine that you staple the left side of a paper square along the y-axis and spin it freely otherwise around that axis. Rotating it all the way around would form a cylinder the height of the square with a radius the width of the square.
46.  Any number n–3 is equivalent to
47. D Add like elements first: 3 + 7 = 10, and 4i + (1)i = 5i.
48. A There is a positive correlation: If you drew a line through the data so that equal numbers of points were above and below the line, the line would travel upward, showing that more experience correlates with more pay. There are few outliers on the graph (choice C), and the data points here seem to point to a clear conclusion (choice D).
49.  The probability of heads on the nickel is
  , heads on the dime is
  , and heads on the quarter is
  . To find the probability of all three, multiply those probabilities.
50. C A rational number plus an irrational number is always an irrational number. Pi is an example of an irrational number, because it cannot be written as a simple fraction.
51. C Think of the four separate values as a, b, c, and d. Multiply ac, ad, bc, and bd, and add all four products, as here: (x2 + 2x)(x2 – 2x) = (x2)(x2) – 2x3 + 2x3 – 4x2, or x4 – 4x2.
52. 37.5 The sequence is geometric, with each value half that of the one before. If x = 75, the next number in the sequence is half that, or 37.5.