Note: Percentage growth rates will not match column totals due to rounding.
Source: Capgemini Lorenz Curve Analysis, 2013
Figure 4.1 People with over $US1 million spare by country, 2011–12
The idea that capital income is ‘unearned’ is beneath contempt. You earn the returns on an investment by working, delaying gratification and saving. The argument that an inheritance is ‘unearned’ (so that we can take what we like in Inheritance Tax) is just as weak: someone earned the money.
Mathew Sinclair, TaxPayers’ Alliance, 20131
Between 1 and 2 per cent of people are not naturally empathic.2 This small group find it enormously difficult to understand how other people feel or to appreciate a different point of view. Others have a little empathy but are still highly individualistic.3 It is hard to become rich if you are not primarily looking out for yourself. Those who amass fortunes manage to do so partly because they don’t like sharing and see themselves as special, as more careful with money, as being worth more than others. They tend to see others, and sharing, as ‘just weak’.
The richest people in the world have a revealing acronym to describe themselves – HNWI – high-net-worth individuals. These are people who have a spare million US dollars’ worth of wealth, not including their primary residence or their pension. Worldwide, there were estimated to be 12 million such people in 2012, with a mean ‘investable’ wealth of $3.85 million each. It is worth looking at where the world’s richest live, what they have, and the huge inequalities even within this tiny group.
Most of the world’s 12 million superrich possess ‘only’ a little over $1 million in disposable wealth. In the two years after the 2008 credit crunch their numbers and mean wealth fell slightly, but by 2012 both were again rising. The majority of the world’s HNWIs live in the US, Japan or Germany. London is preferred as a second home, so many are not officially resident in the UK. Around 465,000 HNWIs live in the UK,4 making up about 1 per cent of all British adults and accounting for just under 4 per cent of the world’s superrich.
Globally, the top 1 per cent of HNWIs, with at least £30 million in disposable assets, are known as ‘Ultras’ (UHNWI). In 2012 there were 111,000 of these people in the world, but they held over a third of all the wealth of the 12 million superrich – or, on average, just under $150 million each. By the end of 2013 the richest 300 people in the world held $3.7 trillion, or about $12 billion each,5 and their collective wealth rose the most in that year – by 16.5 per cent.6 The idea that they had earned that money is highly questionable.
London has become home to more UHNWIs than any other city on the planet. With somewhat spurious precision, the estate agent Frank Knight recently reported that there were now some 4,224 UHNWI families living in London alone in 2014, and that they expected some 5,000 families with liquid assets exceeding $30 million to be calling the city their (sometime) home by 2024. The attraction is not just in London’s history, nightlife or convenient time zone – it is chiefly the country’s lax tax regime. As Pippa Malmgren, one-time economic adviser to George Bush, puts it: ‘The crackdown on tax havens in Switzerland has removed these old options for new capital. As a result, there has been a huge influx of global capital into the UK.’7
Famously, the best-off segment of the UHNWIs, numbering just eighty-five people worldwide, held almost half the wealth of the richest 300 by January 2013 – some $1.7 trillion dollars, which was the same as was held by the poorest half of the world’s population, or some 3.6 billion people. When Ricardo Fuentes, head of research at Oxfam, released the killer fact that eighty-five people now held the same amount of wealth as half of all humanity, the statistic went viral. Oxfam’s international website had more hits in one day than ever before. All around the world, many appear more interested in inequality now than they have ever been.8
Inequality worldwide is far greater than inequality within any single country – but in some countries internal inequality continues to grow rapidly. There is perhaps no country where this trend is more pronounced than in the United Kingdom, where the poorest continue to see their benefits and wages fall while the world’s superrich trickle in at the top. For every superrich individual at the very top, there are over 700,000 people who have now become poorer at the bottom, so that the wealth of the richest one hundred people in the UK now equates to that of the poorest 30 per cent of all UK households, and that ratio is worsening.9 From among those one hundred people, the five richest families now own more wealth between them than the poorest 20 per cent.10
While the wealth of the HNWIs has remained stable, the wealth of the UHNWIs has grown by an annual 10.9 per cent in recent years, and that of the 85 richest people on earth by a little more than that, tipping them into international pariah status by 2014 and ensuring that by March of that year just the 67 richest of them then held as much wealth as the poorest half of all humanity.11 The wealth of mid-tier millionaires has grown by ‘only’ 10.2 per cent a year recently, while the wealth of what analysts call the ‘millionaire next door’ – someone with less than $5 million – increased the least, by ‘only’ 9.3 per cent a year. All the rich are doing very nicely, but since 2011 the divisions within the richest have been widening.12
Governments worldwide are beginning to target the superrich as a potential source of revenue. In his autumn statement of 2013, the UK chancellor, George Osborne, announced that for the first time capital gains tax would apply to the property of non-residents in the UK. Even before that, in the year to 2012, the London auction houses Christie’s and Sotheby’s reported a 56.5 per cent increase in the value of old masters put up for sale.13 The very richest in Britain are now at something of a loss over where to put their money. But they are very good at hiding it.14
Note: Percentage growth rates will not match column totals due to rounding.
Source: Capgemini Lorenz Curve Analysis, 2013
Figure 4.1 People with over $US1 million spare by country, 2011–12
In the UK we have no real idea how much the truly wealthy own – just a series of estimates, none of which are reliable. What we do know is that, to get into the 1 per cent, defined in terms of income, you need a household income, as a couple, of about £160,000 – a little more if you have children, a little less if you are single. What we do not know is what the entry bar is to joining the 1 per cent in terms of wealth.15 The best estimate we have is the Capgemini and Royal Bank of Canada 2013 World Wealth Report, which suggests that roughly 1 per cent of the population of the UK has a million dollars’ worth of cash to spare – money not tied up in a primary residence or pension plan. But we do not know much about the less liquid assets of the wealthiest 1 per cent.
This segment of society has been described by Ken Roberts in his 2001 book on class as ‘the best organised and most class conscious of all the classes’16 – a statement which conceals the fact that this is also the class with the highest degree of inequality within it. What looks like class collusion may simply be the outcome of the thousands of independent but selfish actions of the very rich. They do not have to be organised to look organised.
The nearer you get to those at the top, the less organised they seem. Sit at high table next to the master of one of the richer Oxbridge colleges, and you may realise he is having trouble staying vertical due to the pre-dinner drinks; but to the masses of undergraduates below him, he looks as if he is in charge – which is all he needs to do in order to be retain his position. In the 1990s John Scott described the network of London clubs used by some of the 1 per cent.17 But I suspect Scott’s London clubs were more about drinking, and escaping neglected wives, than about maintaining upper-class solidarity.
What keeps those who rule in power is not just a common culture, but the much wider belief that there is no alternative. The members of the international ruling class are highly dysfunctional – think Nigella Lawson and Charles Saatchi multiplied many times. What makes them so powerful is that they can rule despite constant inebriation, divorces, narcissism and neuroses.

Verso/Leo Hollis
A club on Pall Mall: home to the elite for two centuries
Of course, members of the House of Lords with shared ‘business interests’ act together to get a corrupt healthcare bill through parliament. But when they do so, they are like drones in a beehive, they look as if they know what they are doing; but they are merely following their programming and behaving as expected. Occasionally we discover a Mont Pelerin Society or Bilderberg Group, and we think these are just the tip of the iceberg, and beneath the waters lies a vast conspiracy – but such explicit collusion is in fact the exception. The rich rule because their money rules; their own participation is relatively marginal. Receiving huge sums of money leads almost all people to behave in ways that a similar person would not behave if they were living in a more equal society.
Once a culture is established, it includes mechanisms for its own perpetuation. For example, women are better at passing exams at school than men. On average, girls reach all their developmental markers earlier than boys: from walking and talking to learning to write. Women also live longer. But patriarchy ensures that women cannot organise themselves to realise their potential. As a result, men continue to run the system as stupidly as ever. It is not that they are more able – it is almost as if the culture is in control, and changing the direction of culture is far harder than just winning hearts and minds.18
Today the UK Office for National Statistics (ONS) estimates that, to be in the top 10 per cent of households, you have to have total assets, including illiquid assets, of almost £1 million, while entry into the 1 per cent requires assets of £2.8 million. But the statisticians say little about how much wealth people have beyond that,19 and the cut-off point is highly unreliable. After the cut-off, things become murkier still (see Figure 4.2 – based on figures originally released by official bodies, though possibly in error). The ONS appears to have no idea how much wealth the 1 per cent hold. They know far more about the wealth of the other 99 per cent in society, even though it is tiny on a per capita basis in comparison.
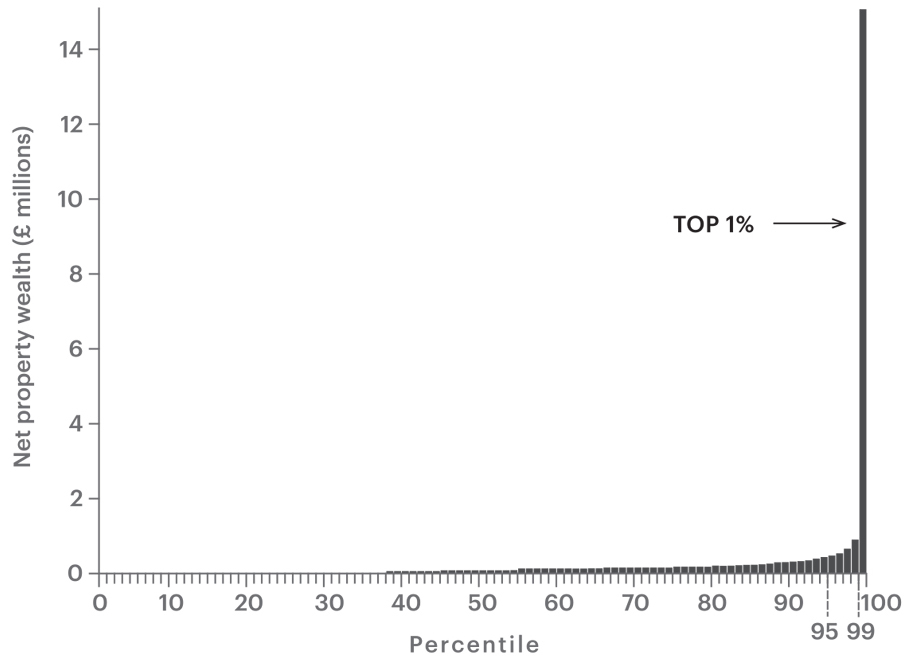
Source: George Monbiot and ONS, 2013
Figure 4.2 Property wealth in the UK: net positive equity by wealth percentile
I also wish you’d listen when your child asks you to look at the pirate hat they’ve made, instead of scrolling through your emails on your iPhone. I wish you’d get down and play the games with them instead of chatting to other parents. Because when you look back at the photos from your party, you won’t be in them. Instead, it will be me holding your child’s hand and unwrapping their gifts with them. You won’t remember my name; you won’t remember the party, either.
Children’s entertainer20
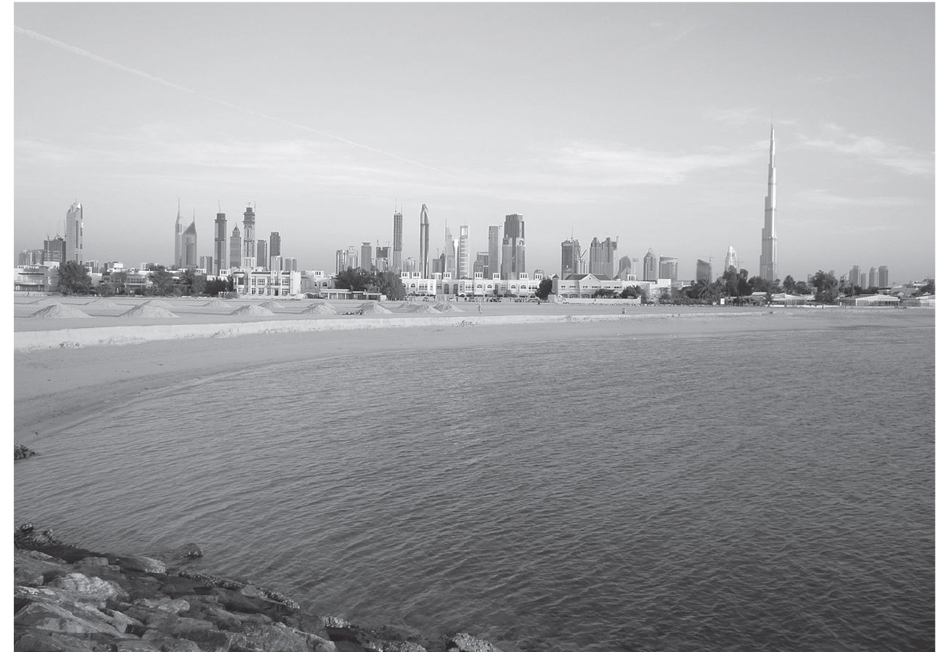
In Dubai a 2.4-kilometre-high, 400-storey vertical city in the sky is planned, with internal lifts carefully segregated so as to separate the servants and workers from the residents.21 The front and back stairs of a London town house used to have the same purpose. As Forbes magazine put it, before the crash: ‘If you want to know where the world’s hottest economies are … skip the GDP reports, employment statistics and consumer spending trends. All you need to do is answer one question: Where are the fastest elevators?’22
By contrast, in the US growing horizontal segregation has become normal, and causes severe commuting inefficiencies. In recent years, in twenty-seven of the thirty largest US cities, residential segregation by income has increased: rich areas have become richer, poor areas poorer. Simultaneously, neighbourhoods in many places have become more alike. Those with comparable incomes huddle together in ever more similar housing. Only a few of the largest cities – such as Boston, Chicago and Philadelphia – are left with any mixed neighbourhoods.23
When people do not mix, it is easier to believe that not everyone is equally human. How can they be the same if their monetary value is so different? One outcome of growing inequality is rising mistrust. Conspiracy theories proliferate among the poor that those in charge are deliberately seeking to keep them down because they do not see the poor as being of the same species.24 At the extreme, in the US, some 12 million citizens tell public pollsters that they ‘believe that shape-shifting reptilian people control our world by taking on human form and gaining political power to manipulate our societies’.25 These beliefs that the very rich are part of a conspiracy of control are also widely held in some of the poorest areas of the UK. Beliefs in the ‘illuminati’ or in a less sinister ‘club of the rich’ who just marry and socialise together and look down on the masses are commonplace in pubs and gyms in working-class neighbourhoods, and particularly among young men who have otherwise ‘been de-valued as useful members of society [and] find value for themselves locally’, developing a meaningful identity in the face of adversity.26 Inequality both creates and magnifies ignorance.
Theories of the inherent inferiority of the poor circulate among the elite. Often those theories are bolstered by an upbringing full of hints that privileged children are superior and born to lead. Consider how the world must seem through the eyes of a young scion of a wealthy family. As a boy, you attended a school in a suit and tie, maybe even a frock coat. You are aware that your ‘education’ cost an ‘awful lot’ – a fortune if you boarded. You might not know just how expensive it was by most people’s standards. How can you make sense of your situation other than by believing that you are somehow special, and that all this extra attention was in some way warranted? Your school might even help you firm up that belief by making you take an exam that only the truly gifted (they say) could pass.
To see how intricately wealth, power and education are linked consider one particular King’s Scholarship Examination Question, set by what is often labelled the most prestigious ‘public’ school in the UK, Eton College, in 2011:27
The year is 2040. There have been riots in the streets of London after Britain has run out of petrol because of an oil crisis in the Middle East. Protesters have attacked public buildings. Several policemen have died. Consequently, the Government has deployed the Army to curb the protests. After two days the protests have been stopped but twenty-five protesters have been killed by the Army. You are the Prime Minister. Write the script for a speech to be broadcast to the nation in which you explain why employing the Army against violent protesters was the only option available to you and one which was both necessary and moral.
Eton College has now removed the web link to that 2011 exam paper, but a commentator under the original story helpfully noted:
When you clicked through to look at the question you found a quote from Machiavelli’s The Prince and some 25 marks available. Five marks for summarising the quote, five marks for noting any reservations you might have about sending in the Army, and fifteen for putting this authoritarian policy into practice. So 80 per cent of the marks are for absorbing and applying an authoritarian philosophy, and 20 per cent are for critical thinking.
As this commenter said, ‘That’s training, not education.’28
It is not hard to train people to treat others badly, especially if you can persuade your young recruits not to consider others as fully human. As inequality rises, growing numbers of people turn a blind eye to the suffering of others, while they become increasingly concerned about themselves and how they are seen. That is why charity fundraising events involving the superrich are public spectacles, with the press often invited along.
In the same year that the Eton exam paper came to light, Westminster School was ridiculed for holding an auction for unpaid internships. These included a chance to work in the investment office of the private bank Coutts, or a week with the master jeweller Fabergé, or with retail communications agency Portas, or with a premier investment services advisory firm established by a man who has ‘more than 14 years experience in private banking and wealth management’.29 Parents bid huge sums of money so that their children could work unpaid; the connections they would gain were clearly seen as worthwhile.
Private banking is associated with the bulk of large-scale tax evasion. The world’s leading tax justice campaigners in 2012 reported: ‘Our analysis refocuses attention on the critical, often unsavoury role that global private banks play. A detailed analysis of the top 50 international private banks reveals that at the end of 2010 [they] collectively managed more than $12.1 trillion in cross-border invested assets from private clients, including … trusts and foundations.’30 The tax justice study found that, as a result of this private bank-aided tax evasion, nearly a third of all private financial wealth in the world is owned by just 0.001 per cent of the population – some 91,000 people. Almost all of the rest is owned by the next 0.14 per cent. Almost everything else, excluding the homes people live in, is owned by the global 1 per cent. Even if you include all residential property, the global 1 per cent hold half the wealth of the planet – some $110 trillion, or sixty-five times the wealth of the poorest half of humanity.31
So what do the very richest desire? Within the richest 1 per cent, the top 0.01 per cent have a series of goals. The Wealth Report 2012, a survey of HNWIs, found:
• 16 per cent already own a ski chalet, 12 per cent are interested in owning one;
• 40 per cent already own beachfront property, 23 per cent are interested;
• 20 per cent invest in sports teams, 16 per cent are interested;
• The US and UK are the most popular locations for a second home – Singapore is the fifth most popular;
• London and New York are the most important cities to the HNWI;
• 27 per cent believe ‘availability of luxury housing’ is a necessary attribute for a city to be ‘considered globally important’.32

Verso/Leo Hollis
Beachside paradise in Florida: second homes for the superrich
Of those six goals, four explicitly concern homes, or at least property. But to secure such goals requires some work and training. According to the New York Times, awaydays for the children of the extremely rich are now arranged that cover ‘topics as various as financial literacy, prenuptial agreements and managing family dynamics [and] are offered by large financial institutions like Citi Private Bank, business schools and organizations for wealthy families like the Family Office Exchange and the Institute for Private Investors’.33 These are events in which wealthy children can get together and feel comfortable with their wealth, and learn how to hold on to their family money – including protecting it from their spouses. Some top private banks now include psychologists as part of their private client banking package. Included in their advice is a suggestion that you meet with your parents at your country club, not their home (it is less emotive). You need spare assets of at least $50 million to gain such advice.34
It is worth noting that state security services are particularly active in the countries that the 1 per cent prefers. Singapore is notorious for its security apparatus, the United States has its US Patriot Act (the Uniting and Strengthening America by Providing Appropriate Tools Required to Intercept and Obstruct Terrorism Act), and the UK has more CCTV cameras per person than any other large state – the highest estimate currently being one for every eleven people in the country.35 The superrich want enhanced levels of security. Simultaneously, the children of the 1 per cent are becoming ever more dependent on their parents’ wealth. Family expectations reduce the freedom of the very rich and their mental security. They need to take out prenuptial agreements if they marry someone economically less well-off: honest relationships become impossible to maintain under conditions of great inequality. Within the 1 per cent, the use of trust funds to maintain the family wealth, rather than having to rely on salaries – and keeping much of this wealth secret – is common. This sort of extreme deviousness separates many of the 1 per cent from everyone else.
In the UK a scheme exempting privately owned artworks from inheritance and capital gains tax if they are open to public access has been described as ‘a racket’.36 Owners of stately homes are about to become, for the first time, eligible for lottery money to help them with repairs and upkeep, increasing the value of their property assets,37 providing there is ‘greater public access’ – which the public would presumably pay them for.38 This money for stately homes was announced at the same time as it was reported that the Building Schools for the Future programme would end. That programme had been hugely successful in improving the quality of state school buildings, and thus of public education.39 It is not that there is too little money to build schools, but, rather, that a choice must be made about where the money should go: state schools or stately homes.
The Coalition have been digging the moat around the citadel of good fortune as fast as they have been pulling up the ladder of opportunity … we cannot all be rich. Either the wealthy need to share what they’ve got, or the poor need to live with a lot less than they’ve been promised.
Theo Middleton, Squatters Action for Secure Homes, 201340
The wealthy have been getting much wealthier in recent years, and in the UK this is mostly to do with home ownership. During 2013, housing prices in London rose by over £50,000 for an average flat or house, bringing the cost of a typical London home up to £450,000. If this rate of change continues, the £0.5 million price barrier will be breached during 2014. Prices in London in early 2014 were rising more than twice as quickly as in the country as a whole.41 These are now prices that almost no one but the very affluent can afford.
House and flat prices in London have risen especially high and especially quickly not so much because members of the 1 per cent from overseas have been buying in recent years – although that has made a difference – but because extremely rich members of the 2 per cent of people who are landlords have been buying so quickly and so bullishly. The very richest of landlords will have bought the most – all of them members of the 1 per cent. Such purchasers buy in cash, using the rent of their existing tenants to purchase yet more homes to rent out. Across Britain as a whole, the average cost of a home in a city rose from 5.6 to 5.8 times the average salary between 2012 and 2013. In the most expensive city, Oxford, it rose from 9.8 times to 11.25 times – reaching over £340,000 – in that year alone,42 partly because landlords were buying up so many of the available homes, accelerating price rises and reducing open market supply.
In January 2014, the Financial Times released an analysis showing that, over the course of just the previous five years, the equity of mortgage holders in Britain had fallen by £169 billion, while that of landlords had risen by a massive £245 billion. The estate agent Savills and the Financial Times found that UK landlords’ total equity had more than doubled, from £384 billion a decade before to £818 billion at the time of publication (2014). The large fall in the combined equity of homeowners with mortgages reflected the fact that buyers were now borrowing more.43
In March 2014 the Financial Times published a letter explaining that there was a problem with the 1 per cent building luxury homes in the capital – since a very large proportion of the owners are non-domiciled, often living only part of the year in those homes:
If London’s current building capacity is focused on satisfying foreign buyers, then the supply challenge for the domestic market is made bleaker. Overseas demand flooding the London market pushes up land prices – which pushes up development costs, making domestic-focused sites less viable, and therefore less likely to happen. On top of the cyclical risks created by the housing market, foreign demand comes with foreign exchange risk – another source of volatility for a development market which ill needs it.44
When the Financial Times begins to publish warning after warning about the unfettered free market, it is time to listen.
The Financial Times was breaking ranks by revealing just how rich landlords were becoming, and how dangerous the glut of new overseas monies was. The Times will publish letters explaining that landlords have an average age of fifty-three, and ‘benefit from significant tax breaks, and cheap mortgages, due to the unearned wealth already accumulated from house-price inflation’,45 but as yet that newspaper will not denounce this state of affairs in its editorial pages. Other mainstream newspapers simply present rising prices as a bonanza, and suggest increasingly bizarre ways in which those who can afford neither to buy nor to rent can be housed in the capital. In October 2013, the Daily Mail reported that shipping containers were being stacked up in car parks in North London to be used as housing. Planning permission had been granted for two car parks to be used as temporary shipping-container housing estates. Approvingly, the Mail commented: ‘It is thought each of the homes could save taxpayers £25,000 each year by taking people off housing and other related benefits.’46
At the same time, the Daily Mail ignores the taxes that are not paid by many landlords, or by many of the world’s wealthiest individuals who live in London in very large homes. These include Russian oligarchs, Saudi royalty, and US financiers, who are among the global cohort estimated to be avoiding $32 trillion in taxation47 – enough to buy a billion shipping container homes!
Below the fabulously wealthy are the superrich who own the bulk of expensive UK property. The Sunday Times estimates that there are at least a thousand Russian millionaires who now live full-time in London. Most of them value their anonymity, but a few wish it to be known just how much London property they hold, much of it kept empty.48 And beneath the millionaires and multi-millionaires are those whose rental property affords them profits of £200,000 or more each year, who are borrowing even more to buy more, and who are hoping to join the new London Russian aristocracy through future growth of their assets – paid for by the rent of their tenants.
In 2013 a rich British man and his wife bought their seventh house in London – a four-storey, £1.35 million Georgian townhouse – for their twenty-seven-year-old son, Nicky, whose computer games firm and football agency were being dissolved five years after their launch. This would be just another story of the rich buying up more property than they can use if it were not that Nicky’s father was former prime minister Tony Blair.49 For those not as rich as the Blairs, but not poor, it is an uncomfortable fact that a whole generation is now growing up with a financial interest in their parents’ early death, so that they can inherit a deposit for a mortgage. The richest fifth in Britain, as homeowners, have benefited from lower mortgage rates, with their average housing costs falling from just over £500 a month in 2008 to just over £400 in 2011. Meanwhile, average housing costs have risen for every other quintile due to rising rents – generating more money that is paid to the best-off.50
Since 2011 the savings of the rich, especially of the 1 per cent richest among the best-off fifth, have continued to grow as most people with modest wealth have seen their savings deteriorate. The total amount being saved by the richest fifth in society grew each month between 2008 to 2011, rising by ‘an extra £400 million a month’51 at the end of that period. But for the majority in society, saving has become less and less possible. By December 2013, there had been the largest fall in average overall savings ever recorded over a five-year period,52 while the most affluent continued to squirrel money away. This has had a particularly disastrous impact on the bottom half of society. A whole generation is growing up asking where the money is, why they have to pay to study, and why there are so few good jobs – let alone homes they can afford.
The housing situation for people of average and modest means has deteriorated rapidly. The private landlords who have bought up so much council housing do not maintain it at the former standards – not unless it is in a very rich area. If tenants complain, a landlord is likely to carry out what the charity Shelter calls ‘retaliatory eviction’.53 Private landlords also fill housing less efficiently. A few years ago, the waiting list for social housing in Britain contained a few hundred thousand families. It now numbers 3 million people. In 2013 the number of millionaire homes in the UK increased by a third in just one year. Someone, somewhere (usually in London) now becomes a property millionaire every seven minutes. In the homes of multi-millionaire properties, an area the size of the average doormat is now estimated to be worth £3,500.
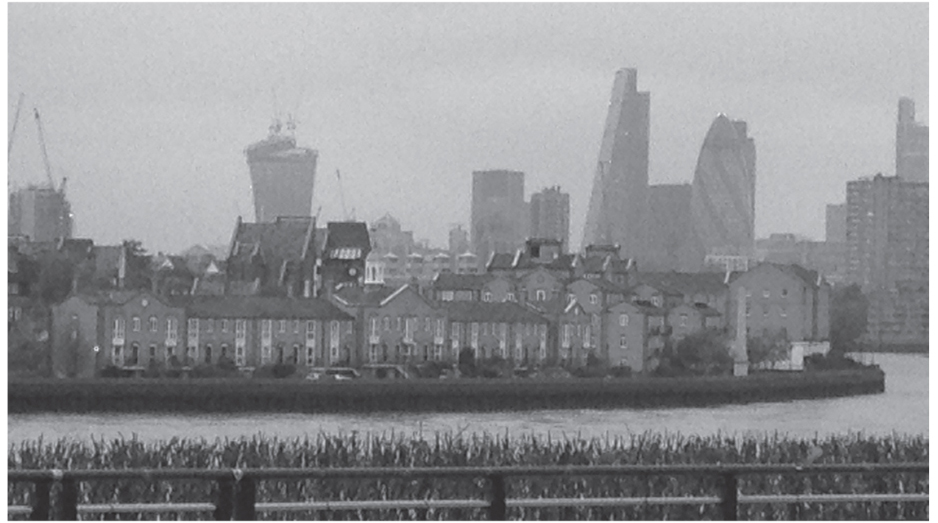
Verso/Leo Hollis
The polarising property market of London
Few who have not bought their own homes have any significant wealth, except what they might be saving for a deposit on a home. Even some who are buying their own homes find that they have no wealth. By summer 2013, it was estimated that ‘nearly 800,000 of those with a mortgage [were] in negative equity’.54 That number will grow rapidly if more people borrow huge amounts to buy homes in the near future, and if house prices fall when interest rates rise. Growing wealth inequality leads to an increasingly less efficient use of our existing housing stock, and rapidly increases housing prices as a result, because less efficient use reduces supply.55 This forces up rents, forcing even those on a living wage into effective poverty.
In a contradiction that is only apparent to those who see both sides of life in the city, the great concentration of wealth in London coexists with the highest concentrations of poverty in the country. London has the most people aged between forty-four and sixty-four who have at least £1 million of wealth: just over a fifth of that age group in the capital are paper millionaires. At the same time, just under a fifth of that group have almost no wealth at all. As a result, and as London Assembly member Darren Johnston explained to his constituents in September 2013, ‘investors, rather than occupiers, buy the homes, leaving most Londoners with little choice but a lifetime of insecure renting’.56
By the official definition, more than twice as many children in London live in poor households (40 per cent) than are poor nationally (20 per cent). London has the highest proportion of poor households to be found in any region of the UK, including Northern Ireland. The rather staid Office for National Statistics itself describes the situation in the capital as ‘hollowed out’, because so few families are now average in that city – far more are rich and far more are poor.57
Recently the Joseph Rowntree Foundation concluded: ‘The key driver of urban wage inequality or employment polarisation is affluence.’ The very rich are employing more people on very low pay to service them in various ways – to clean for them, to look after their children, to cook and chauffer for them – whether directly or by going out more often to eat in restaurants, use taxis, and so on. The Work Foundation researchers who conducted one study found that income inequality was highest in London but similar in Reading and Bracknell, Guildford and Aldershot, and Luton and Watford – and also, by one measure, in Manchester and Warrington, as well as Wigan.58
A small number of northern towns are included among the most unequal either because they contain rich enclaves, such as Didsbury in Manchester, or have outlier suburbs that are affluent, or are what the Liberal Democrat Lord Oakeshott referred to in 2012 as ‘the nicer parts of the north’.59 The term ‘urban’ is most often used by euphemising commentators to describe those parts of the north where more housing is unused – although the amount that is empty within the heart of London has also risen in recent years.60
How many homes are empty or underused? It is hard to obtain accurate statistics for England. In the whole of Scotland, there are 2.5 million dwellings, of which only 2.4 million are occupied. Of the empty 111,000, 66 per cent are simply vacant, while 34 per cent are officially listed as second homes. A further 950,000 occupied homes in Scotland contain only one adult.61 At the other extreme, in Kensington and Chelsea, the residential population fell between 2001 and 2011 as an increasing share of the most expensive property was held empty.
There is a huge problem with housing in the UK because people buy and hold on to housing as an investment. In doing this, they are copying (in very small measure) the property portfolios of the 1 per cent. Most people try as hard as they can to get a mortgage and to buy, because they think that doing so will make them safer in the long term. Renting, including even long-term-tenancy social housing, is now universally regarded as insecure. If the 1 per cent hold on to their property and work hard to prevent it being taxed, that has a great influence on the behaviour of the rest of us. We cannot see that only a tiny number of people – the 1 per cent – can really get rich at the expense of the rest: it is simply impossible for many of us to do what they do, because the rest of us don’t have enough for all of us to plunder.
Recent research by economists Andrew Oswald and David Blanchflower has shown that, when the rate of home-ownership rises, people end up with longer commutes to work. This is partly because they hold on to their home for longer even if they switch jobs. Unemployment also rises, as it becomes harder to move to where there is work, and it is harder for some new businesses to start because the necessity of moving becomes a bar to recruitment. In short, the owner-occupier housing market is bad for the labour market.62
Unfortunately the current private rental market is not necessarily good for family life. According to the Institute for Fiscal Studies, UK government cuts and employment trends mean that, by 2020, a quarter of all children (3.4 million) will be living in poverty. The rise in poverty now expected will reverse all of the reductions that took place under Labour between 2000 and 2010. The Coalition government’s official target is that less than a tenth – about 1.3 million – should be poor by that date.63 Sometimes targets are meaningless. The current government’s actions, typified by George Osborne’s 2014 budget of give-aways for the rich, are designed to increase poverty among the majority; and as poverty rises more families will have to rent. Osborne’s budget was explicitly targeted at what he called the ‘makers, doers and savers’. He changed the rules on pension annuities so that the few with large private pension pots could use the money instead to buy property to give them extra retirement income – presumably properties for the ‘strivers and shirkers’ to rent and, if lucky, live in.64
Private renting is not necessarily good for households with children. Today almost a quarter of all households in England with children live in rented homes (see Figure 4.3). It was half that proportion just ten years ago. Only a third of these households have lived in the same home for three years. Children are now far more often moved between schools and friends every year. Often they have almost no friends as a result. They might not settle in their new school, and the consequences are disjointed teaching, a greater risk of illness and lower rates of attendance.65
When social policy is determined by members of the 1 per cent, their lack of knowledge can result in perverse outcomes. Those who have the least – those with vulnerabilities such as unemployment, poor housing, a lack of qualifications, mental or physical illness and disability, low income and material deprivation – are often punished the most. The most recent changes in benefit rules have had terrible effects. As the Children’s Society and the National Society for the Prevention of Cruelty to Children explained in 2012, ‘Overall, the negative impact is perversely greater for families with more vulnerabilities. Families with four or more vulnerabilities lose around 8 per cent of their net income from the changes, compared to less than 5 per cent for families with no vulnerabilities’66 (see Figure 4.4). Those families with the most vulnerabilities are almost always renting, and often, as they find it harder and harder to get through life, they are paying ever more of what little income and benefits they receive to a landlord.
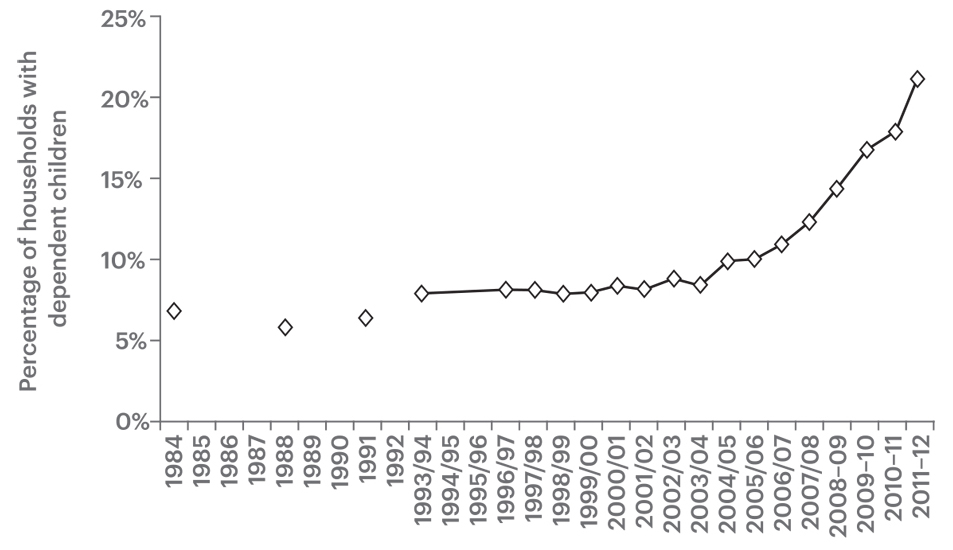
Source: Social Mobility and Child Poverty Commission, 2013
Figure 4.3 Households with children in private renting, percentage in England 1984–2012
The most vulnerable families in Britain – those with five or more vulnerabilities – stand to lose £3,000 a year in income by 2015, although subsequent events mean it will be more in real terms.67 It is also projected that, because of the cuts being driven by the interests of the 1 per cent, there will be many more families falling into the vulnerable group in the near future. Some 100,000 more workless families will be created as the ‘wealth creators’ fail to be ‘job creators’.68 If you are trying to imagine how the proportion of children living in homes owned by a landlord can rise even further, consider this trend.

Note: The most vulnerable families score five or more vulnerabilities.
Source: Howard Reed, 2012
Figure 4.4 Tax and Benefit changes by vulnerability in the UK, impact, 2010 to 2015
Just as key members of the richest 1 per cent, when in power, work so hard to cut benefits for the poorest groups, their supporters also work hard to influence public opinion by suggesting that these are benefits we simply cannot afford. They have recently been highly successful, especially in capping housing benefit and other benefits related to housing, such as grants to refit housing for wheelchair use. Support for public spending on the disabled fell rapidly with the onset of the crash, as the Conservatives blamed Labour’s spending for the rise in public debt, rather than the bank bail-out costs. A large section of the press feasted on ‘benefit scroungers’, but was strangely quiet about tax avoidance.
In 1998, 74 per cent of people in Britain wanted to see more spending on benefits for disabled people. But as the Tory rhetoric of ‘high-spending Labour’ strengthened, this proportion fell to 63 per cent in 2008, and then to only 53 per cent by 2011. This fundamental long-term change in attitudes towards welfare and benefit recipients reflects the success of a long-term campaign of vilification against welfare recipients, including those traditionally seen as the most ‘deserving’ of the poor.69 Today it is easy for right-wing councillors to suggest that there should be no council housing in inner London boroughs, that only the rich ‘deserve’ to live there, and that the poor should travel in early in the morning from far away to service the rich, clean the streets, work as security guards and staff the shops.

License under Creative Commons
Abandoned houses: the decline of social housing
Often it is through housing, and the taxation related to it, that the poorest are punished. From April 2013, cuts to council tax benefit were introduced of about £500 million, or 10 per cent of the total bill. The result was that some 156,563 vulnerable people were summoned to court in the following six months for failing to pay their new, raised level of council tax. Many simply did not understand what was happening to them. Only a minority of councils have so far reported how many of their residents they have taken to court. It is estimated that, in all of the 326 English councils, up to half a million people may already have been summoned by early autumn 2013, but the precise figures are not yet available. The official government response to this news was simply to claim that the survey it was based on was ‘shoddy’.70
As poverty rises with inequality, public mental health also deteriorates. A commentator in the Economist put it succinctly: to afford to live in central London today, you have to be either on a six-figure salary or on benefits. The middle class, along with the poor, are being cleansed from the centre.71 The half-million court summonses – a disproportionate number of them in the capital – resulting from caps to housing benefit mean that fewer of those on benefits can afford to live there. As housing becomes harder to secure and hold on to, the number of cases of depression climbs. It is estimated that 25,000 more mothers will suffer from mental illness by 2015 than in 2010, when an additional 100,000 families will be forced to live on less than 60 per cent of median income; but median income is falling more than expected, so that estimate might be reduced despite none of those families being any better off.72
Simultaneously, if current trends continue to 2015, some 40,000 more UK families will suffer overcrowding and more will become more economically vulnerable,73 despite the existence of sufficient housing were it better distributed. We do not have enough housing to leave much of it empty or underused in the centre of the capital, and it is almost always owner-occupied housing that is in that unused state, rising in value as an investment month by month. The 2011 census revealed that there were more rooms per person than ever before in British history. Britain is a rich country, but it is set to share out what it has ever more unfairly, ensuring that the 1 per cent get even richer.74 The top 10 per cent of people in Britain have average net wealth of around £1 million, while the poorest tenth have just £13,000 on average, most of which is the value of a few household goods and a second-hand car (see Figure 4.5).75
When the economic situation of all families is considered, the possibility of rising solidarity among the 99 per cent is evident. It is clear that the poorest tenth still suffer the most harm from benefit cuts; but proportionately the rest of the 99 per cent are very similarly affected by spending cuts, by the rise in VAT and National Insurance changes – and, at the top end, loss of child benefit. The top 1 per cent are the least affected by the loss of child benefit (many do not bother to claim it), and in 2012 received a tax reduction from 50 per cent to 45 per cent on incomes over £150,000.76 Figure 4.5 illustrates who has gained and lost most from housing since 2009 and 2004.

Source: Based on research carried out by Savills and reported by Kate Allen in the Financial Times, 2014 – K. Allen, ‘Home buyers left behind in Britain’s two-speed housing market’, 18 January.
Figure 4.5 Gains and losses in the UK housing market, 2004/2009 to 2014
Bostridge expresses his views not as a war cry but with gentle passion. ‘There’s huge anxiety in middle-class London’, he continues. ‘I don’t see how my children are going to be able to afford to live here. Four or five generations of my family have lived in London. I love London. Gosh …’ Smiling sheepishly, Bostridge realises he has sounded off more than he might have wished. We order coffee and change the subject.
Ian Bostridge, quoted in the Financial Times, November 201377
We too often order coffee and change the subject. The subject is excruciatingly embarrassing because it is about not having enough money, and concerns some of the best-off among the 99 per cent as well as the poorest. It is shaming for rich and poor alike. In the past, anger about that shame fuelled the drive for greater equality, led by people from all walks of life who were shocked by what the very richest were then getting away with.
In 1908 Edward George Villiers Stanley, 17th Earl of Derby, enjoyed an income that was 1,000 times the national average. The main source of his income was rent on homes. By the time the 17th Earl died, in 1948, most of that income and wealth had been taxed away.78 The growing equality between 1918 and 1978 meant that many of those homes are now owned by the people who would, in the past, have been his tenants. Since the 1970s, however, wealth inequalities have grown again. This partly explains why more people are now renting. A majority of young adults simply cannot afford to save the deposit needed to start to buy their home, and their families are not wealthy enough to lend or give them even small amounts of money.
Some of the world’s leading economists place rising inheritance as the third-most-important factor driving up income inequality, after lower taxes on the rich and the recent lowering of the collective bargaining power of unions.79 The Earl of Derby did not give up his riches happily. He was forced to by the collaboration of many in the elite fearful that revolution, or at the very least frequent riots, might be sparked by the impoverishment of the masses. Today, the elite again fears a growing social and political unrest resulting from escalating wealth and income inequality. In 2012 the head of the Institute of International Finance, representing the world’s banks, told the BBC: ‘if this inequality increases in income distribution or wealth distribution we may have a social time bomb ticking and no one wants to have that.’80 His definition of ‘no one’ was perhaps narrow, as it is hard to see what the bottom half of society has to lose now they have so few assets and so much debt.

Verso/Leo Hollis
One Nation under CCTV: the end of trust according to Banksy
Fear among the superrich elite is palpable. They buy cars that weigh several tonnes because of the need to be both bullet- and bomb-proof.81 Fear of kidnap is growing rapidly among the very rich in the United States, because the richest obviously have the means to pay good ransoms. In the US, between 2007 and 2010, the share of wealth of the poorest 40 per cent of citizens fell from just 0.2 per cent of all US household assets to a total of −0.9 per cent, or −1.6 per cent if their home ownership was added.82 Calling that debt ‘ownership’ is a particularly sick joke.
While four out of ten Americans are facing absolute immiseration, debt and destitution, one in every 4,000 has never been richer; nevertheless, despite this gulf, some of the very rich appear to share the same dreams and aspirations as the poor. They just realise their dreams differently. Top executives in the US fly their families to places like Disneyland at their company’s expense. One reason they give is that this apparently gives them more time to work. Another excuse for such expense-fraud is that they have to fly their families using their company jet for security reasons: the family is at risk of hijack. Of course, the more they pay themselves, and the less they pay others, the greater that risk becomes.83
Not all the very rich share similar dreams to the rest – too much money can eventually warp one’s aspirations. In late 2013 a report circulated of a ‘luxury shantytown where rich can pretend to be poor’. As Professor Mathew Flinders of the University of Sheffield described it, this was the zenith of bad taste. A fake South African township had been built with the explicit intention of allowing the rich ‘to experience the grinding life of the poor’.84 He went on to explain that the delights apparently included an unlicensed bar, a ‘long-drop’ toilet, and shabby shacks complete with rusty corrugated-iron walls and roofs. One night in a fake shanty-town shack costs the same as an average month’s wage in South Africa. But why do rich American tourists fly all the way to Africa to experience extreme poverty? They could just as easily find it at home.
On average, the few homes that the poorest 40 per cent of Americans own are worth less than nothing, due to their mortgage debt. In the UK, wealth inequality is, as yet, nowhere near this level, and fear of kidnap is much less; but as UK wealth inequality rapidly increases, we need to look to the US to see where we are heading. By 2012 almost 50 per cent of the UK population were no longer satisfied with their personal financial situation, and less than a fifth expressed high satisfaction (Figure 4.6).
What would make the rich safer and more secure is being less wealthy. Inheritance tax was low a century ago. It was introduced by a parliament made up of the rich to protect their riches, and the riches of their nation. Inheritance taxes had been brought in mainly to help repay government war debts. Most wars are started by people in the 1 per cent. The First World War began as an argument within an aristocracy and European royal family that simply could not imagine its consequences. In 1894 Death Duties had a maximum rate of 8 per cent. In 1914 they became Estate Duty – with a maximum rate of 20 per cent, rising to 40 per cent in 1939 and to 80 per cent in 1949. It was only in 1945 that the first government not consisting mostly of rich men gained power in the UK. Death Duties became Capital Transfer Tax, with a maximum rate of 75 per cent in 1975, falling to 60 per cent in 1984. It was renamed Inheritance Tax after 1985, and reduced again to achieve a top rate of 40 per cent in 1988, where it still stands. Many rich families avoid paying even this by establishing trust funds to ‘shelter’ their wealth from redistribution.

Source: Opinions Survey, Office for National Statistics, 2012
Figure 4.6 Adults in Britain satisfaction with their financial situation 2012
The 1970s – the era of maximum redistribution – are now often pilloried. However, the 1970s were the best decade in which to be normal, not a bad decade in which to be poor, but a terrible decade in which to be rich. Inflation ate away at wealth. No wonder there is now an attempt to rewrite history and describe those times as terrible, when for most they were so good.85 The rewriting of history has worked, and the media today presents a persistently gloomy assessment of the 1970s, as if the long, hot summer of 1976 never occurred. Wealth taxes were reduced after the 1970s because the rich gained increasing control over the levers of power and over political parties, and increased their influence by paying lobbyists to represent their interests, while often pretending to be representing the interests of ‘business’ or ‘industry’. In the US and the UK the rich spent an ever greater share of their money to protect the rest of it. As a result, their assets ballooned in value while most people’s share of wealth began a gradual decline.
In the 1970s the average politician represented the interests of the median voter. Researchers have shown that political representation has moved from representing the median voter to representing mainly the views of the 1 per cent. Centre-right parties perform this task, while other parties promote policies that serve the interests of those not that far below the elite. The researchers conclude: ‘in spite of these correlations, we are not able to explain the circumstances that brought developed societies to the low democratic standards that they are suffering.’86 Others are less circumspect. As the comedian Russell Brand put it in May 2013, when it comes to the UK Houses of Parliament, ‘The whole joint is a deeply encoded temple of hegemonic power.’87 In other words, the UK parliament’s main function today is not to represent the people, but to preserve the power of a few. But neither Brand nor rigorous social scientists can explain how it got to be that way, and why the 1 per cent did not gain a similar degree of control over the political process in other affluent nations. By gaining so much control by the early 1980s and then changing financial regulation in their favour, the 1 per cent sowed the seeds of future instability, massive precariousness, and eventually the financial crash of 2008.
During the 1980s, income tax was reduced substantially in the US, and the UK followed suit. The increases in wealth and income inequality that followed can be closely linked to what caused the crash of 2008. In Ireland, where the crash was devastating, the richest 1 per cent had seen their share of national income double between 1995 and 2000. No wonder the Irish in general began to behave so recklessly. By 2010, researchers in Ireland had linked the recent rise in inequality there to the 2008 financial crisis.88 In 2013 a wealth tax on the 1 per cent was being proposed, to be levied on all those living in Ireland with assets in excess of €1 million. By 2014 that measure had not been implemented but the Irish tax authorities were receiving 1,500 returns every day that spring for people registering to pay the new Local Property Tax,89 at the same time the tax rate on interest received from savings was raised from 33 per cent to 41 per cent on 1 January. Capital Gains Tax had been increased to 33 per cent in 2012, and a domicile levy of €200,000 was introduced on anyone with property worth more than €5 million.90
The original suggestion in Ireland was that the 1 per cent be taxed annually at a rate equal to 0.6 per cent of their wealth. Currently most tax in rich countries is levied on income or expenditure. Less than 1 per cent is levied directly on wealth across the OECD, although tax on the interest accrued from wealth is a minor current wealth tax.91 During 2013 a Europe-wide wealth tax was proposed.92 In 2014 the German government suggested that (debtor) countries such as Ireland should impose it more firmly.93 In 1990 half of all OECD countries had a net wealth tax, but that had declined by 2000 to one-third. Since then the number has fallen further, with Spain, Sweden, Finland, Iceland and Luxembourg all abandoning their wealth taxes after 2006. But Spain, Ireland and Iceland are reintroducing wealth taxes to cope with their financial emergencies.94 The most effective wealth taxes are on fixed assets. In Iceland the disposable income of the 1 per cent collapsed from 20 per cent of all income to 10 per cent in just one year, as a result of measures taken to deal with the financial crisis; in Spain the 1 per cent take less than 10 per cent of annual income, and their share has fallen in the latest four years recorded.95 It is possible to tax the wealth of the richest successfully.
In the UK the fixed assets of the rich are mostly in housing, especially in the form of rented property. In 2013 the Financial Times explained how the practice of subsidising the rich to allow them to become landlords had got completely out of control: ‘It has driven up prices for the very smaller [sic], cheaper homes first-timers are after. Still more damaging is its effect in tilting the rental sector towards amateur landlords and short-term lettings that leave those who need larger properties and longer-term stability with nowhere to go. The practice thus damages the British housing market three times over.’96
The rich who buy to rent can get a tax rebate on the interest paid on any mortgage on those properties, and offset the costs of maintaining the property against tax. They also benefit from tax relief on insurance and other expenses. An owner-occupier has none of these advantages. In other words, those buying property as an investment are subsidised by government, making costs more affordable to them than to poorer buyers just wanting a home of their own.
It is not easy to study the very richest – the multi-millionaires; but in 2012 Skandia, an international wealth-management business, managed to survey 1,503 of their clients with net disposable assets (excluding their main property of residence) of at least £1 million. Of these, 436 lived in the UK, 94 per cent of whom were British. Despite their wealth, 21 per cent said they were not wealthier than their parents, and 31 per cent said they had become millionaires before the age of thirty. A third had not been to university. Of those who had started their own businesses, the majority had done so before they were twenty-five – mostly with help from their parents.97 The rich rarely become so through their own efforts – and it is partly because it is not their work that has made them rich that many so carefully orchestrate the defence of their wealth – those who stay rich usually work hard in at least one way: to defend their riches.
At the suggestion of an annual mansion tax – say, on properties worth over £2 million – uproar results. The rich suggest that they simply do not have the money, or that they might have to pay someone to damage their home to reduce it in value, or, almost amusingly, that they will no longer be able to open their home to public view. One letter to the Telegraph began: ‘SIR – I live in a family house that is open to the public, but, like many people in that position, I am asset-rich but cash-poor.’98 Perhaps they should take in lodgers? When you hear stories like this you need to consider what will occur if the UK and other countries in Europe do not increase the taxation of wealth. If countries allow wealth inequality to remain high, or even to increase, they will eventually become as unequal as the US.
When graphics exposing the superrich began to spread across the internet at the end of the last decade, they often had to rely on data from just before the 2008 crash. One prepared in 2011 shows that a few years earlier the top 1 per cent had more than a third of all wealth in the US, and the bottom 90 per cent barely a quarter. Figure 4.7 reproduces the same data. The authors of the original graphic noted that the bottom 60 per cent of Americans had 65 per cent of their net worth tied up in their homes. The top 1 per cent, in contrast, had just 10 per cent of their wealth locked up in the bricks and mortar of their property. Consequently: ‘The housing crisis has no doubt further swelled the share of total net worth held by the super-rich.’99 Taxing the rich through their property holdings alone may not be enough.

Figure 4.7 Wealth in the USA: it’s the Inequality, Stupid
By 2012 it had become apparent that these graphics, publicised widely in the US during 2011, were badly out of date. Using data for 2010, Edward Nathan Wolff of the University of New York showed that the bottom 40 per cent of US households were now usually in debt, with their debts averaging $14,800 non-home wealth per household; in contrast the middle 20 per cent had wealth averaging only $12,200 per household (a quarter less than in 1983); the next 20 per cent had $100,700 per household; and the top 20 per cent $1.7 million each on average (almost double the figure for 1983 in real terms). If Figure 4.7 were redrawn using these numbers, the bottom half of Americans would all be drowning in the Atlantic when it comes to depicting their negligible wealth holdings no matter how they were measured.100
Britain in the twenty-first century is a deeply divided nation. Whilst a handful of people at the top have never had it so good, millions of families are struggling to make ends meet. Growing numbers of Britons are turning to charity-run foodbanks, yet at the same time the highest earners in the UK have had the biggest tax cuts of any country in the world. And whilst low-paid workers are seeing their wages stagnate, the super-rich are seeing their pay and bonuses spiral up.
Oxfam, 2014101
In 2012 it was revealed that the top tenth of people in Britain by wealth were almost 500 times richer than the bottom tenth. But those riches were not shared equally within the top tenth – the top 1 per cent had the lion’s share.102 That share of wealth now appears to be growing as the rest of the best-off 10 per cent see cuts to their average take-home income, meaning that the richest 1 per cent above that group are rapidly moving away from the rest of the ‘top tenth’. The last time these inequalities reached such a peak in the UK was over a (long) lifetime ago. When inequality is at its highest, it can feel as if there is nothing that can be done to bring it down – but sooner or later it is always reduced.
Today it can appear that there is a new aristocracy, especially in the US. Rather than profiting from the land around their stately homes, or the coal under that land, or the steel mills they had monopoly control over – like the old UK aristocracy or the US robber-barons (‘industrialists’) – the new aristocracy characteristically has other ‘investments’, or a share in some form of copyright that they bought or inherited – for example, shares in the drug patents of pharmaceutical firms: ‘Many keep their fortunes by simply avoiding paying taxes, using loopholes created by legislators who are re-elected with that same money they help to evade. In reality, most wealth in the world is the product of inequality and it stays in the same hands thanks to the systems that reinforce that inequality.’103 Never before, however, has so much attention been focused on the tax-evading and other illegal behaviour of those at the top. Increasingly, suggestions are being made as to how the rich might be better controlled.104
Wealth taxes in rich countries have been changing in recent years. The target of taxation has moved away from inheritance, away from taxing the dead. Inheritance tax is too easy to avoid when the rich transfer a large amount of their wealth while they are alive. Thus, taxation of the beneficiaries of gifts in general, and other forms of capital gains has risen, and attention has begun to focus on the potential for land taxes.105 The taxation of other forms of property, such as pharmaceutical patents, also needs urgent attention. Any form of wealth-hoarding that harms the well-being of others is now seen as a very legitimate source of public concern.
Pudelek
Luxembourg, tax haven and home to Amazon.com
There are many good signs that the times are changing, but also some indicators that a fightback has already begun. In 2013 one ‘wealth management firm’ reported that it had ‘established an internal university to train our advisors on recent tax, legal, financial, and regulatory innovations’106 – implicitly signalling an intention to avoid taxation. Big landowners, including the richest of farmers, own the most expensive land. This group is specially protected by the Coalition government. Just as the UK government went to the European Court to try to protect the incomes of bankers from EU legislation capping banking bonuses, it has also opposed limiting the amount of subsidy any farm can receive from Europe to €300,000 a year.107 Cameron’s government does not want the richest farmers to have their annual incomes capped; it wants to ensure they receive enough money from Europe as income to remain part of the 1 per cent. Of course, the richest farmers and landowners say they need this subsidy just to scrape by.
The distribution of ownership of commercial real estate, of land, and of all property that is not its owner’s main home is almost totally skewed towards the very rich. We are often told that ‘pension funds’ control much of our wealth; but most people do not have private pensions, and the vast majority of the money held in such funds will benefit just a very few rich pensioners in the future. The richest fifth of all households hold the smallest share of their wealth in the form of their main residence – just 50 per cent for the richest fifth of Europeans – whereas almost 30 per cent of their wealth is held as other real estate, leaving 20 per cent in other forms such as stocks, shares and gold.108 As noted above, in the US the richest hold an even lower share of their vast wealth in the form of their main residence.
The current ‘quantitative easing’ policies of central banks have had the effect of making the rich richer. The Financial Times, quoting the chief executive of the finance and insurance firm Legal and General, has described the policy as ‘designed by the rich for the rich’. Even the Financial Times has now insisted that enough is enough.109 Quantitative easing has been described as printing money to prevent prices falling when wages fall and the economy slumps. However, if it were that simple then the money should at least have been evenly distributed among the population. A progressive government would have given more to those who had least – especially since all of the money would then have been spent, rather than hoarded, and might have then boosted demand (see the illustration on the previous page).

Priced out of London: wealth, prices, rent, housing and Occupy, 2013
What quantitative easing has actually entailed is the buying back of government bonds or other assets using government money created out of thin air. Financial institutions and individuals normally buy government bonds and wait to get their money back, plus interest, after a fixed period, but the bonds can be sold on. As a result of all the extra buying, the value of the bonds rises, but the returns do not rise, so they cease to be a good investment. The result is that bond-holders sell the bonds back to the government, and end up with more cash in hand. The hope was that this money will stimulate the economy by making loans to businesses more easily available. This is not what happened.
The rich started investing more in private shares, prime housing, art, wine and cars. The values of the most expensive of these items increased over the ten years to 2013 by over five times in real terms (at 17.5 per cent a year above inflation). This compares to a roughly three-fold increase in the price of gold. Quantitative easing has, in the short term, allowed the very rich to get much richer simply by owning assets that rise in value as the not-quite-so-rich stop buying bonds. More of the 1 per cent have then spent their money on luxury collectables.110 Imaginary money has created imaginary extra value in luxury goods.
The Bank of England itself has noted that Britain’s richest 5 per cent own almost half of all the assets that have increased most in value due to quantitative easing.111 Beneath them, the not-quite-so-rich traditional savers have seen the real value of their savings decline. These factors have combined to push the 99 per cent closer together in the UK. This appears to also be true globally, but it is very hard to prove because household surveys are very bad at measuring the wealth and consumption of the very wealthy. As Kevin Watkins, the newly appointed director of the UK’s Overseas Development Institute, recently explained: ‘The top 5 per cent in the global wealth distribution have enjoyed a windfall: collectively, they have captured 44 per cent of the increase in world income since the late 1990s.’112 And among this top twentieth, it is the richest of all who have most recently – within most of the world’s children’s lifetimes – taken the most.
The current era of opulence among the very affluent is unprecedented. Even in the 1920s and 1930s the superrich faced constraints. They might have had the first-class cabins on the Titanic, but they sailed on the same ship as everyone else. Today chartered planes can fly from private airports, and the rich can avoid the queues, the traffic and the noise. Transatlantic flights must use big planes and big airports – and that means queuing, even for the rich. But soon it is planned that, the richer you are, the faster you will be able to move through key airports such as London’s Heathrow. There will be shorter queues for the 1 per cent. The UK Border Agency said in 2012 that it soon wished ‘to offer fast-track passport lanes to speed up wait for passengers of “high value” to the airlines or British economy’.113 Soon there will be no waiting before you board your plane to cross the oceans, turning left into the first-class cabin. Soon the very rich will know even less about the lives of the rest. But the rest are learning more and more about them, and the harm that comes from their current extremely expensive existence.