Appendix 1.
Physical Activity Guidelines for Americans
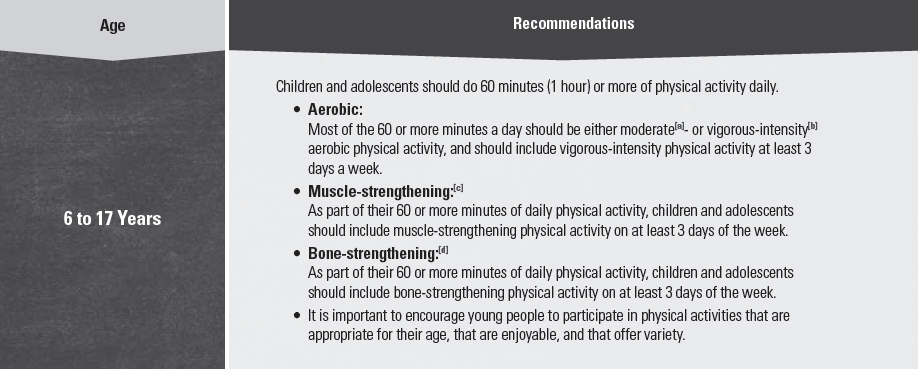
In addition to consuming a healthy eating pattern, regular physical activity is one of the most important things Americans can do to improve their health. The Physical Activity Guidelines for Americans,[1] released by the U.S. Department of Health and Human Services, provides a comprehensive set of recommendations for Americans on the amounts and types of physical activity needed each day. Adults need at least 150 minutes of moderate-intensity physical activity and should perform muscle-strengthening exercises on 2 or more days each week. Youth ages 6 to 17 years need at least 60 minutes of physical activity per day, including aerobic, muscle-strengthening, and bone-strengthening activities (see Table A1-1 for additional details). Just as individuals can achieve a healthy eating pattern in a variety of ways that meet their personal and cultural preferences, they can engage in regular physical activity in a variety of ways throughout the day and by choosing activities they enjoy. Table A1-2 provides a list of Federal resources, including handouts, online assessments, trackers, and interactive websites. These can be used to help motivate consumer audiences to make healthy physical activity choices.
Table A1-1.
Physical Activity Guidelines for Americans Recommendations
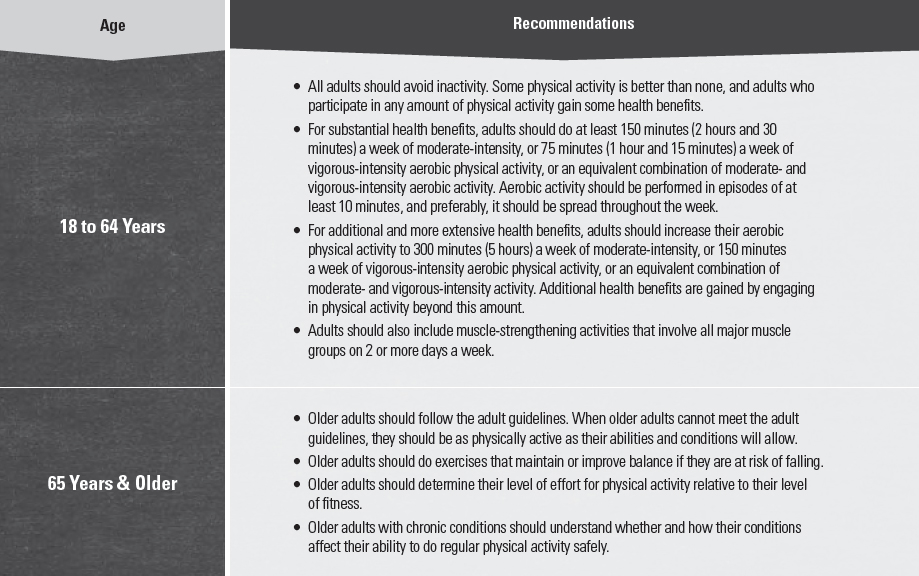
[a] Moderate-intensity physical activity: Aerobic activity that increases a person’s heart rate and breathing to some extent. On a scale relative to a person’s capacity, moderate-intensity activity is usually a 5 or 6 on a 0 to 10 scale. Brisk walking, dancing, swimming, or bicycling on a level terrain are examples.
[b] Vigorous-intensity physical activity: Aerobic activity that greatly increases a person’s heart rate and breathing. On a scale relative to a person’s capacity, vigorous-intensity activity is usually a 7 or 8 on a 0 to 10 scale. Jogging, singles tennis, swimming continuous laps, or bicycling uphill are examples.
[c] Muscle-strengthening activity: Physical activity, including exercise that increases skeletal muscle strength, power, endurance, and mass. It includes strength training, resistance training, and muscular strength and endurance exercises.
[d] Bone-strengthening activity: Physical activity that produces an impact or tension force on bones, which promotes bone growth and strength. Running, jumping rope, and lifting weights are examples.
SOURCE: Adapted from U.S. Department of Health and Human Services. 2008 Physical Activity Guidelines for Americans. Washington (DC): U.S. Department of Health and Human Services; 2008. Available at: http://www.health.gov/paguidelines. Accessed August 6, 2015.
Table A1-2.
Federal Physical Activity Resources

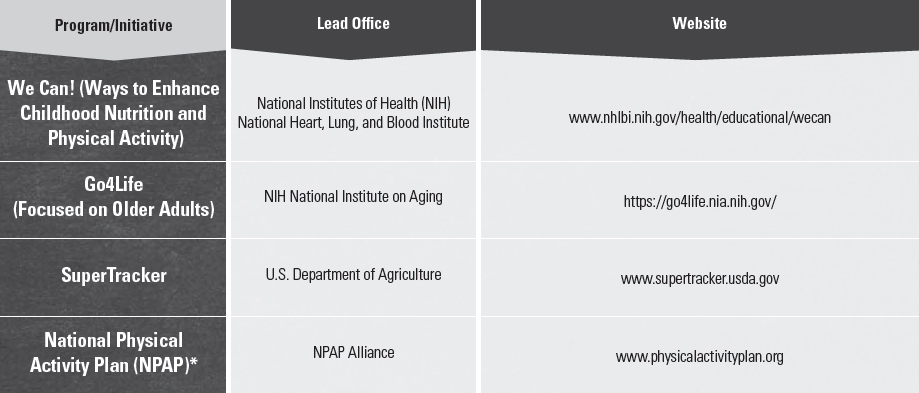
* The National Physical Activity Plan is not a product of the Federal Government. However, a number of Federal officers were involved in the development of the Plan.
[1] U.S. Department of Health and Human Services. 2008 Physical Activity Guidelines for Americans. Washington (DC): U.S. Department of Health and Human Services; 2008. ODPHP Publication No. U0036. Available at: http://www.health.gov/paguidelines. Accessed August 6, 2015.
Appendix 2.
Estimated Calorie Needs per Day, by Age, Sex, & Physical Activity Level
The total number of calories a person needs each day varies depending on a number of factors, including the person’s age, sex, height, weight, and level of physical activity. In addition, a need to lose, maintain, or gain weight and other factors affect how many calories should be consumed. Estimated amounts of calories needed to maintain calorie balance for various age and sex groups at three different levels of physical activity are provided in Table A2-1. These estimates are based on the Estimated Energy Requirements (EER) equations, using reference heights (average) and reference weights (healthy) for each age-sex group. For children and adolescents, reference height and weight vary. For adults, the reference man is 5 feet 10 inches tall and weighs 154 pounds. The reference woman is 5 feet 4 inches tall and weighs 126 pounds.
Estimates range from 1,600 to 2,400 calories per day for adult women and 2,000 to 3,000 calories per day for adult men. Within each age and sex category, the low end of the range is for sedentary individuals; the high end of the range is for active individuals. Due to reductions in basal metabolic rate that occur with aging, calorie needs generally decrease for adults as they age. Estimated needs for young children range from 1,000 to 2,000 calories per day, and the range for older children and adolescents varies substantially from 1,400 to 3,200 calories per day, with boys generally having higher calorie needs than girls. These are only estimates, and approximations of individual calorie needs can be aided with online tools such as those available at www.supertracker.usda.gov.
Table A2-1.
Estimated Calorie Needs per Day, by Age, Sex, & Physical Activity Level
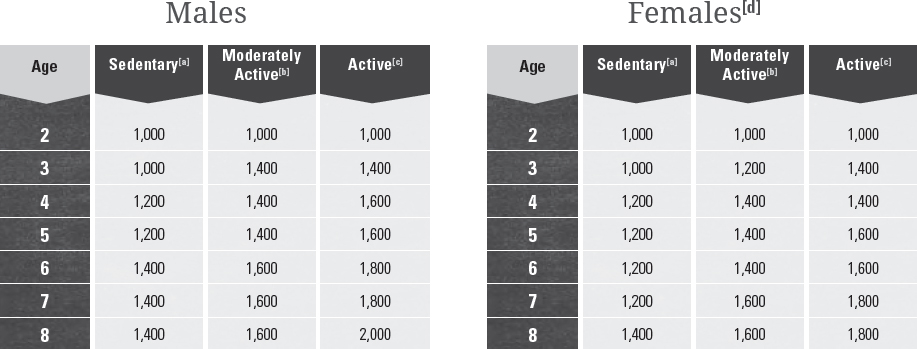
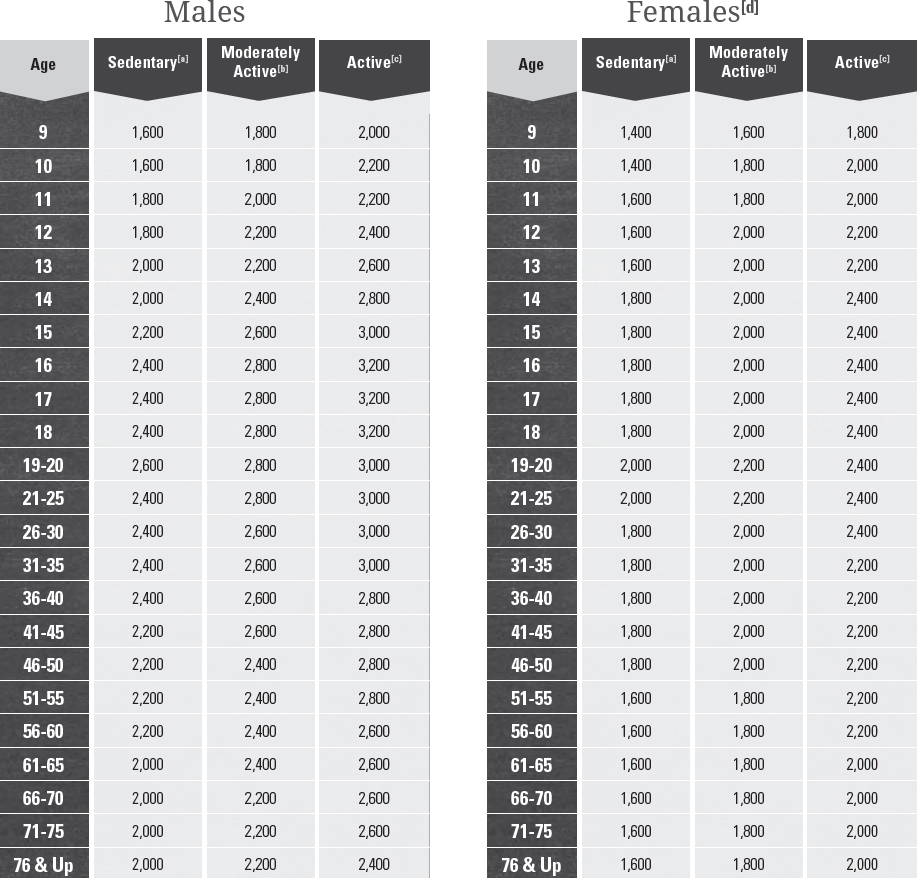
[a] Sedentary means a lifestyle that includes only the physical activity of independent living.
[b] Moderately Active means a lifestyle that includes physical activity equivalent to walking about 1.5 to 3 miles per day at 3 to 4 miles per hour, in addition to the activities of independent living.
[c] Active means a lifestyle that includes physical activity equivalent to walking more than 3 miles per day at 3 to 4 miles per hour, in addition to the activities of independent living.
[d] Estimates for females do not include women who are pregnant or breastfeeding.
SOURCE: Institute of Medicine. Dietary Reference Intakes for Energy, Carbohydrate, Fiber, Fat, Fatty Acids, Cholesterol, Protein, and Amino Acids. Washington (DC): The National Academies Press; 2002.
Appendix 3.
USDA Food Patterns: Healthy U.S.-Style Eating Pattern
The Healthy U.S.-Style Pattern is based on the types and proportions of foods Americans typically consume, but in nutrient-dense forms and appropriate amounts. It is designed to meet nutrient needs while not exceeding calorie requirements and while staying within limits for overconsumed dietary components.
The methodology used to develop and update this Pattern continues to be grounded in that of the food guides USDA has developed for the last 30 years. This methodology includes using current food consumption data to determine the mix and proportions of foods to include in each group, using current food composition data to select a nutrient-dense representative for each food, and calculating nutrient profiles for each food group using these nutrient-dense representative foods. As would be expected, most foods in their nutrient-dense forms do contain some sodium and saturated fatty acids. In a few cases, such as whole-wheat bread, the most appropriate representative in current Federal databases contains a small amount of added sugars. Detailed information about the representative foods, nutrient profiles, and Patterns is available on the USDA Center for Nutrition Policy and Promotion website.[1]
Amounts of each food group and subgroup are adjusted as needed, within the limits of the range of typical consumption when possible, to meet nutrient and Dietary Guidelines standards while staying within the limits for calories and overconsumed dietary components. Standards for nutrient adequacy aim to meet the Recommended Dietary Allowances (RDA), which are designed to cover the needs of 97 percent of the population, and Adequate Intakes (AI), which are used when an average nutrient requirement cannot be determined. The Patterns meet these standards for almost all nutrients. For a few nutrients (vitamin D, vitamin E, potassium, choline), amounts in the Patterns are marginal or below the RDA or AI standard for many or all age-sex groups. In most cases, an intake of these nutrients below the RDA or AI is not considered to be of public health concern. For more information on potassium and vitamin D, see Chapter 2, Underconsumed Nutrients and Nutrients of Public Health Concern.
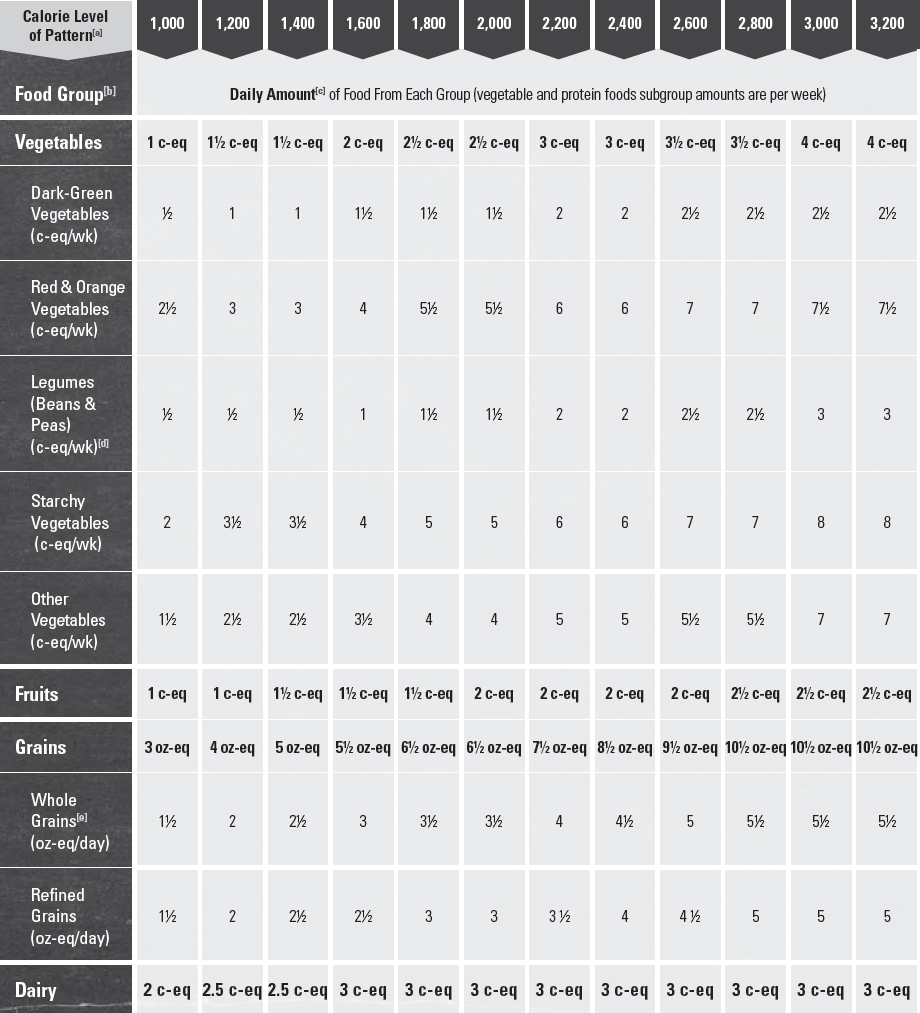
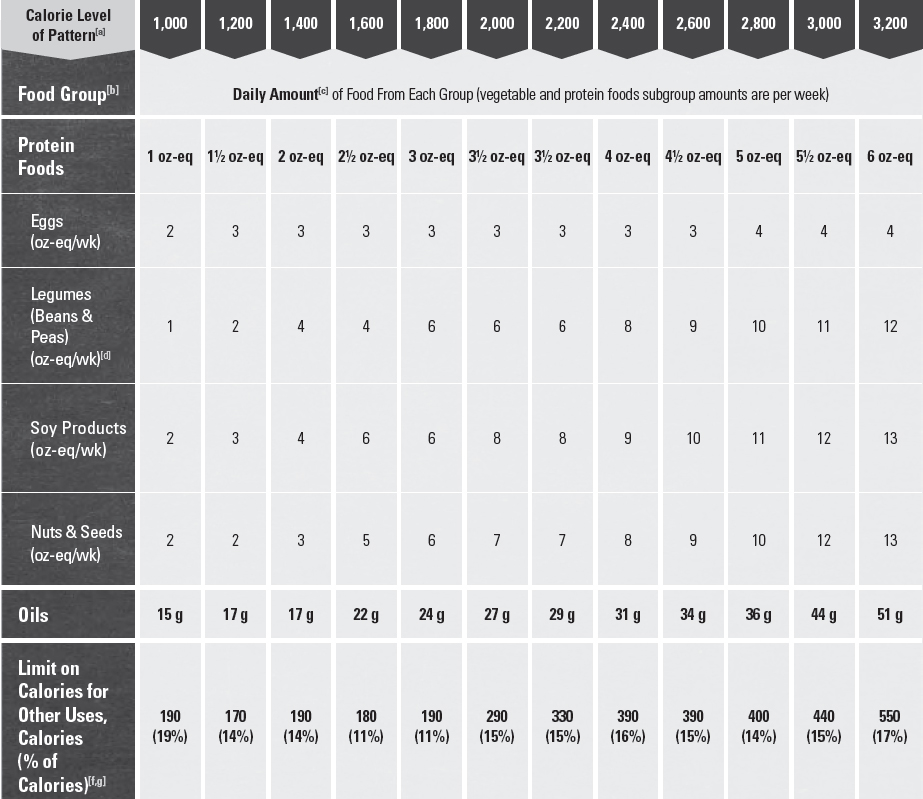
The Healthy U.S.-Style Pattern is the base USDA Food Pattern. While the Healthy U.S.-Style Pattern is substantially unchanged from the base USDA Food Pattern of the 2010 edition of the Dietary Guidelines, small changes in the recommended amounts reflect updating the Patterns based on current food consumption and composition data. The Healthy U.S.-Style Pattern includes 12 calorie levels to meet the needs of individuals across the lifespan. To follow this Pattern, identify the appropriate calorie level, choose a variety of foods in each group and subgroup over time in recommended amounts, and limit choices that are not in nutrient-dense forms so that the overall calorie limit is not exceeded.
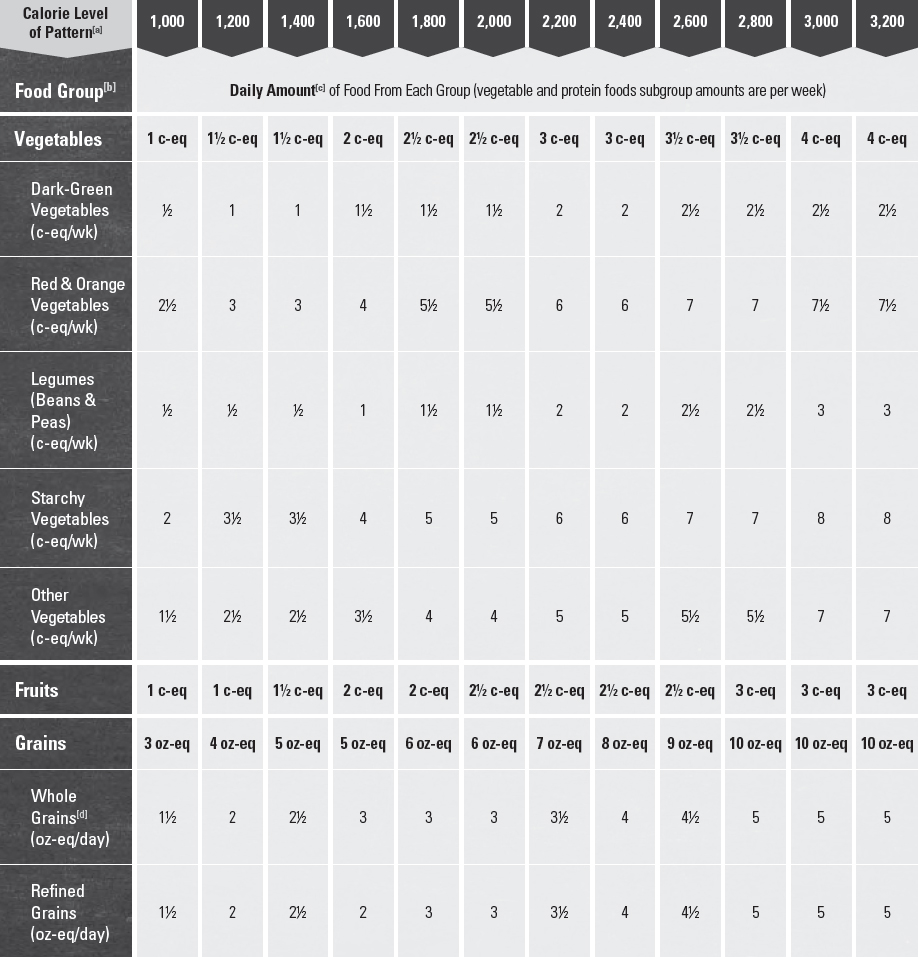
Table A3-1.
Healthy U.S.-Style Eating Pattern: Recommended Amounts of Food From Each Food Group at 12 Calorie Levels

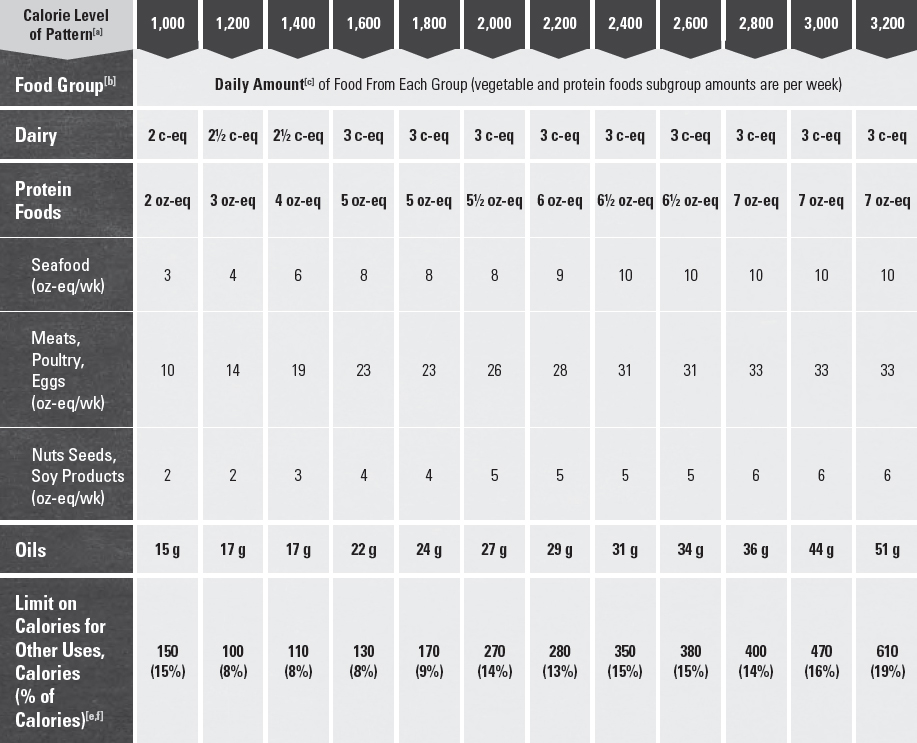
[a] Food intake patterns at 1,000, 1,200, and 1,400 calories are designed to meet the nutritional needs of 2- to 8-year-old children. Patterns from 1,600 to 3,200 calories are designed to meet the nutritional needs of children 9 years and older and adults. If a child 4 to 8 years of age needs more calories and, therefore, is following a pattern at 1,600 calories or more, his/her recommended amount from the dairy group should be 2.5 cups per day. Children 9 years and older and adults should not use the 1,000-, 1,200-, or 1,400-calorie patterns.
[b] Foods in each group and subgroup are:
• Vegetables
• Dark-green vegetables: All fresh, frozen, and canned dark-green leafy vegetables and broccoli, cooked or raw: for example, broccoli; spinach; romaine; kale; collard, turnip, and mustard greens.
• Red and orange vegetables: All fresh, frozen, and canned red and orange vegetables or juice, cooked or raw: for example, tomatoes, tomato juice, red peppers, carrots, sweet potatoes, winter squash, and pumpkin.
• Legumes (beans and peas): All cooked from dry or canned beans and peas: for example, kidney beans, white beans, black beans, lentils, chickpeas, pinto beans, split peas, and edamame (green soybeans). Does not include green beans or green peas.
• Starchy vegetables: All fresh, frozen, and canned starchy vegetables: for example, white potatoes, corn, green peas, green lima beans, plantains, and cassava.
• Other vegetables: All other fresh, frozen, and canned vegetables, cooked or raw: for example, iceberg lettuce, green beans, onions, cucumbers, cabbage, celery, zucchini, mushrooms, and green peppers.
• Fruits
• All fresh, frozen, canned, and dried fruits and fruit juices: for example, oranges and orange juice, apples and apple juice, bananas, grapes, melons, berries, and raisins.
• Grains
• Whole grains: All whole-grain products and whole grains used as ingredients: for example, whole-wheat bread, whole-grain cereals and crackers, oatmeal, quinoa, popcorn, and brown rice.
• Refined grains: All refined-grain products and refined grains used as ingredients: for example, white breads, refined grain cereals and crackers, pasta, and white rice. Refined grain choices should be enriched.
• Dairy
• All milk, including lactose-free and lactose-reduced products and fortified soy beverages (soymilk), yogurt, frozen yogurt, dairy desserts, and cheeses. Most choices should be fat-free or low-fat. Cream, sour cream, and cream cheese are not included due to their low calcium content.
• Protein Foods
• All seafood, meats, poultry, eggs, soy products, nuts, and seeds. Meats and poultry should be lean or low-fat and nuts should be unsalted. Legumes (beans and peas) can be considered part of this group as well as the vegetable group, but should be counted in one group only.
[c] Food group amounts shown in cup-(c) or ounce-equivalents (oz-eq). Oils are shown in grams (g). Quantity equivalents for each food group are:
• Vegetables and fruits, 1 cup-equivalent is: 1 cup raw or cooked vegetable or fruit, 1 cup vegetable or fruit juice, 2 cups leafy salad greens, ½ cup dried fruit or vegetable.
• Grains, 1 ounce-equivalent is: ½ cup cooked rice, pasta, or cereal; 1 ounce dry pasta or rice; 1 medium (1 ounce) slice bread; 1 ounce of ready-to-eat cereal (about 1 cup of flaked cereal).
• Dairy, 1 cup-equivalent is: 1 cup milk, yogurt, or fortified soymilk; 1½ ounces natural cheese such as cheddar cheese or 2 ounces of processed cheese.
• Protein Foods, 1 ounce-equivalent is: 1 ounce lean meat, poultry, or seafood; 1 egg; ¼ cup cooked beans or tofu; 1 Tbsp peanut butter; ½ ounce nuts or seeds.
[d] Amounts of whole grains in the Patterns for children are less than the minimum of 3 oz-eq in all Patterns recommended for adults.
[e] All foods are assumed to be in nutrient-dense forms, lean or low-fat and prepared without added fats, sugars, refined starches, or salt. If all food choices to meet food group recommendations are in nutrient-dense forms, a small number of calories remain within the overall calorie limit of the Pattern (i.e., limit on calories for other uses). The number of these calories depends on the overall calorie limit in the Pattern and the amounts of food from each food group required to meet nutritional goals. Nutritional goals are higher for the 1,200- to 1,600-calorie Patterns than for the 1,000-calorie Pattern, so the limit on calories for other uses is lower in the 1,200- to 1,600-calorie Patterns. Calories up to the specified limit can be used for added sugars, added refined starches, solid fats, alcohol, or to eat more than the recommended amount of food in a food group. The overall eating Pattern also should not exceed the limits of less than 10 percent of calories from added sugars and less than 10 percent of calories from saturated fats. At most calorie levels, amounts that can be accommodated are less than these limits. For adults of legal drinking age who choose to drink alcohol, a limit of up to 1 drink per day for women and up to 2 drinks per day for men within limits on calories for other uses applies (see Appendix 9. Alcohol for additional guidance); and calories from protein, carbohydrate, and total fats should be within the Acceptable Macronutrient Distribution Ranges (AMDRs).
[f] Values are rounded.
[1] For additional information and technical tables, see: U.S. Department of Agriculture. Center for Nutrition Policy and Promotion. USDA Food Patterns. Available at: http://www.cnpp.usda.gov/USDAFoodPatterns.
Appendix 4.
USDA Food Patterns: Healthy Mediterranean-Style Eating Pattern
The Healthy Mediterranean-Style Pattern is adapted from the Healthy U.S.-Style Pattern, modifying amounts recommended from some food groups to more closely reflect eating patterns that have been associated with positive health outcomes in studies of Mediterranean-Style diets. Food group intakes from the studies that provided quantified data were compared to amounts in the Healthy U.S.-Style Pattern and adjustments were made to better reflect intakes of groups with Mediterranean-Style diets. The healthfulness of the Pattern was evaluated based on its similarity to food group intakes reported for groups with positive health outcomes in these studies rather than on meeting specified nutrient standards.
The Healthy Mediterranean-Style Pattern contains more fruits and seafood and less dairy than does the Healthy U.S.-Style Pattern. The changes in these amounts were limited to calorie levels appropriate for adults, because children were not part of the studies used in modifying the Pattern. The amounts of oils in the Pattern were not adjusted because the Healthy U.S.-Style Pattern already contains amounts of oils that are similar to amounts associated with positive health outcomes in the studies, and higher than typical intakes in the United States. Similarly, amounts of meat and poultry in the Healthy U.S.-Style Pattern are less than typical intakes in the United States and also similar to amounts associated with positive health outcomes in the studies.
While not evaluated on nutrient-adequacy standards, nutrient levels in the Pattern were assessed. The Pattern is similar to the Healthy U.S.-Style Pattern in nutrient content, with the exception of calcium and vitamin D. Levels of calcium and vitamin D in the Pattern are lower because less dairy is included for adults. See table footnotes for amounts of dairy recommended for children and adolescents.
To follow this Pattern, identify the appropriate calorie level, choose a variety of foods in each group and subgroup over time in recommended amounts, and limit choices that are not in nutrient-dense forms so that the overall calorie limit is not exceeded.
Table A4-1.
Healthy Mediterranean-Style Eating Pattern: Recommended Amounts of Food From Each Food Group at 12 Calorie Levels
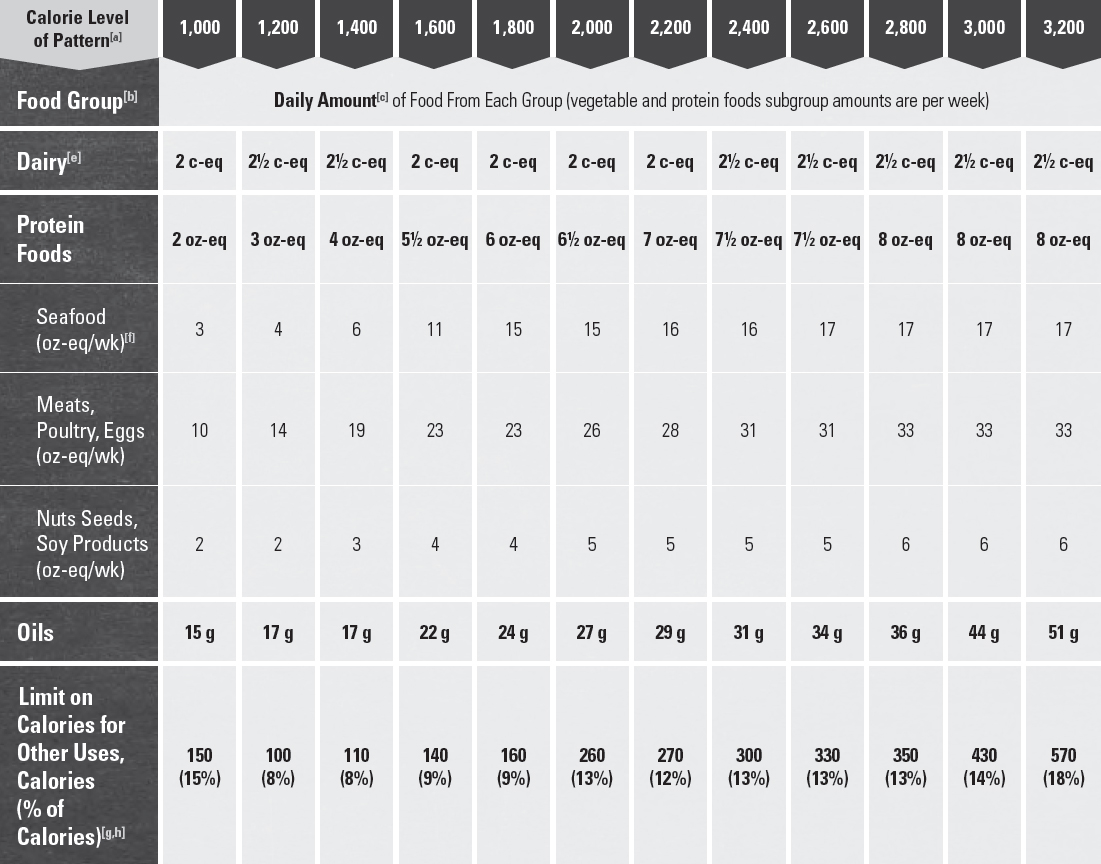
[a, b, c, d] See Appendix 3. USDA Food Patterns: Healthy U.S.-Style Eating Pattern, notes a through d.
[e] Amounts of dairy recommended for children and adolescents are as follows, regardless of the calorie level of the Pattern: For 2 year-olds, 2 cup-eq per day; for 3 to 8 year-olds, 2 ½ cup-eq per day; for 9 to 18 year-olds, 3 cup-eq per day.
[f] The U.S. Food and Drug Administration (FDA) and the U.S. Environmental Protection Agency (EPA) provide joint guidance regarding seafood consumption for women who are pregnant or breastfeeding and young children. For more information, see the FDA or EPA websites www.FDA.gov/fishadvice; www.EPA.gov/fishadvice.
[g,h] See Appendix 3, notes e through f.
Appendix 5.
USDA Food Patterns: Healthy Vegetarian Eating Pattern
The Healthy Vegetarian Pattern is adapted from the Healthy U.S.-Style Pattern, modifying amounts recommended from some food groups to more closely reflect eating patterns reported by self-identified vegetarians in the National Health and Nutrition Examination Survey (NHANES). This analysis allowed development of a Pattern that is based on evidence of the foods and amounts consumed by vegetarians, in addition to meeting the same nutrient and Dietary Guidelines standards as the Healthy U.S.-Style Pattern. Based on a comparison of the food choices of these vegetarians to nonvegetarians in NHANES, amounts of soy products (particularly tofu and other processed soy products), legumes, nuts and seeds, and whole grains were increased, and meat, poultry, and seafood were eliminated. Dairy and eggs were included because they were consumed by the majority of these vegetarians. This Pattern can be vegan if all dairy choices are comprised of fortified soy beverages (soymilk) or other plant-based dairy substitutes. Note that vegetarian adaptations of the USDA Food Patterns were included in the 2010 Dietary Guidelines. However, those adaptations did not modify the underlying structure of the Patterns, but substituted the same amounts of plant foods for animal foods in each food group. In contrast, the current Healthy Vegetarian Pattern includes changes in food group composition and amounts, based on assessing the food choices of vegetarians. The Pattern is similar in meeting nutrient standards to the Healthy U.S.-Style Pattern, but somewhat higher in calcium and fiber and lower in vitamin D due to differences in the foods included.
To follow this Pattern, identify the appropriate calorie level, choose a variety of foods in each group and subgroup over time in recommended amounts, and limit choices that are not in nutrient-dense forms so that the overall calorie limit is not exceeded.
Table A5-1.
Healthy Vegetarian Eating Pattern: Recommended Amounts of Food From Each Food Group at 12 Calorie Levels
[a, b, c] See Appendix 3. USDA Food Patterns: Healthy U.S.-Style Eating Pattern, notes a through c.
[d] About half of total legumes are shown as vegetables, in cup-eq, and half as protein foods, in oz-eq. Total legumes in the Patterns, in cup-eq, is the amount in the vegetable group plus the amount in protein foods group (in oz-eq) divided by 4:

[e, f, g] See Appendix 3, notes d through f.
Appendix 6.
Glossary of Terms
A
Acculturation—The process by which individuals who immigrate into a new country adopt the attitudes, values, customs, beliefs, and behaviors of the new culture. Acculturation is the gradual exchange between the original attitudes and behaviors associated with the originating country and those of the host culture.
Added Refined Starch—The starch constituent (see Carbohydrates) of a grain, such as corn, or of a vegetable, such as potato, used as an ingredient in another food. Starches have been refined to remove other components of the food, such as fiber, protein, and minerals. Refined starches can be added to foods as a thickener, a stabilizer, a bulking agent, or an anti-caking agent. While refined starches are made from grains or vegetables, they contain little or none of the many other components of these foods that together create a nutrient-dense food. They are a source of calories but few or no other nutrients.
Added Sugars—Syrups and other caloric sweeteners used as a sweetener in other food products. Naturally occurring sugars such as those in fruit or milk are not added sugars. Specific examples of added sugars that can be listed as an ingredient include brown sugar, corn sweetener, corn syrup, dextrose, fructose, glucose, high-fructose corn syrup, honey, invert sugar, lactose, malt syrup, maltose, molasses, raw sugar, sucrose, trehalose, and turbinado sugar. (See Carbohydrates, Sugars.)
B
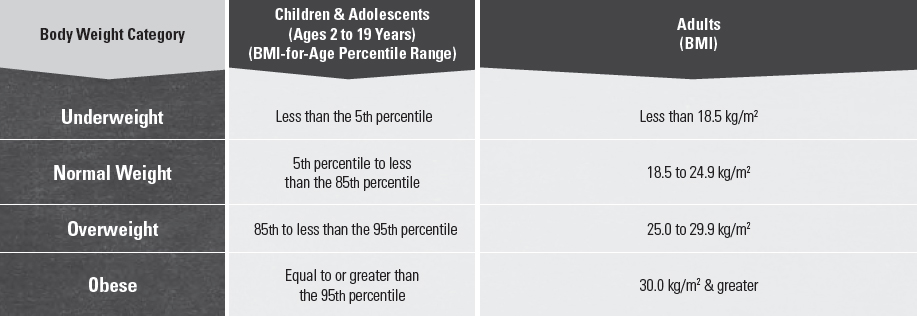
Body Mass Index (BMI)—A measure of weight in kilograms (kg) relative to height in meters squared (m2). BMI is considered a reasonably reliable indicator of total body fat, which is related to the risk of disease and death. BMI status categories include underweight, healthy weight, overweight, and obese (Table A6-1). Overweight and obese describe ranges of weight that are greater than what is considered healthy for a given height, while underweight describes a weight that is lower than what is considered healthy. Because children and adolescents are growing, their BMI is plotted on growth charts for sex and age. The percentile indicates the relative position of the child’s BMI among children of the same sex and age.
Table A6-1.
Body Mass Index (BMI) & Corresponding Body Weight Categories for Children & Adults
C
Calorie Balance—The balance between calories consumed through eating and drinking and calories expended through physical activity and metabolic processes.
• Calorie—A unit commonly used to measure energy content of foods and beverages as well as energy use (expenditure) by the body. A kilocalorie is equal to the amount of energy (heat) required to raise the temperature of 1 kilogram of water 1 degree centigrade. Energy is required to sustain the body’s various functions, including metabolic processes and physical activity. Carbohydrate, fat, protein, and alcohol provide all of the energy supplied by foods and beverages. If not specified explicitly, references to “calories” refer to “kilocalories.”
Carbohydrates—One of the macronutrients and a source of energy. They include sugars, starches, and fiber:
• Fiber—Total fiber is the sum of dietary fiber and functional fiber. Dietary fiber consists of nondigestible carbohydrates and lignin that are intrinsic and intact in plants (i.e., the fiber naturally occurring in foods). Functional fiber consists of isolated, nondigestible carbohydrates that have beneficial physiological effects in humans. Functional fibers are either extracted from natural sources or are synthetically manufactured and added to foods, beverages, and supplements.
• Starches—Many glucose units linked together into long chains. Examples of foods containing starch include vegetables (e.g., potatoes, carrots), grains (e.g., brown rice, oats, wheat, barley, corn), and legumes (beans and peas; e.g., kidney beans, garbanzo beans, lentils, split peas).
• Sugars—Composed of one unit (a monosaccharide, such as glucose or fructose) or two joined units (a disaccharide, such as lactose or sucrose). Sugars include those occurring naturally in foods and beverages, those added to foods and beverages during processing and preparation, and those consumed separately. (See Added Sugars.)
Cardiovascular Disease (CVD)—Heart disease as well as diseases of the blood vessel system (arteries, capillaries, veins) that can lead to heart attack, chest pain (angina), or stroke.
Cholesterol—A natural sterol present in all animal tissues. Free cholesterol is a component of cell membranes and serves as a precursor for steroid hormones (estrogen, testosterone, aldosterone), and for bile acids. Humans are able to synthesize sufficient cholesterol to meet biologic requirements, and there is no evidence for a dietary requirement for cholesterol.
• Blood Cholesterol—Cholesterol that travels in the serum of the blood as distinct particles containing both lipids and proteins (lipoproteins). Also referred to as serum cholesterol. Two kinds of lipoproteins are:
 High-Density Lipoprotein (HDL-cholesterol)—Blood cholesterol often called “good” cholesterol; carries cholesterol from tissues to the liver, which removes it from the body.
Low-Density Lipoprotein (LDL-Cholesterol)—Blood cholesterol often called “bad” cholesterol; carries cholesterol to arteries and tissues. A high LDL-cholesterol level in the blood leads to a buildup of cholesterol in arteries.
• Dietary Cholesterol—Cholesterol found in foods of animal origin, including meat, seafood, poultry, eggs, and dairy products. Plant foods, such as grains, vegetables, fruits, and oils do not contain dietary cholesterol.
Cup-Equivalent (cup-eq or c-eq)—The amount of a food or beverage product that is considered equal to 1 cup from the vegetables, fruits, or dairy food groups. A cup-eq for some foods or beverages may differ from a measured cup in volume because the foods have been concentrated (such as raisins or tomato paste), the foods are airy in their raw form and do not compress well into a cup (such as salad greens), or the foods are measured in a different form (such as cheese).
D
DASH Eating Plan—The DASH (Dietary Approaches to Stop Hypertension) Eating Plan exemplifies healthy eating. It was designed to increase intake of foods expected to lower blood pressure while being heart healthy and meeting Institute of Medicine (IOM) nutrient recommendations. It is available at specific calorie levels. It was adapted from the dietary pattern developed for the Dietary Approaches to Stop Hypertension (DASH) research trials. In the trials, the DASH dietary pattern lowered blood pressure and LDL-cholesterol levels, resulting in reduced cardiovascular disease risk. The DASH Eating Plan is low in saturated fats and rich in potassium, calcium, and magnesium, as well as fiber and protein. It also is lower in sodium than the typical American diet, and includes menus with two levels of sodium, 2,300 and 1,500 mg per day. It meets the Dietary Reference Intakes for all essential nutrients and stays within limits for overconsumed nutrients, while allowing adaptable food choices based on food preferences, cost, and availability.
Diabetes—A disorder of metabolism—the way the body uses digested food (specifically carbohydrate) for growth and energy. In diabetes, the pancreas either produces little or no insulin (a hormone that helps glucose, the body’s main source of fuel, get into cells), or the cells do not respond appropriately to the insulin that is produced, which causes too much glucose to be released in the blood. The three main types of diabetes are type 1, type 2, and gestational diabetes. If not controlled, diabetes can lead to serious complications.
Dietary Reference Intakes (DRIs)—A set of nutrient-based reference values that are quantitative estimates of nutrient intakes to be used for planning and assessing diets for healthy people. DRIs expand on the periodic reports called Recommended Dietary Allowances (RDAs), which were first published by the Institute of Medicine in 1941.
• Acceptable Macronutrient Distribution Ranges (AMDR)—Range of intake for a particular energy source (i.e., carbohydrate, fat, and protein) that is associated with reduced risk of chronic disease while providing intakes of essential nutrients. If an individual’s intake is outside of the AMDR, there is a potential of increasing the risk of chronic diseases and/or insufficient intakes of essential nutrients.
• Adequate Intakes (AI)—A recommended average daily nutrient intake level based on observed or experimentally determined approximations or estimates of mean nutrient intake by a group (or groups) of apparently healthy people. An AI is used when the Recommended Dietary Allowance cannot be determined.
• Estimated Average Requirements (EAR)—The average daily nutrient intake level estimated to meet the requirement of half the healthy individuals in a particular life stage and sex group.
• Recommended Dietary Allowances (RDA)—The average daily dietary intake level that is sufficient to meet the nutrient requirement of nearly all (97 to 98%) healthy individuals in a particular life stage and sex group.
• Tolerable Upper Intake Levels (UL)—The highest average daily nutrient intake level likely to pose no risk of adverse health effects for nearly all individuals in a particular life stage and sex group. As intake increases above the UL, the potential risk of adverse health effects increases.
E
Eating Behaviors—Individual behaviors that affect food and beverage choices and intake patterns, such as what, where, when, why, and how much people eat.
Eating Pattern (also called “dietary pattern”)—The combination of foods and beverages that constitute an individual’s complete dietary intake over time. This may be a description of a customary way of eating or a description of a combination of foods recommended for consumption. Specific examples include USDA Food Patterns and the Dietary Approaches to Stop Hypertension (DASH) Eating Plan. (See USDA Food Patterns and DASH Eating Plan.)
Energy Drink—A beverage that contains caffeine as an ingredient, along with other ingredients, such as taurine, herbal supplements, vitamins, and added sugars. It is usually marketed as a product that can improve perceived energy, stamina, athletic performance, or concentration.
Enrichment—The addition of specific nutrients (i.e., iron, thiamin, riboflavin, and niacin) to refined grain products in order to replace losses of the nutrients that occur during processing. Enrichment of refined grains is not mandatory; however, those that are labeled as enriched (e.g., enriched flour) must meet the standard of identity for enrichment set by the FDA. When cereal grains are labeled as enriched, it is mandatory that they be fortified with folic acid. (The addition of specific nutrients to whole-grain products is referred to as fortification; see Fortification.)
Essential Nutrient—A vitamin, mineral, fatty acid, or amino acid required for normal body functioning that either cannot be synthesized by the body at all, or cannot be synthesized in amounts adequate for good health, and thus must be obtained from a dietary source. Other food components, such as dietary fiber, while not essential, also are considered to be nutrients.
Existing Report—An existing systematic review, meta-analysis, or report by a Federal agency or leading scientific organization examined by the 2015 Dietary Guidelines Advisory Committee in its review of the scientific evidence. A systematic process was used by the Advisory Committee to assess the quality and comprehensiveness of the review for addressing the question of interest. (See Nutrition Evidence Library (NEL) systematic review.)
F
Fats—One of the macronutrients and a source of energy. (See Solid Fats and Oils.)
• Monounsaturated Fatty Acids (MUFAs)—Fatty acids that have one double bond and are usually liquid at room temperature. Plant sources rich in MUFAs include vegetable oils (e.g., canola, olive, high oleic safflower and sunflower), as well as nuts.
• Polyunsaturated Fatty Acids (PUFAs)—Fatty acids that have two or more double bonds and are usually liquid at room temperature. Primary sources are vegetable oils and some nuts and seeds. PUFAs provide essential fats such as n-3 and n-6 fatty acids.
• n-3 PUFAs—A carboxylic acid with an 18-carbon chain and three cis double bonds, Alpha-linolenic acid (ALA) is an n-3 fatty acid that is essential in the diet because it cannot be synthesized by humans. Primary sources include soybean oil, canola oil, walnuts, and flaxseed. Eicosapentaenoic acid (EPA) and docosahexaenoic acid (DHA) are very long chain n-3 fatty acids that are contained in fish and shellfish. Also called omega-3 fatty acids.
• n-6 PUFAs—A carboxylic acid with an 18-carbon chain and two cis double bonds, Linoleic acid (LA), one of the n-6 fatty acids, is essential in the diet because it cannot be synthesized by humans. Primary sources are nuts and liquid vegetable oils, including soybean oil, corn oil, and safflower oil. Also called omega-6 fatty acids.
• Saturated Fatty Acids—Fatty acids that have no double bonds. Fats high in saturated fatty acids are usually solid at room temperature. Major sources include animal products such as meats and dairy products, and tropical oils such as coconut or palm oils.
• Trans Fatty Acids—Unsaturated fatty acids that are structurally different from the unsaturated fatty acids that occur naturally in plant foods. Sources of trans fatty acids include partially hydrogenated vegetable oils used in processed foods such as desserts, microwave popcorn, frozen pizza, some margarines, and coffee creamer. Trans fatty acids also are present naturally in foods that come from ruminant animals (e.g., cattle and sheep), such as dairy products, beef, and lamb.
Food Access—Ability to obtain and maintain levels of sufficient amounts of healthy, safe, and affordable food for all family members in various settings including where they live, learn, work and play. Food access is often measured by distance to a store or the number of stores in an area; individual-level resources such as family income or vehicle availability; and neighborhood-level indicators of resources, such as average income of the neighborhood and the availability of public transportation.
Food Categories—A method of grouping similar foods in their as-consumed forms, for descriptive purposes. The USDA’s Agricultural Research Service (ARS) has created 150 mutually exclusive food categories to account for each food or beverage item reported in What We Eat in America (WWEIA), the food intake survey component of the National Health and Nutrition Examination Survey (for more information, visit: http://seprl.ars.usda.gov/Services/docs.htm?docid=23429). Examples of WWEIA Food Categories include soups, nachos, and yeast breads. In contrast to food groups, items are not disaggregated into their component parts for assignment to food categories. For example, all pizzas are put into the pizza category.
Food Hub—A community space anchored by a food store with adjacent social and financial services where businesses or organizations can actively manage the aggregation, distribution, and marketing of source-identified food products to strengthen their ability to satisfy wholesale, retail, and institutional demand.
Food Groups—A method of grouping similar foods for descriptive and guidance purposes. Food groups in the USDA Food Patterns are defined as vegetables, fruits, grains, dairy, and protein foods. Some of these groups are divided into subgroups, such as dark-green vegetables or whole grains, which may have intake goals or limits. Foods are grouped within food groups based on their similarity in nutritional composition and other dietary benefits. For assignment to food groups, mixed dishes are disaggregated into their major component parts.
Food Pattern Modeling—The process of developing and adjusting daily intake amounts from food categories or groups to meet specific criteria, such as meeting nutrient intake goals, limiting nutrients or other food components, or varying proportions or amounts of specific food categories or groups. This methodology includes using current food consumption data to determine the mix and proportions of foods to include in each group, using current food composition data to select a nutrient-dense representative for each food, calculating nutrient profiles for each food group using these nutrient-dense representative foods, and modeling various combinations of foods and amounts to meet specific criteria. (See USDA Food Patterns.)
Food & Nutrition Policies—Regulations, laws, policymaking actions, or formal or informal rules established by formal organizations or government units. Food and nutrition policies are those that influence food settings and/or eating behaviors to improve food and/ or nutrition choices, and potentially, health outcomes (e.g., body weight).
Fortification—As defined by the U.S. Food and Drug Administration (FDA), the deliberate addition of one or more essential nutrients to a food, whether or not it is normally contained in the food. Fortification may be used to prevent or correct a demonstrated deficiency in the population or specific population groups; restore naturally occurring nutrients lost during processing, storage, or handling; or to add a nutrient to a food at the level found in a comparable traditional food. When cereal grains are labeled as enriched, it is mandatory that they be fortified with folic acid.
H
Health—A state of complete physical, mental, and social well-being and not merely the absence of disease or infirmity.
Healthy Eating Index (HEI)—A measure of diet quality that assesses adherence to the Dietary Guidelines. The HEI is used to monitor diet quality in the United States and to examine relationships between diet and health-related outcomes. The HEI is a scoring metric that can be applied to any defined set of foods, such as previously collected dietary data, a defined menu, or a market basket. Thus, the HEI can be used to assess the quality of food assistance packages, menus, and the U.S. food supply.
High-Intensity Sweeteners—Ingredients commonly used as sugar substitutes or sugar alternatives to sweeten and enhance the flavor of foods and beverages. People may choose these sweeteners in place of sugar for a number of reasons, including that they contribute few or no calories to the diet. Because high-intensity sweeteners are many times sweeter than table sugar (sucrose), smaller amounts of high-intensity sweeteners are needed to achieve the same level of sweetness as sugar in food and beverages. (Other terms commonly used to refer to sugar substitutes or alternatives include non-caloric, low-calorie, no-calorie, and artificial sweeteners, which may have different definitions and applications. A high-intensity sweetener may or may not be non-caloric, low-calorie, no-calorie, or artificial sweeteners.)
Household Food Insecurity—Circumstances in which the availability of nutritionally adequate and safe food, or the ability to acquire acceptable foods in socially acceptable ways, is limited or uncertain.
Hypertension—A condition, also known as high blood pressure, in which blood pressure remains elevated over time. Hypertension makes the heart work too hard, and the high force of the blood flow can harm arteries and organs, such as the heart, kidneys, brain, and eyes. Uncontrolled hypertension can lead to heart attacks, heart failure, kidney disease, stroke, and blindness. Prehypertension is defined as blood pressure that is higher than normal but not high enough to be defined as hypertension.
M
Macronutrient—A dietary component that provides energy. Macronutrients include protein, fats, carbohydrates, and alcohol.
Meats & Poultry—Foods that come from the flesh of land animals and birds. In the USDA Food Patterns, organs (such as liver) are also considered to be meat or poultry.
• Meat (also known as “red meat”)—All forms of beef, pork, lamb, veal, goat, and non-bird game (e.g., venison, bison, elk).
• Poultry—All forms of chicken, turkey, duck, geese, guineas, and game birds (e.g., quail, pheasant).
• Lean Meat & Lean Poultry—Any meat or poultry that contains less than 10 g of fat, 4.5 g or less of saturated fats, and less than 95 mg of cholesterol per 100 g and per labeled serving size, based on USDA definitions for food label use. Examples include 95% lean cooked ground beef, beef top round steak or roast, beef tenderloin, pork top loin chop or roast, pork tenderloin, ham or turkey deli slices, skinless chicken breast, and skinless turkey breast.
• Processed Meat & Processed Poultry—All meat or poultry products preserved by smoking, curing, salting, and/or the addition of chemical preservatives. Processed meats and poultry include all types of meat or poultry sausages (bologna, frankfurters, luncheon meats and loaves, sandwich spreads, viennas, chorizos, kielbasa, pepperoni, salami, and summer sausages), bacon, smoked or cured ham or pork shoulder, corned beef, pastrami, pig’s feet, beef jerky, marinated chicken breasts, and smoked turkey products.
Mixed Dishes—Savory food items eaten as a single entity that include foods from more than one food group. These foods often are mixtures of grains, protein foods, vegetables, and/or dairy. Examples of mixed dishes include burgers, sandwiches, tacos, burritos, pizzas, macaroni and cheese, stir-fries, spaghetti and meatballs, casseroles, soups, egg rolls, and Caesar salad.
Moderate Alcohol Consumption—Up to one drink per day for women and up to two drinks per day for men. One drink-equivalent is described using the reference beverages of 12 fl oz of regular beer (5% alcohol), 5 fl oz of wine (12% alcohol), or 1.5 fl oz of 80 proof (40%) distilled spirits. One drink-equivalent is described as containing 14 g (0.6 fl oz) of pure alcohol.[1]
Multi-Component Intervention—Interventions that use a combination of strategies to promote behavior change. These strategies can be employed across or within different settings or levels of influence.
Multi-Level Intervention—Interventions are those that target change at the individual level as well as additional levels, such as in the community (e.g., public health campaigns), schools (e.g., education), and food service (e.g., menu modification).
N
Nutrient Dense—A characteristic of foods and beverages that provide vitamins, minerals, and other substances that contribute to adequate nutrient intakes or may have positive health effects, with little or no solid fats and added sugars, refined starches, and sodium. Ideally, these foods and beverages also are in forms that retain naturally occurring components, such as dietary fiber. All vegetables, fruits, whole grains, seafood, eggs, beans and peas, unsalted nuts and seeds, fat-free and low-fat dairy products, and lean meats and poultry—when prepared with little or no added solid fats, sugars, refined starches, and sodium—are nutrient-dense foods. These foods contribute to meeting food group recommendations within calorie and sodium limits. The term “nutrient dense” indicates the nutrients and other beneficial substances in a food have not been “diluted” by the addition of calories from added solid fats, sugars, or refined starches, or by the solid fats naturally present in the food.
Nutrient of Concern—Nutrients that are overconsumed or underconsumed and current intakes may pose a substantial public health concern. Data on nutrient intake, corroborated with biochemical markers of nutritional status where available, and association with health outcomes are all used to establish a nutrient as a nutrient of concern. Underconsumed nutrients, or “shortfall nutrients,” are those with a high prevalence of inadequate intake either across the U.S. population or in specific groups, relative to IOM-based standards, such as the Estimated Average Requirement (EAR) or the Adequate Intake (AI). Overconsumed nutrients are those with a high prevalence of excess intake either across the population or in specific groups, related to IOM-based standards such as the Tolerable Upper Intake Level (UL) or other expert group standards.
Nutrition Evidence Library (NEL) Systematic Review—A process that uses state-of-the-art methods to identify, evaluate, and synthesize research to provide timely answers to important food and nutrition-related questions to inform U.S. Federal nutrition policies, programs, and recommendations. This rigorous, protocol-driven methodology is designed to minimize bias, maximize transparency, and ensure the use of all available relevant and high-quality research. The NEL is a program within the USDA Center for Nutrition Policy and Promotion. For more detailed information, visit: www.NEL.gov.
O
Oils—Fats that are liquid at room temperature. Oils come from many different plants and some fish. Some common oils include canola, corn, olive, peanut, safflower, soybean, and sunflower oils.
A number of foods are naturally high in oils such as nuts, olives, some fish, and avocados. Foods that are mainly made up of oil include mayonnaise, certain salad dressings, and soft (tub or squeeze) margarine with no trans fats. Oils are high in monounsaturated or polyunsaturated fats, and lower in saturated fats than solid fats. A few plant oils, termed tropical oils, including coconut oil, palm oil and palm kernel oil, are high in saturated fats and for nutritional purposes should be considered as solid fats. Partially hydrogenated oils that contain trans fats should also be considered as solid fats for nutritional purposes. (See Fats.)
Ounce-Equivalent (oz-eq)—The amount of a food product that is considered equal to 1 ounce from the grain or protein foods food group. An oz-eq for some foods may be less than a measured ounce in weight if the food is concentrated or low in water content (nuts, peanut butter, dried meats, flour) or more than a measured ounce in weight if the food contains a large amount of water (tofu, cooked beans, cooked rice or pasta).
P
Physical Activity—Any bodily movement produced by the contraction of skeletal muscle that increases energy expenditure above a basal level; generally refers to the subset of physical activity that enhances health.
Point-of-Purchase—A place where sales are made. Various intervention strategies have been proposed to affect individuals’ purchasing decisions at the point of purchase, such as board or menu labeling with various amounts of nutrition information or shelf tags in grocery stores.
Portion Size—The amount of a food served or consumed in one eating occasion. A portion is not a standardized amount, and the amount considered to be a portion is subjective and varies.
Prehypertension—See Hypertension.
Protein—One of the macronutrients; a major functional and structural component of every animal cell. Proteins are composed of amino acids, nine of which are indispensable (essential), meaning they cannot be synthesized by humans and therefore must be obtained from the diet. The quality of dietary protein is determined by its amino acid profile relative to human requirements as determined by the body’s requirements for growth, maintenance, and repair. Protein quality is determined by two factors: digestibility and amino acid composition.
R
Refined Grains—Grains and grain products with the bran and germ removed; any grain product that is not a whole-grain product. Many refined grains are low in fiber but enriched with thiamin, riboflavin, niacin, and iron, and fortified with folic acid.
S
Screen Time—Time spent in front of a computer, television, video or computer game system, smart phone or tablet, or related device.
Seafood—Marine animals that live in the sea and in freshwater lakes and rivers. Seafood includes fish (e.g., salmon, tuna, trout, and tilapia) and shellfish (e.g., shrimp, crab, and oysters).
Sedentary Behavior—Any waking activity predominantly done while in a sitting or reclining posture. A behavior that expends energy at or minimally above a person’s resting level (between 1.0 and 1.5 metabolic equivalents) is considered sedentary behavior.
Serving Size—A standardized amount of a food, such as a cup or an ounce, used in providing information about a food within a food group, such as in dietary guidance. Serving size on the Nutrition Facts label is determined based on the Reference Amounts Customarily Consumed (RACC) for foods that have similar dietary usage, product characteristics, and customarily consumed amounts for consumers to make “like product” comparisons. (See Portion Size.)
Shortfall Nutrient—See Nutrient of Concern.
Social-Ecological Model—A framework developed to illustrate how sectors, settings, social and cultural norms, and individual factors converge to influence individual food and physical activity choices.
Solid Fats—Fats that are usually not liquid at room temperature. Solid fats are found in animal foods, except for seafood, and can be made from vegetable oils through hydrogenation. Some tropical oil plants, such as coconut and palm, are considered as solid fats due to their fatty acid composition. The fat component of milk and cream (butter) is solid at room temperature. Solid fats contain more saturated fats and/or trans fats than liquid oils (e.g., soybean, canola, and corn oils), with lower amounts of monounsaturated or polyunsaturated fatty acids. Common fats considered to be solid fats include: butter, beef fat (tallow), chicken fat, pork fat (lard), shortening, coconut oil, palm oil and palm kernel oil. Foods high in solid fats include: full-fat (regular) cheeses, creams, whole milk, ice cream, marbled cuts of meats, regular ground beef, bacon, sausages, poultry skin, and many baked goods made with solid fats (such as cookies, crackers, doughnuts, pastries, and croissants). (See Fats and Nutrient Dense)
Sugar-Sweetened Beverages—Liquids that are sweetened with various forms of added sugars. These beverages include, but are not limited to, soda (regular, not sugar-free), fruitades, sports drinks, energy drinks, sweetened waters, and coffee and tea beverages with added sugars. Also called calorically sweetened beverages. (See Added Sugars and Carbohydrates: Sugars.)
U
USDA Food Patterns—A set of eating patterns that exemplify healthy eating, which all include recommended intakes for the five food groups (vegetables, fruits, grains, dairy, and protein foods) and for subgroups within the vegetables, grains, and protein foods groups. They also recommend an allowance for intake of oils. Patterns are provided at 12 calorie levels from 1,000 to 3,200 calories to meet varied calorie needs. The Healthy U.S.-Style Pattern is the base USDA Food Pattern.
• Healthy U.S.-Style Eating Pattern—A pattern that exemplifies healthy eating based on the types and proportions of foods Americans typically consume, but in nutrient-dense forms and appropriate amounts, designed to meet nutrient needs while not exceeding calorie requirements. It is substantially unchanged from the primary USDA Food Patterns of the 2010 Dietary Guidelines. This pattern is evaluated in comparison to meeting Dietary Reference Intakes for essential nutrients and staying within limits set by the IOM or Dietary Guidelines for overconsumed food components. It aligns closely with the Dietary Approaches to Stop Hypertension (DASH) Eating Plan, a guide for healthy eating based on the DASH diet which was tested in clinical trials. (See Nutrient Dense and DASH Eating Plan.)
• Healthy Mediterranean-Style Eating Pattern—A pattern that exemplifies healthy eating, designed by modifying the Healthy U.S.-Style Pattern to more closely reflect eating patterns that have been associated with positive health outcomes in studies of Mediterranean-Style diets. This pattern is evaluated based on its similarity to food group intakes of groups with positive health outcomes in these studies rather than on meeting specified nutrient standards. It differs from the Healthy U.S.-Style Pattern in that it includes more fruits and seafood and less dairy.
• Healthy Vegetarian Eating Pattern—A pattern that exemplifies healthy eating, designed by modifying the Healthy U.S.-Style Pattern to more closely reflect eating patterns reported by self-identified vegetarians. This pattern is evaluated in comparison to meeting Dietary Reference Intakes for essential nutrients and staying within limits set by the IOM or Dietary Guidelines for overconsumed food components. It differs from the Healthy U.S.-Style Pattern in that it includes more legumes, soy products, nuts and seeds, and whole grains, and no meat, poultry, or seafood.
V
Variety—A diverse assortment of foods and beverages across and within all food groups and subgroups selected to fulfill the recommended amounts without exceeding the limits for calories and other dietary components. For example, in the vegetables food group, selecting a variety of foods could be accomplished over the course of a week by choosing from all subgroups, including dark green, red and orange, legumes (beans and peas), starchy, and other vegetables.
W
Whole Fruits—All fresh, frozen, canned, and dried fruit but not fruit juice.
Whole Grains—Grains and grain products made from the entire grain seed, usually called the kernel, which consists of the bran, germ, and endosperm. If the kernel has been cracked, crushed, or flaked, it must retain the same relative proportions of bran, germ, and endosperm as the original grain in order to be called whole grain. Many, but not all, whole grains are also sources of dietary fiber.
[1] Drink-equivalents are not intended to serve as a standard drink definition for regulatory purposes.
Appendix 7.
Nutritional Goals for Age-Sex Groups Based on Dietary Reference Intakes & Dietary Guidelines Recommendations
Table A7-1.
Daily Nutritional Goals for Age-Sex Groups Based on Dietary Reference Intakes & Dietary Guidelines Recommendations
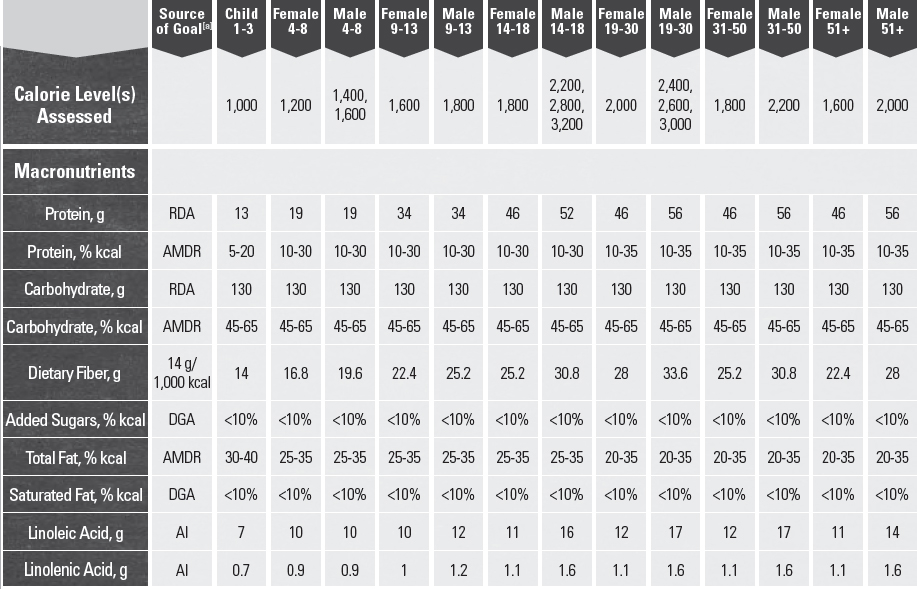
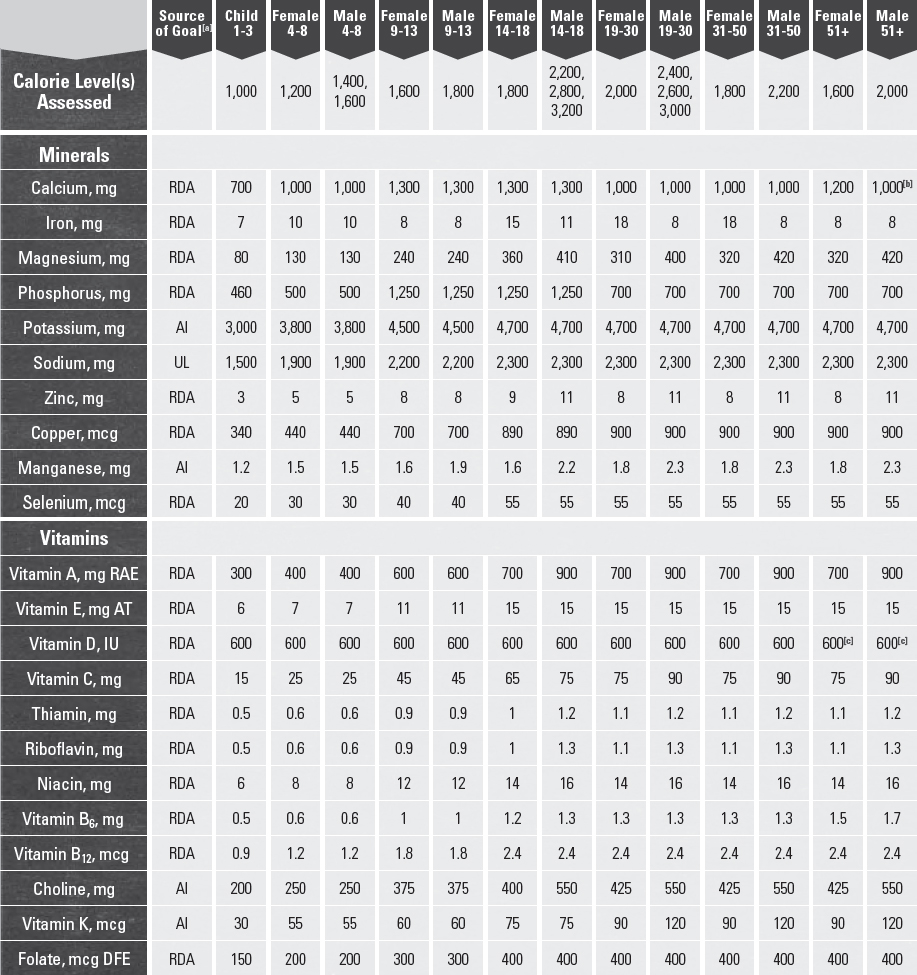
[a] RDA = Recommended Dietary Allowance, AI = Adequate Intake, UL = Tolerable Upper Intake Level, AMDR = Acceptable Macronutrient Distribution Range, DGA = 2015-2020 Dietary Guidelines recommended limit; 14 g fiber per 1,000 kcal = basis for AI for fiber.
[b] Calcium RDA for males ages 71+ years is 1,200 mg.
[c] Vitamin D RDA for males and females ages 71+ years is 800 IU.
SOURCES: Institute of Medicine. Dietary Reference Intakes: The essential guide to nutrient requirements. Washington (DC): The National Academies Press; 2006.
Institute of Medicine. Dietary Reference Intakes for Calcium and Vitamin D. Washington (DC): The National Academies Press; 2010.
Appendix 8.
Federal Resources for Information on Nutrition & Physical Activity
Table A8-1.
Federal Nutrition & Physical Activity Resources
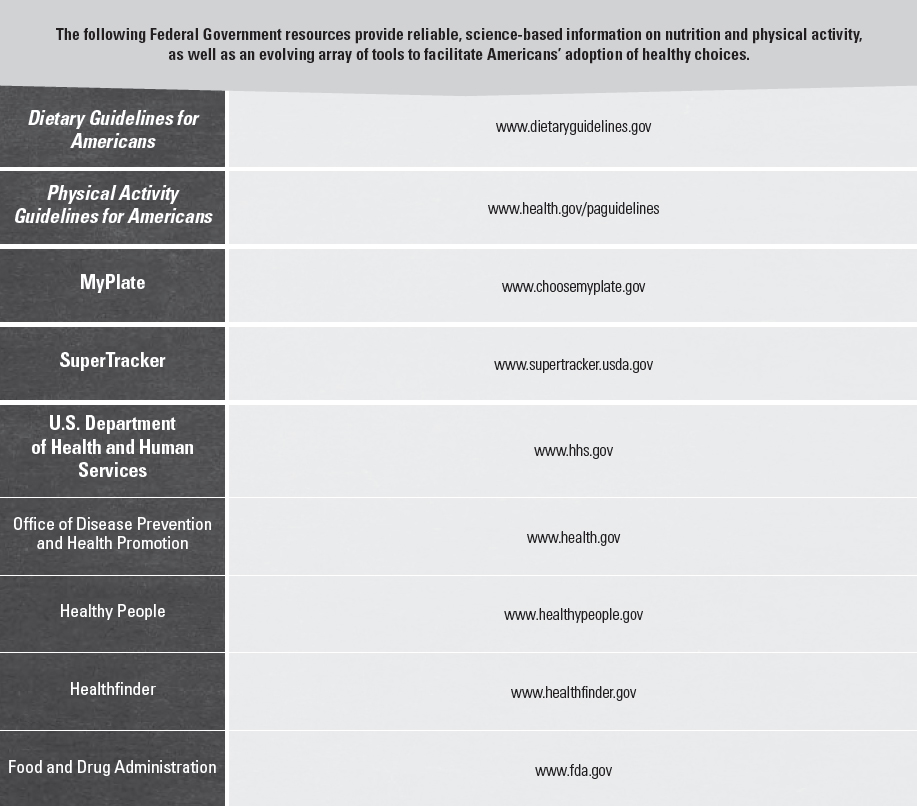
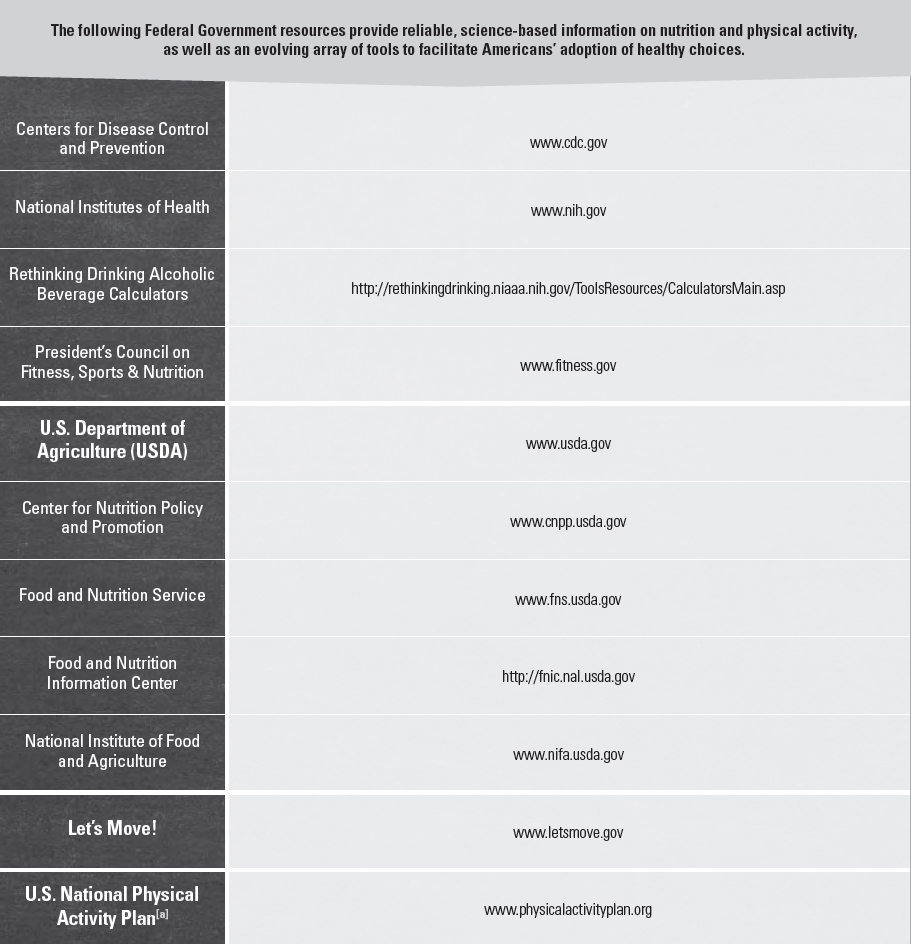
[a] Note: The U.S. National Physical Activity Plan is not a product of the Federal Government. However, a number of Federal offices were involved in the development of the Plan.
Appendix 9.
Alcohol
If alcohol is consumed, it should be in moderation—up to one drink per day for women and up to two drinks per day for men—and only by adults of legal drinking age. For those who choose to drink, moderate alcohol consumption can be incorporated into the calorie limits of most healthy eating patterns. The Dietary Guidelines does not recommend that individuals who do not drink alcohol start drinking for any reason; however, it does recommend that all foods and beverages consumed be accounted for within healthy eating patterns. Alcohol is not a component of the USDA Food Patterns. Thus, if alcohol is consumed, the calories from alcohol should be accounted for so that the limits on calories for other uses and total calories are not exceeded (see the Other Dietary Components section of Chapter 1. Key Elements of Healthy Eating Patterns for further discussion of limits on alcohol and calories for other uses within healthy eating patterns).
For the purposes of evaluating amounts of alcohol that may be consumed, the Dietary Guidelines includes drink-equivalents (Table A9-1). One alcoholic drink-equivalent is described as containing 14 g (0.6 fl oz) of pure alcohol.[1] The following are reference beverages that are one alcoholic drink-equivalent: 12 fluid ounces of regular beer (5% alcohol), 5 fluid ounces of wine (12% alcohol), or 1.5 fluid ounces of 80 proof distilled spirits (40% alcohol).[2]
Packaged (e.g., canned beer, bottled wine) and mixed beverages (e.g., margarita, rum and soda, mimosa, sangria) vary in alcohol content. For this reason it is important to determine how many alcoholic drink-equivalents are in the beverage and limit intake. Table A9-1 lists reference beverages that are one drink-equivalent and provides examples of alcoholic drink-equivalents in other alcoholic beverages.
When determining the number of drink-equivalents in an alcoholic beverage, the variability in alcohol content and portion size must be considered together. As an example, the amount of alcohol in a beer may be higher than 5 percent and, thus, 12 ounces would be greater than one drink-equivalent. In addition to the alcohol content, the portion size may be many times larger than the reference beverage. For example, portion sizes for beer may be higher than 12 ounces and, thus, even if the alcohol content is 5 percent, the beverage would be greater than one drink-equivalent (see Table A9-1 for additional examples). The same is true for wine and mixed drinks with distilled spirits.
Alcoholic Beverages & Calories
Alcoholic beverages may contain calories from both alcohol and other ingredients. If they are consumed, the contributions from calories from alcohol and other dietary components (e.g., added sugars, solid fats) from alcoholic beverages should be within the various limits of healthy eating patterns described in Chapter 1. One drink-equivalent contains 14 grams of pure alcohol, which contributes 98 calories to the beverage. The total calories in a beverage may be more than those from alcohol alone, depending on the type, brand, ingredients, and portion size. For example, 12 ounces of regular beer (5% alcohol) may have about 150 calories, 5 ounces of wine (12% alcohol) may have about 120 calories, and 7 ounces of a rum (40% alcohol) and cola may have about 155 calories, each with 98 calories coming from pure alcohol.[3]
Excessive Drinking
In comparison to moderate alcohol consumption, high-risk drinking is the consumption of 4 or more drinks on any day or 8 or more drinks per week for women and 5 or more drinks on any day or 15 or more drinks per week for men.
Table A9-1.
Alcoholic Drink-Equivalents[a] of Select Beverages
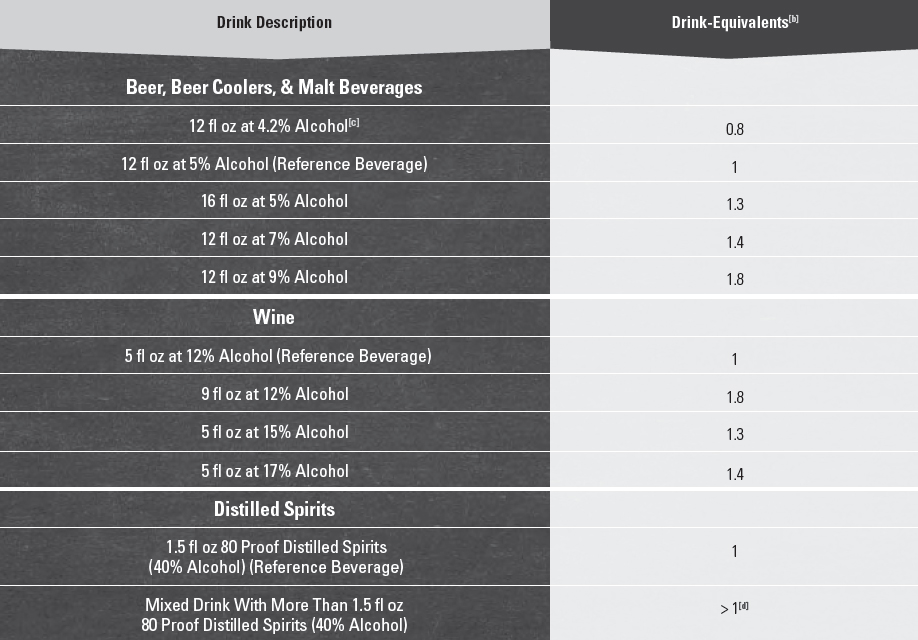
[a] One alcoholic drink-equivalent is defined as containing 14 grams (0.6 fl oz) of pure alcohol. The following are reference beverages that are one alcoholic drink-equivalent: 12 fluid ounces of regular beer (5% alcohol), 5 fluid ounces of wine (12% alcohol), or 1.5 fluid ounces of 80 proof distilled spirits (40% alcohol). Drink-equivalents are not intended to serve as a standard drink definition for regulatory purposes.
[b] To calculate drink-equivalents, multiply the volume in ounces by the alcohol content in percent and divide by 0.6 ounces of alcohol per drink-equivalent. For example: 16 fl oz beer at 5% alcohol: (16 fl oz)(0.05)/0.6 fl oz = 1.3 drink-equivalents.
[c] Light beer represents a substantial proportion of alcoholic beverages consumed in the United States. Light beer is approximately 4.2% alcohol or 0.8 alcoholic drink-equivalents in 12 fluid ounces.
[d] Depending on factors, such as the type of spirits and the recipe, one mixed drink can contain a variable number of drink-equivalents.
Binge drinking is the consumption within about 2 hours of 4 or more drinks for women and 5 or more drinks for men.
Excessive alcohol consumption—which includes binge drinking (4 or more drinks for women and 5 or more drinks for men within about 2 hours); heavy drinking (8 or more drinks a week for women and 15 or more drinks a week for men); and any drinking by pregnant women or those under 21 years of age—has no benefits. Excessive drinking is responsible for 88,000 deaths in the United States each year, including 1 in 10 deaths among working age adults (age 20-64 years). In 2006, the estimated economic cost to the United States of excessive drinking was $224 billion.[4] Binge drinking accounts for over half of the deaths and three-fourths of the economic costs due to excessive drinking.[1],[5]
Excessive drinking increases the risk of many chronic diseases and violence[6] and, over time, can impair short- and long-term cognitive function.[7] Over 90 percent of U.S. adults who drink excessively report binge drinking, and about 90 percent of the alcohol consumed by youth under 21 years of age in the United States is in the form of binge drinks. Binge drinking is associated with a wide range of health and social problems, including sexually transmitted diseases, unintended pregnancy, accidental injuries, and violent crime.[8]
Those Who Should Not Consume Alcohol
Many individuals should not consume alcohol, including individuals who are taking certain over-the-counter or prescription medications or who have certain medical conditions, those who are recovering from alcoholism or are unable to control the amount they drink, and anyone younger than age 21 years. Individuals should not drink if they are driving, planning to drive, or are participating in other activities requiring skill, coordination, and alertness.[9]
Women who are or who may be pregnant should not drink. Drinking during pregnancy, especially in the first few months of pregnancy, may result in negative behavioral or neurological consequences in the offspring. No safe level of alcohol consumption during pregnancy has been established.[10] Women who are breastfeeding should consult with their health care provider regarding alcohol consumption.[11]
Alcohol & Caffeine
Mixing alcohol and caffeine is not generally recognized as safe by the FDA.[12] People who mix alcohol and caffeine may drink more alcohol and become more intoxicated than they realize, increasing the risk of alcohol-related adverse events. Caffeine does not change blood alcohol content levels, and thus, does not reduce the risk of harms associated with drinking alcohol.[13]
[1] Bowman SA, Clemens JC, Friday JE, Thoerig RC, and Moshfegh AJ. 2014. Food Patterns Equivalents Database 2011-12: Methodology and User Guide [Online]. Food Surveys Research Group, Beltsville Human Nutrition Research Center, Agricultural Research Service, U.S. Department of Agriculture, Beltsville, Maryland. Available at: http://www.ars.usda.gov/nea/bhnrc/fsrg. Accessed November 3, 2015. For additional information see the National Institute on Alcohol Abuse and Alcoholism (NIAAA) webpage available at: http://rethinkingdrinking.niaaa.nih.gov/.
[2] Drink-equivalents are not intended to serve as a standard drink definition for regulatory purposes.
[3] Calorie values are estimates, as different brands and types of beverages differ in ingredients and portion sizes and vary in their actual calorie content. For calculators to evaluate the calorie and alcohol content of alcoholic beverages, see: National Institute on Alcohol Abuse and Alcoholism (NIAAA). National Institutes of Health. Rethinking drinking, alcohol, and your health. Calculators. Available at: http://rethinkingdrinking.niaaa.nih.gov/ToolsResources/CalculatorsMain.asp. Accessed September 14, 2015.
[4] Stahre M, Roeber J, Kanny D, Brewer RD, Zhang X. Contribution of excessive alcohol consumption to deaths and years of potential life lost in the United States. Prev Chroni c Dis 2014;11:130293.
[5] Bouchery EE, Harwood HJ, Sacks JJ, Simon CJ, Brewer RD. Economic costs of excessive alcohol consumption in the United States, 2006. Am J Prev Med. 2011;41:516-24.
[6] For more information, see: Centers for Disease Control and Prevention. Alcohol use and your health. Available at: http://www.cdc.gov/alcohol/fact-sheets/alcohol-use.htm. Accessed August 26, 2015.
[7] For more information, see: National Institute on Alcohol Abuse and Alcoholism (NIAAA). National Institutes of Health. Alcohol’s effects on the body. Available at: http://www.niaaa.nih.gov/alcohol-health/alcohols-effects-body. Accessed August 26, 2015.
[8] For more information, see: Centers for Disease Control and Prevention. Fact sheets - Binge drinking. January 16, 2014. [Updated October 16, 2015.] Available at: http://www.cdc.gov/alcohol/fact-sheets/binge-drinking.htm. Accessed August 26, 2015.
[9] For more information, see: Centers for Disease Control and Prevention. Alcohol use and your health. Available at: http://www.cdc.gov/alcohol/fact-sheets/alcohol-use.htm. Accessed August 26, 2015.
[10] For more information, see: Centers for Disease Control and Prevention. What you should know about alcohol and pregnancy. August 28, 2014. Available at: http://www.cdc.gov/features/alcoholandpregnancy/. Accessed August 26, 2015.
[11] Section on Breastfeeding, American Academy of Pediatrics. AAP Policy Statement: Breastfeeding and the use of human milk. Pediatrics 2012;129(3):e827-e841. A vailable at: www.pediatrics.org/cgi/doi/10.1542/peds.2011-3552. Accessed September 15, 2015.
[12] For more information, see: Food and Drug Administration. Update on caffeinated alcoholic beverages. [Updated November 24, 2010.] Available at: http://www.fda.gov/NewsEvents/PublicHealthFocus/ucm234900.htm. Accessed September 16, 2015.
[13] For more information regarding caffeine and alcohol, see CDC’s Alcohol and Public Health webpage. Available at: http://www.cdc.gov/alcohol/fact-sheets/caffeine-and-alcohol.htm. Accessed August 26, 2015.
Appendix 10.
Food Sources of Potassium
Table A10-1.
Potassium: Food Sources Ranked by Amounts of Potassium & Energy per Standard Food Portions & per 100 Grams of Foods
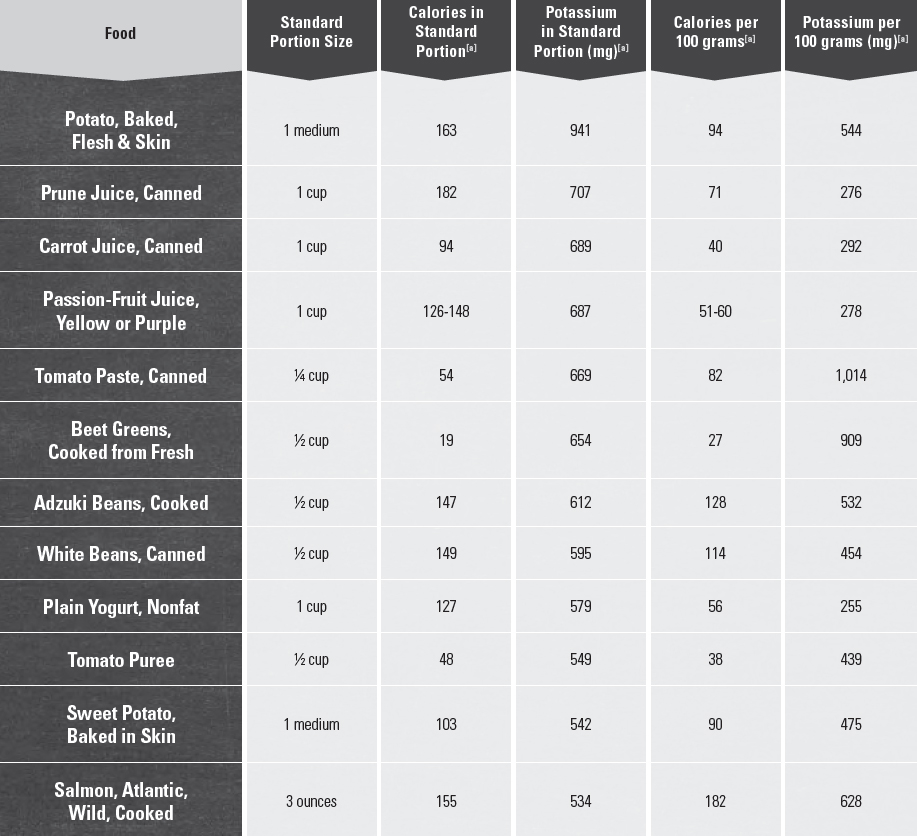
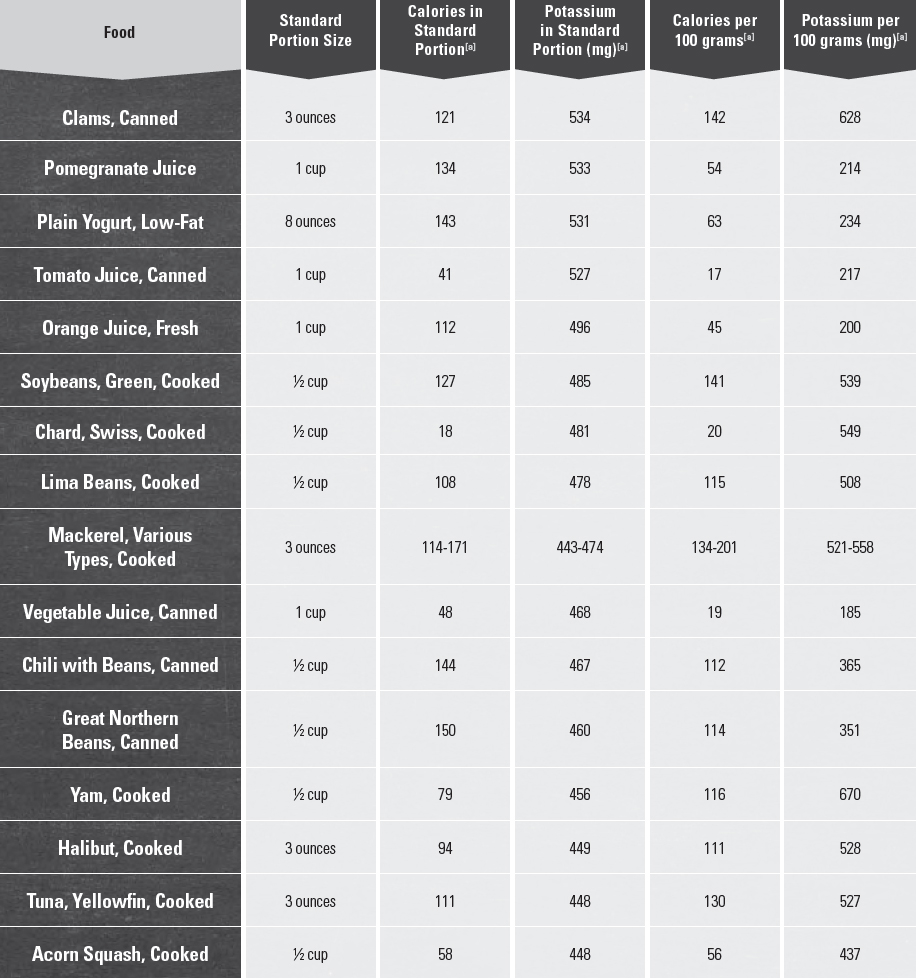
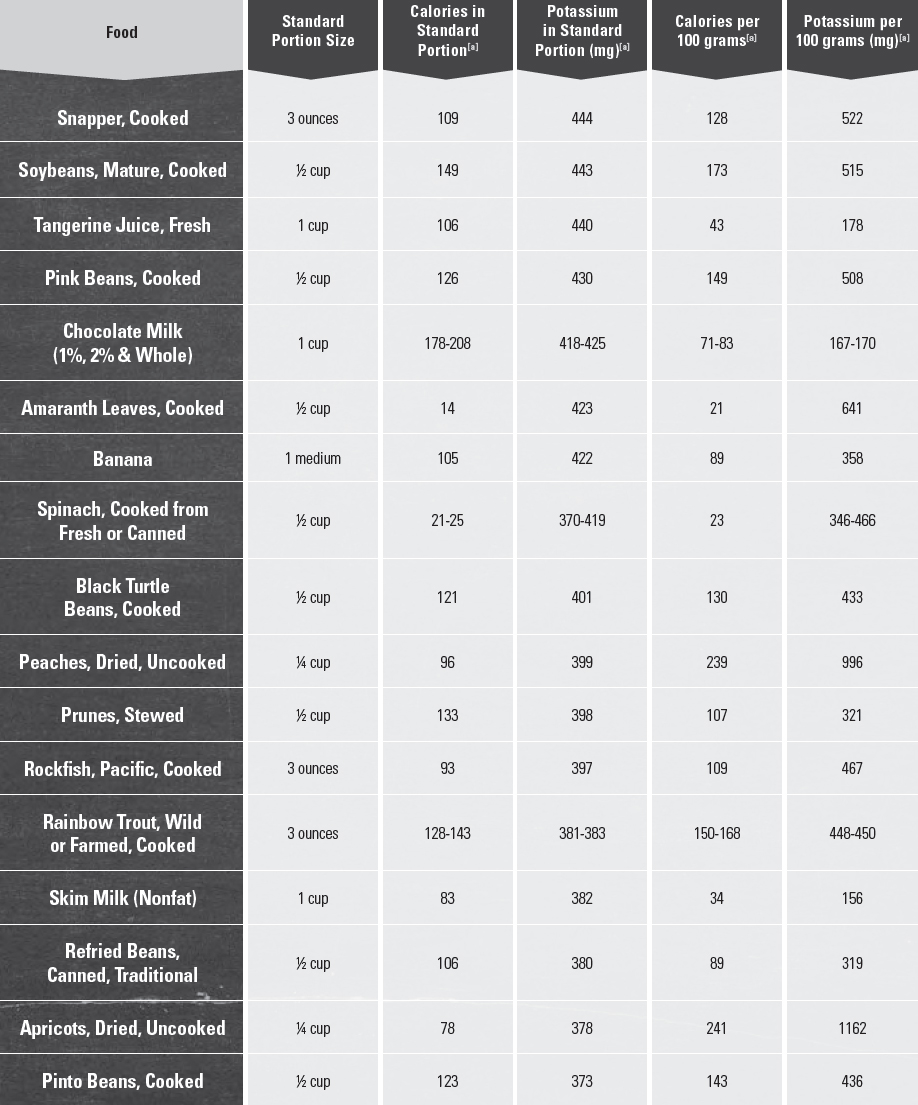
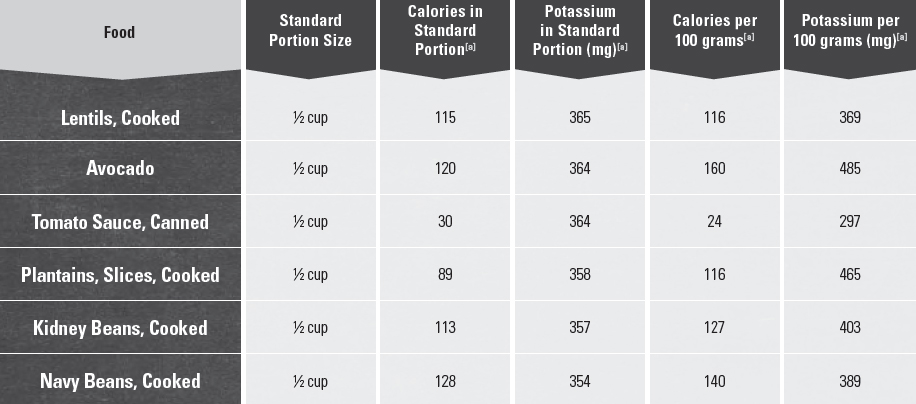
[a] Source: U.S Department of Agriculture, Agricultural Research Service, Nutrient Data Laboratory. 2014. USDA National Nutrient Database for Standard Reference, Release 27. Available at: http://www.ars.usda.gov/nutrientdata.
Appendix 11.
Food Sources of Calcium
Table A11-1.
Calcium: Food Sources Ranked by Amounts of Calcium & Energy per Standard Food Portions & per 100 Grams of Foods
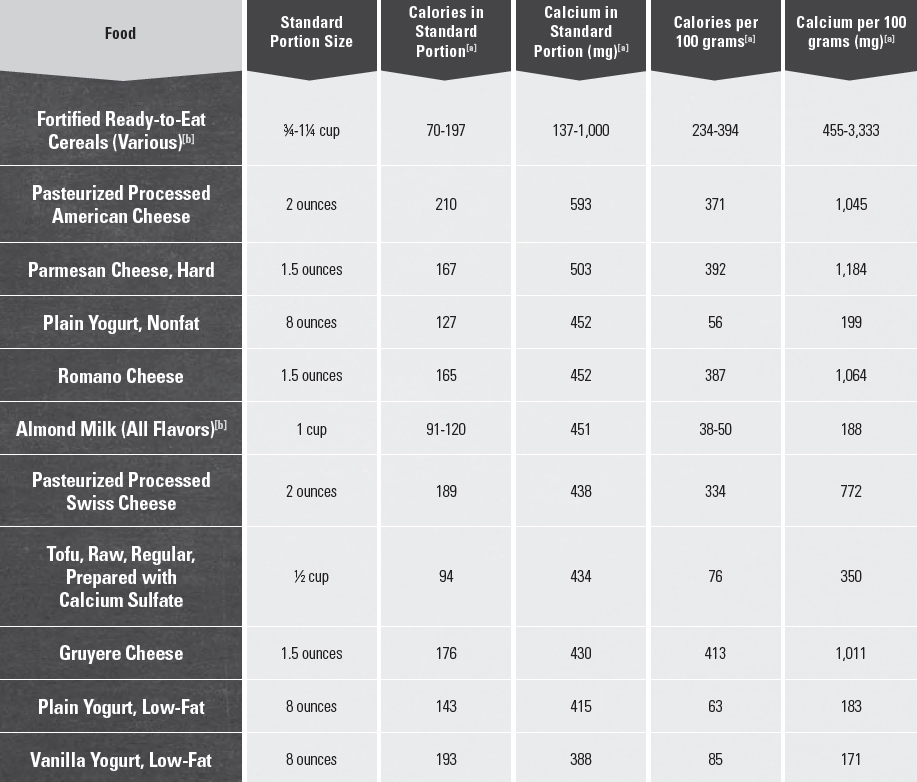
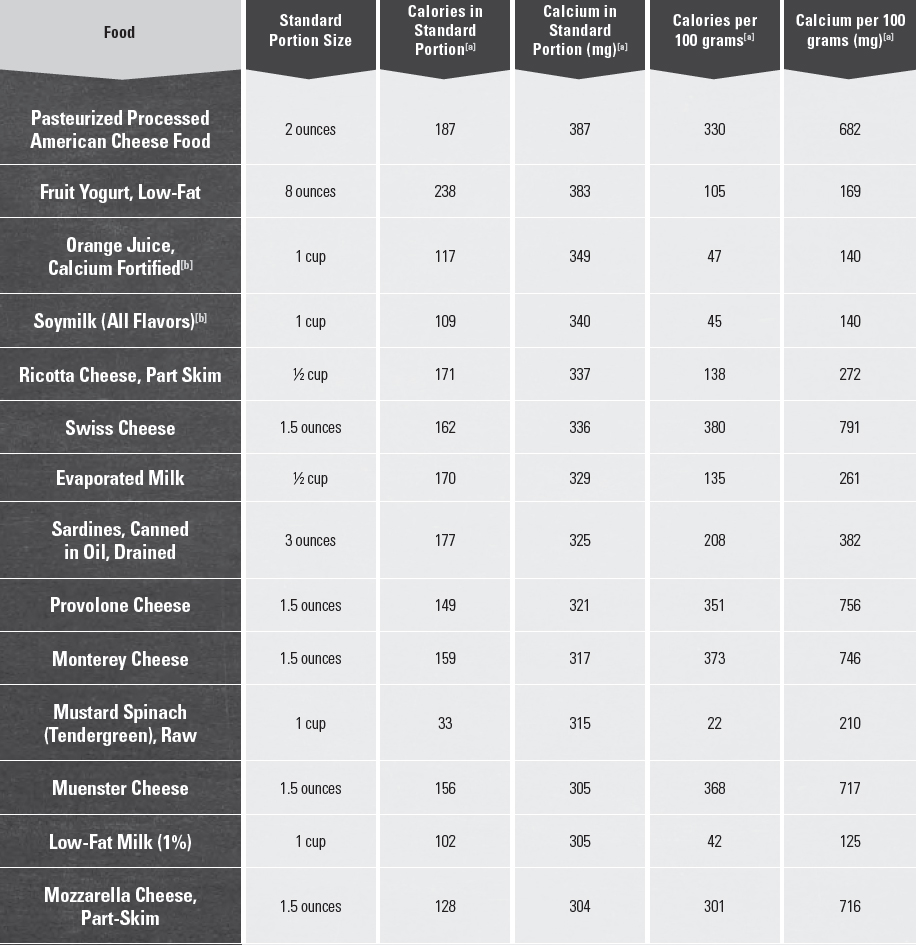
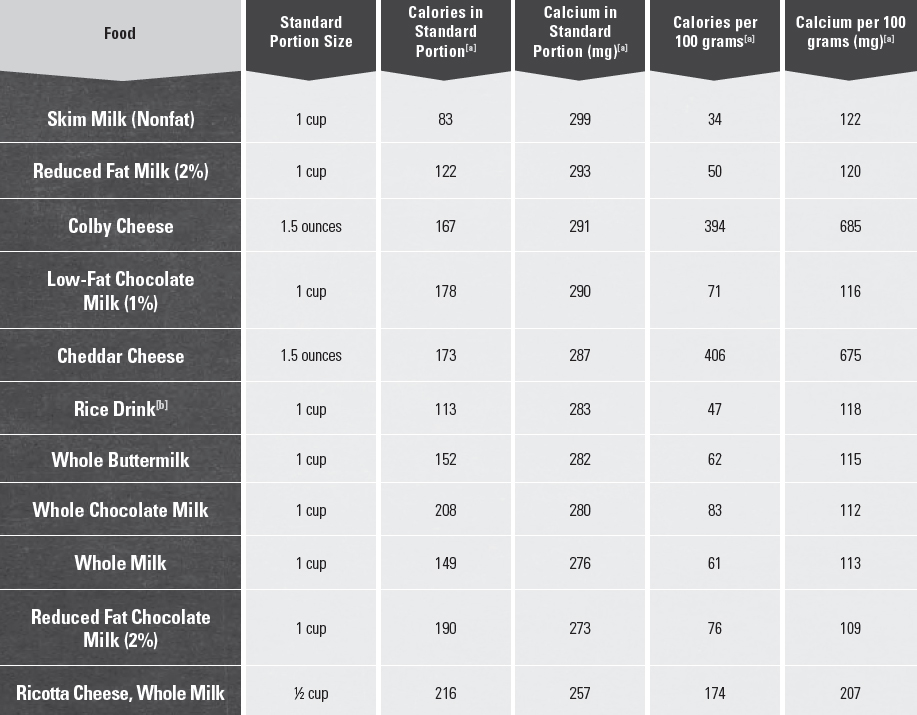
[a] Source: U.S Department of Agriculture, Agricultural Research Service, Nutrient Data Laboratory. 2014. USDA National Nutrient Database for Standard Reference, Release 27. Available at: http://www.ars.usda.gov/nutrientdata.
[b] Calcium fortified.
Appendix 12.
Food Sources of Vitamin D
Table A12-1.
Vitamin D: Food Sources Ranked by Amounts of Vitamin D & Energy per Standard Food Portions & per 100 Grams of Foods
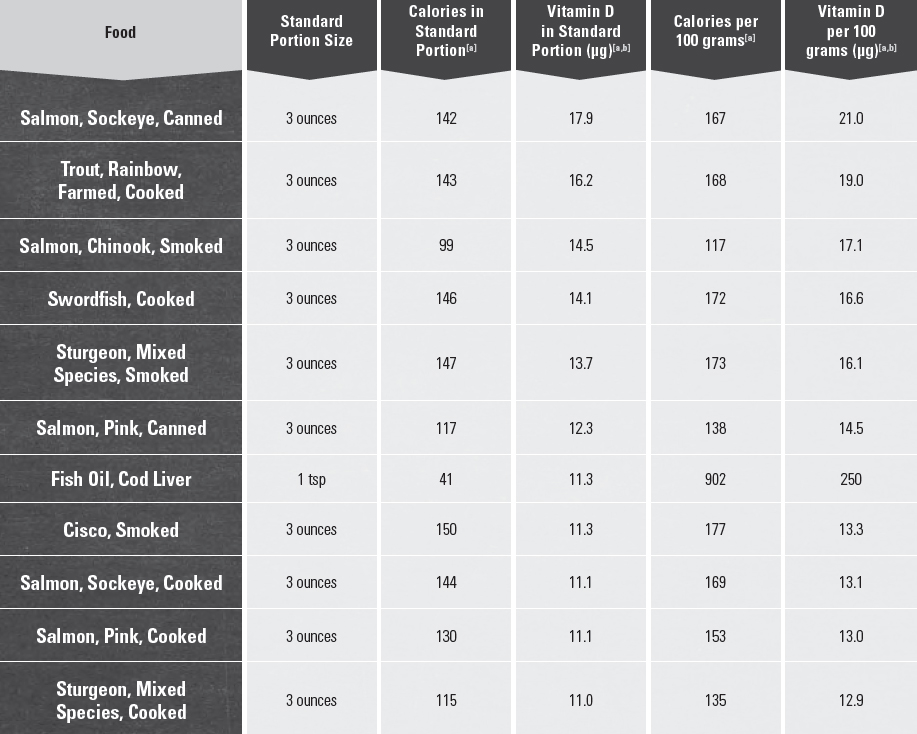
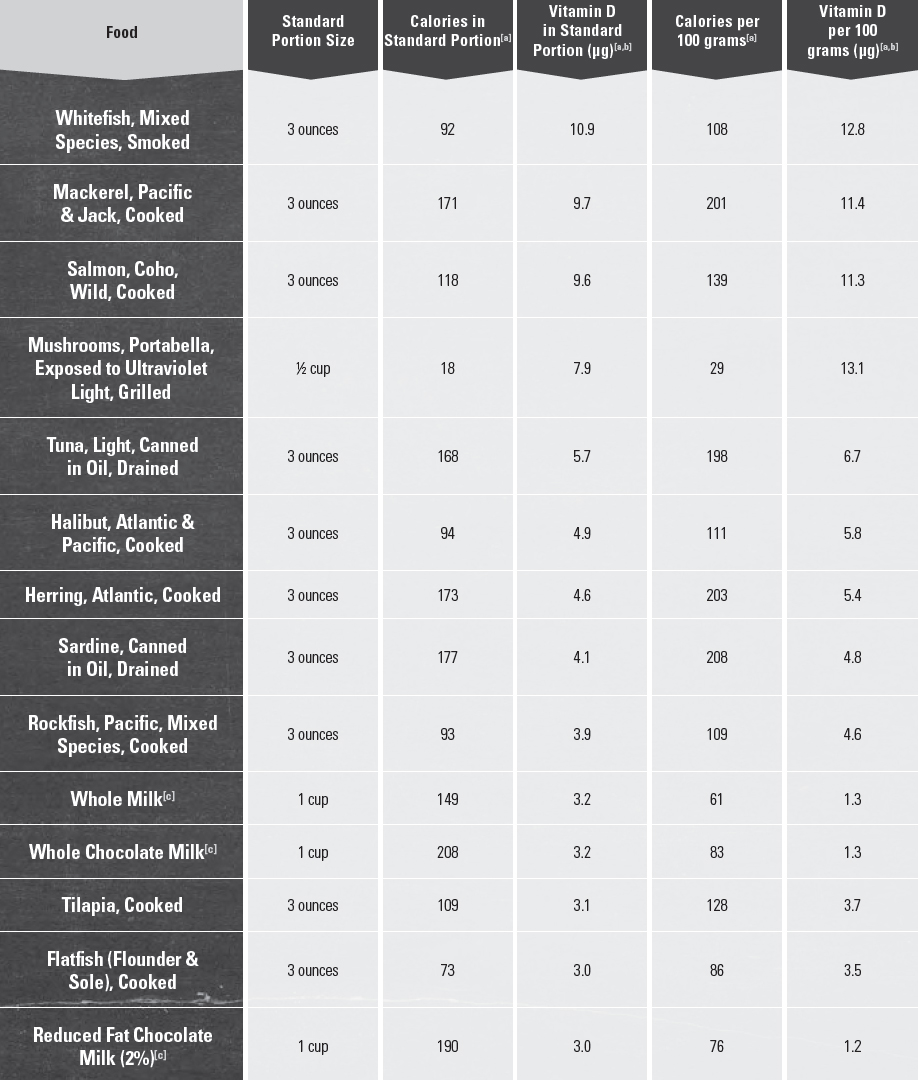

[a] Source: U.S Department of Agriculture, Agricultural Research Service, Nutrient Data Laboratory. 2014. USDA National Nutrient Database for Standard Reference, Release 27. Available at: http://www.ars.usda.gov/nutrientdata.
[b] 1 μg of vitamin D is equivalent to 40 IU.
[c] Vitamin D fortified.
Appendix 13.
Food Sources of Dietary Fiber
Table A13-1.
Dietary Fiber: Food Sources Ranked by Amounts of Dietary Fiber & Energy per Standard Food Portions & per 100 Grams of Foods
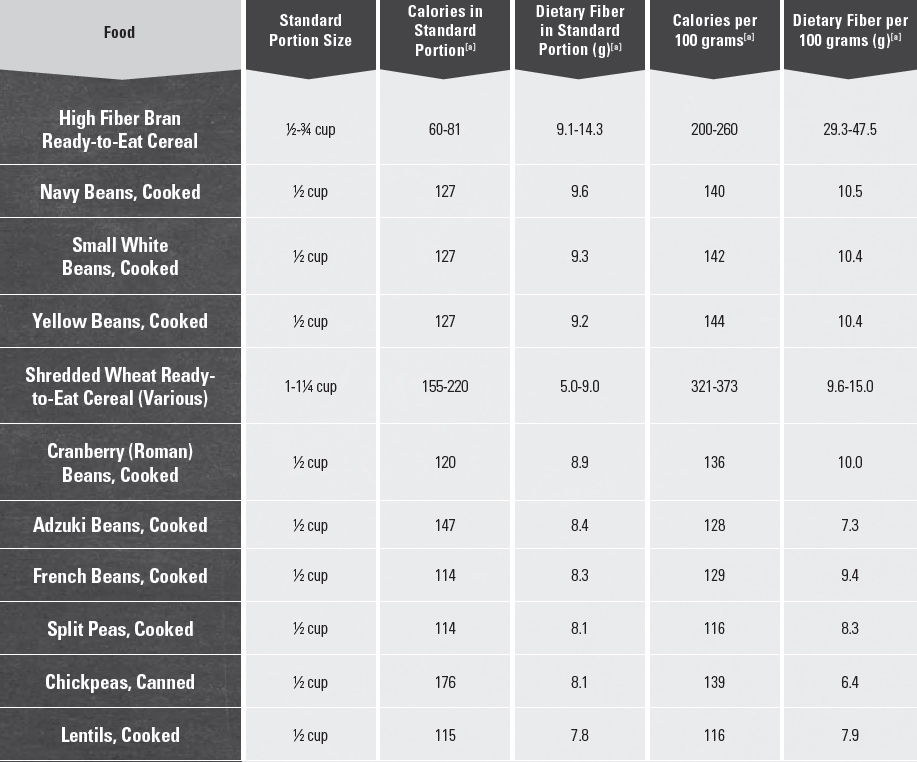
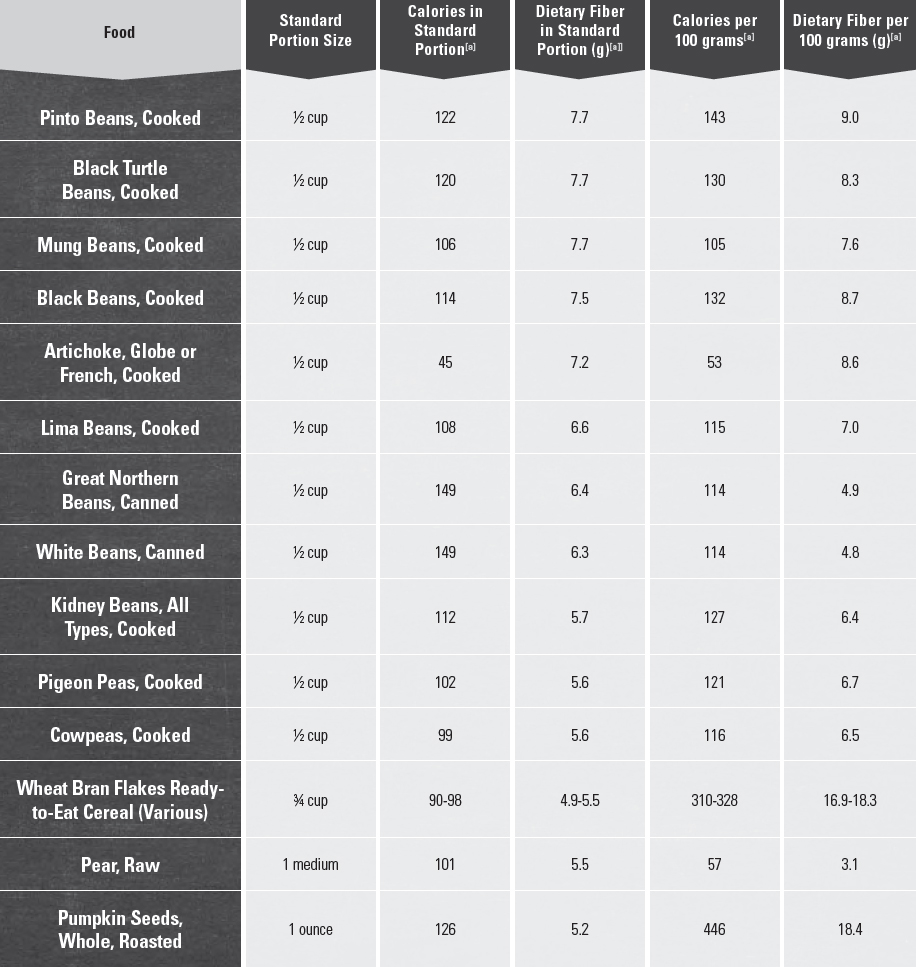
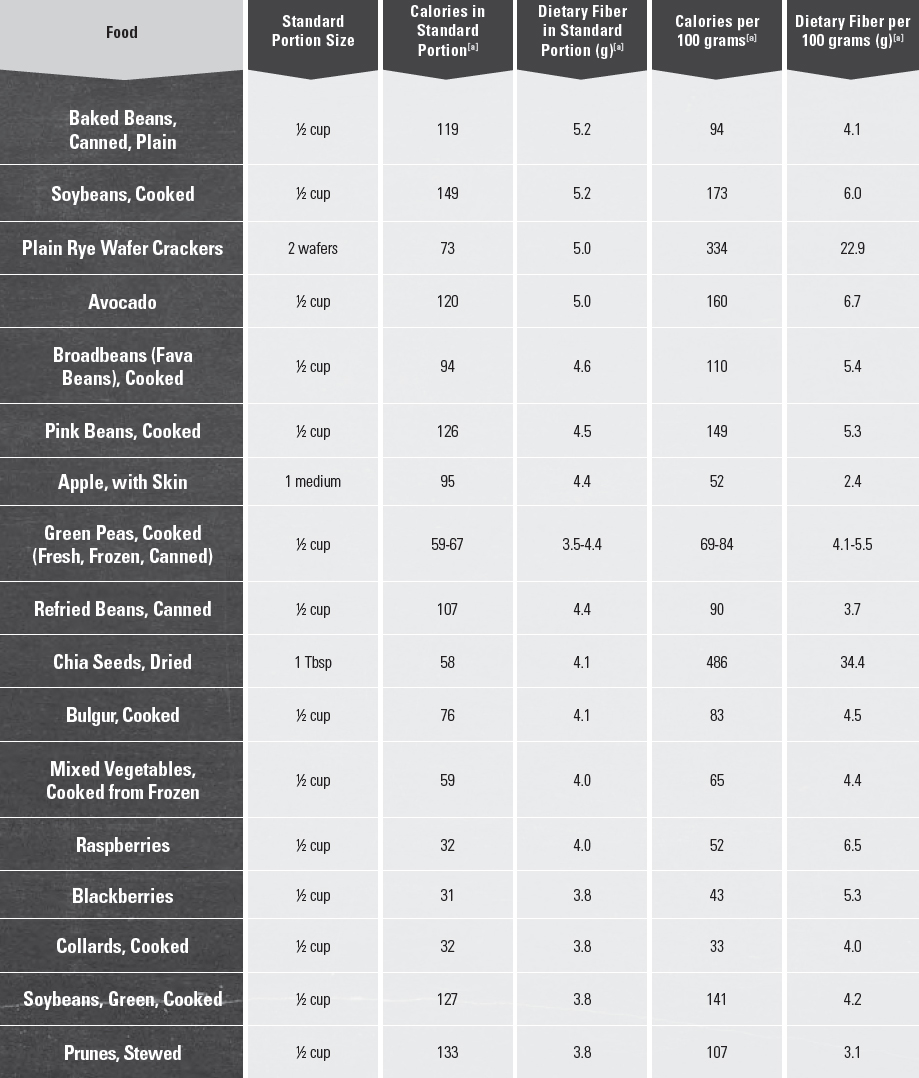
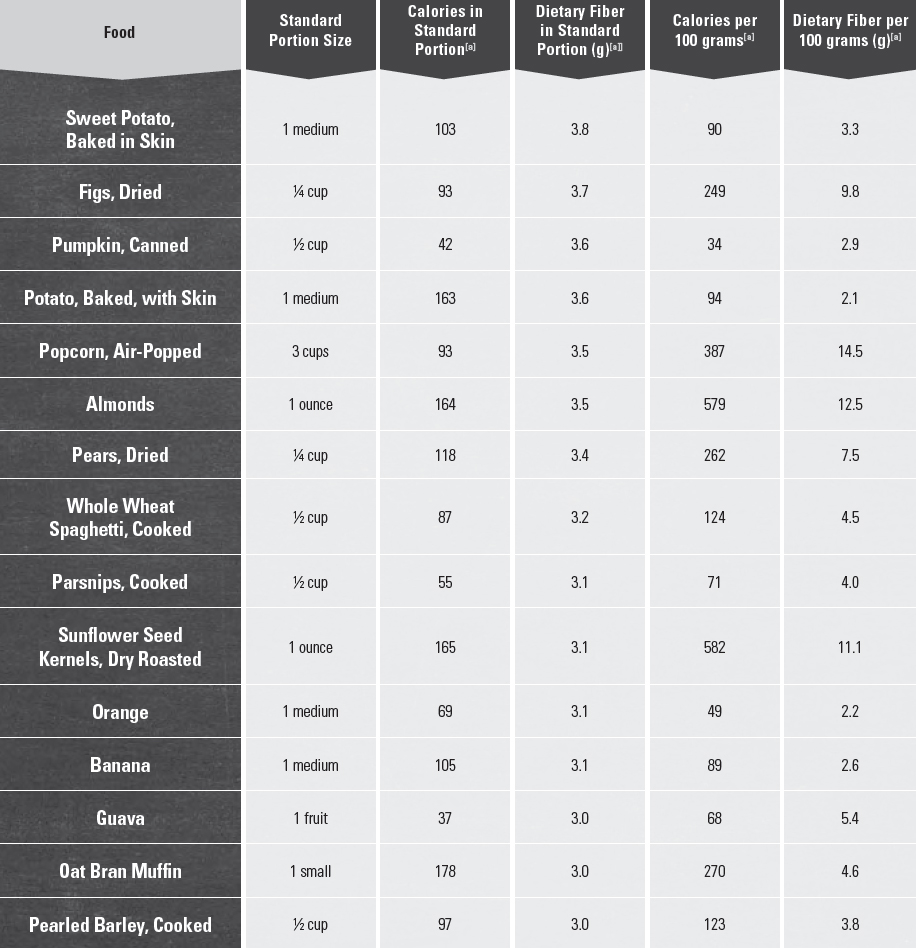
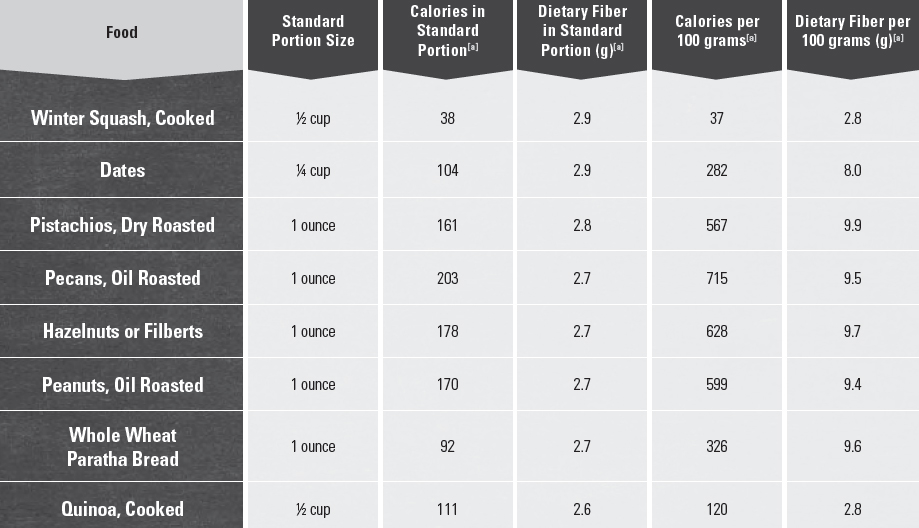
[a] Source: U.S Department of Agriculture, Agricultural Research Service, Nutrient Data Laboratory. 2014. USDA National Nutrient Database for Standard Reference, Release 27. Available at: http://www.ars.usda.gov/nutrientdata.
Appendix 14.
Food Safety Principles & Guidance
An important part of healthy eating is keeping foods safe. It is estimated that foodborne illness affects about 1 in 6 Americans (or 48 million people), leading to 128,000 hospitalizations and 3,000 deaths every year.[1] Food may be handled numerous times as it moves from the farm to homes. Individuals in their own homes can reduce contaminants and help keep food safe to eat by following safe food handling practices. Four basic food safety principles work together to reduce the risk of foodborne illness—Clean, Separate, Cook, and Chill. These four principles are the cornerstones of Fight BAC!®, a national food safety education campaign aimed at consumers.
Clean
Microbes, such as bacteria and viruses, can be spread throughout the kitchen and get onto hands, cutting boards, utensils, countertops, reusable grocery bags, and foods. This is called “cross-contamination.” Hand washing is important to prevent contamination of food with microbes from raw animal products (e.g., raw seafood, meat, poultry, and eggs) and from people (e.g., cold, flu, and Staph infections). Frequent cleaning of surfaces is essential in preventing cross-contamination. To reduce microbes and contaminants from foods, all produce, regardless of where it was grown or purchased, should be thoroughly rinsed. This is particularly important for produce that will be eaten raw.
Hands
Hands should be washed before and after preparing food, especially after handling raw seafood, meat, poultry, or eggs, and before eating. In addition, hand washing is recommended after going to the bathroom, changing diapers, coughing or sneezing, tending to someone who is sick or injured, touching animals, and handling garbage. Hands should be washed using soap and water. Soaps with antimicrobial agents are not needed for consumer hand washing, and their use over time can lead to growth of microbes resistant to these agents. Alcohol-based (≥ 60%), rinse-free hand sanitizers should be used when hand washing with soap is not possible. Hand sanitizers are not as effective when hands are visibly dirty or greasy.
Wash Hands With Soap & Water
• Wet hands with clean running water (warm or cold), turn off tap, and apply soap.
• Rub hands together to make lather and scrub the back of hands, between fingers, and under nails for at least 20 seconds. If you need a timer you can hum the “happy birthday” song from beginning to end twice.
• Rinse hands well under running water.
• Dry hands using a clean towel or air dry them.
Surfaces
Surfaces should be washed with hot, soapy water. A solution of 1 tablespoon of unscented, liquid chlorine bleach per gallon of water can be used to sanitize surfaces. All kitchen surfaces should be kept clean, including tables, countertops, sinks, utensils, cutting boards, and appliances. For example, the insides of microwaves easily become soiled with food, allowing microbes to grow. They should be cleaned often.
Keep Appliances Clean
• At least once a week, throw out refrigerated foods that should no longer be eaten.
• Cooked leftovers should be discarded after 4 days; raw poultry and ground meats, 1 to 2 days.
• Wipe up spills immediately—clean food-contact surfaces often.
• Clean the inside and the outside of appliances. Pay particular attention to buttons and handles where cross-contamination to hands can occur.
Foods
Vegetables & Fruits. All produce, regardless of where it was grown or purchased, should be thoroughly rinsed. However, any precut packaged items, like lettuce or baby carrots, are labeled as prewashed and ready-to-eat. These products can be eaten without further rinsing.
• Rinse fresh vegetables and fruits under running water just before eating, cutting, or cooking.
• Do not use soap or detergent to clean produce; commercial produce washes are not needed.
• Even if you plan to peel or cut the produce before eating, it is still important to thoroughly rinse it first to prevent microbes from transferring from the outside to the inside of the produce.
• Scrub the skin or rind of firm produce, such as melons and cucumbers, with a clean produce brush while you rinse it.
• Dry produce with a clean cloth towel or paper towel to further reduce bacteria that may be present. Wet produce can allow remaining microbes to multiply faster.
Seafood, Meat, & Poultry. Raw seafood, meat, and poultry should not be rinsed. Bacteria in these raw juices can spread to other foods, utensils, and surfaces, leading to foodborne illness.
Separate
Separating foods that are ready-to-eat from those that are raw or that might otherwise contain harmful microbes is key to preventing foodborne illness. Attention should be given to separating foods at every step of food handling, from purchase to preparation to serving.
Separate Foods When Shopping
• Place raw seafood, meat, and poultry in plastic bags. Separate them from other foods in your grocery cart and bags.
• Store raw seafood, meat, and poultry below ready-to-eat foods in your refrigerator.
• Clean reusable grocery bags regularly. Wash canvas and cloth bags in the washing machine and wash plastic reusable bags with hot, soapy water.
Separate Foods When Preparing & Serving Food
• Always use a clean cutting board for fresh produce and a separate one for raw seafood, meat, and poultry.
• Always use a clean plate to serve and eat food.
• Never place cooked food back on the same plate or cutting board that previously held raw food.
Cook & Chill
Seafood, meat, poultry, and egg dishes should be cooked to the recommended safe minimum internal temperature to destroy harmful microbes (see Table A14-1). It is not always possible to tell whether a food is safe by how it looks. A food thermometer should be used to ensure that food is safely cooked and that cooked food is held at safe temperatures until eaten. In general, the food thermometer should be placed in the thickest part of the food, not touching bone, fat, or gristle. The manufacturer’s instructions should be followed for the amount of time needed to measure the temperature of foods. Food thermometers should be cleaned with hot, soapy water before and after each use.
Temperature rules also apply to microwave cooking. Microwave ovens can cook unevenly and leave “cold spots” where harmful bacteria can survive. When cooking using a microwave, foods should be stirred, rotated, and/or flipped periodically to help them cook evenly. Microwave cooking instructions on food packages always should be followed.
Keep Foods at Safe Temperatures
• Hold cold foods at 40°F or below.
• Keep hot foods at 140°F or above.
• Foods are no longer safe to eat when they have been in the danger zone of 40-140°F for more than 2 hours (1 hour if the temperature was above 90°F).
When shopping, the 2-hour window includes the amount of time food is in the grocery basket, car, and on the kitchen counter.
As soon as frozen food begins to thaw and become warmer than 40°F, any bacteria that may have been present before freezing can begin to multiply. Use one of the three safe ways to thaw foods: (1) in the refrigerator, (2) in cold water (i.e., in a leak proof bag, changing cold water every 30 minutes), or (3) in the microwave. Never thaw food on the counter. Keep your refrigerator at 40°F or below.
• Keep your freezer at 0°F or below. Monitor these temperatures with appliance thermometers.
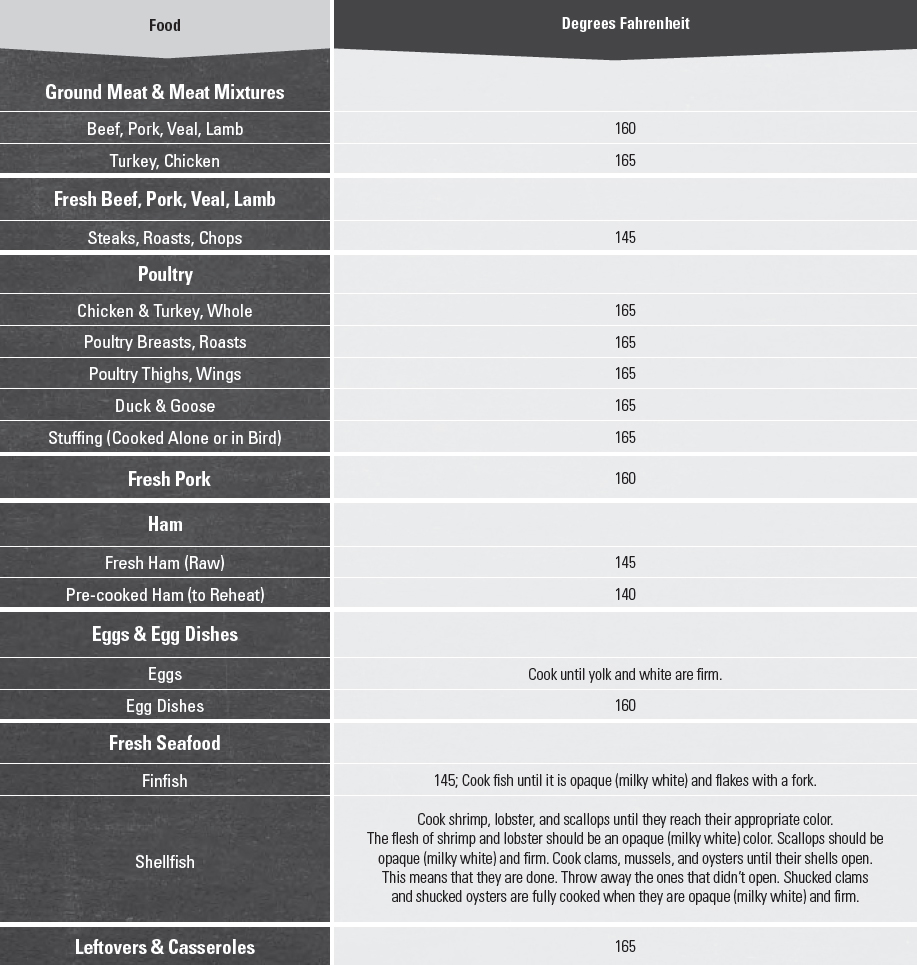
Table A14-1.
Recommended Safe Minimum Internal Temperatures
Consumers should cook foods to the minimum internal temperatures shown below. The temperature should be measured with a clean food thermometer before removing meat from the heat source. For safety and quality, allow meat to rest for at least 3 minutes before carving or consuming. For reasons of personal preference, consumers may choose to cook meat to higher temperatures.
Risky Eating Behaviors
Harmful bacteria, viruses, and parasites usually do not change the look or smell of food. This makes it impossible for consumers to know whether food is contaminated. Consumption of raw or undercooked animal food products increases the risk of contracting a foodborne illness. Raw or undercooked foods commonly eaten in the United States include eggs (e.g., eggs with runny yolks), ground beef (e.g., undercooked hamburger), dairy (e.g., cheese made from unpasteurized milk), and seafood (e.g., raw oysters). Cooking foods to recommended safe minimum internal temperatures and consuming only pasteurized dairy products are the best ways to reduce the risk of foodborne illness from animal products. Always use pasteurized eggs or egg products when preparing foods that are made with raw eggs (e.g., eggnog, smoothies and other drinks, hollandaise sauce, ice cream, and uncooked cookie dough). Consumers who choose to eat raw seafood despite the risks should choose seafood that has been previously frozen, which will kill parasites but not harmful microbes.
Specific Populations at Increased Risk of Foodborne Illness
Some individuals, including women who are pregnant and their unborn children, young children, older adults, and individuals with weakened immune systems (such as those living with HIV infection, cancer treatment, organ transplant, or liver disease), are more susceptible than the general population to the effects of foodborne illnesses such as listeriosis and salmonellosis. The outcome of contracting a foodborne illness for these individuals can be severe or even fatal. They need to take special care to keep foods safe and to not eat foods that increase the risk of foodborne illness. Women who are pregnant, infants and young children, older adults, and people with weakened immune systems should only eat foods containing seafood, meat, poultry, or eggs that have been cooked to recommended safe minimum internal temperatures. They also should take special precautions not to consume unpasteurized (raw) juice or milk or foods made from unpasteurized milk, like some soft cheeses (e.g., Feta, queso blanco, queso fresco, Brie, Camembert cheeses, blue-veined cheeses, and Panela). They should reheat deli and luncheon meats and hot dogs to steaming hot to kill Listeria, the bacteria that causes listeriosis, and not eat raw sprouts, which also can carry harmful bacteria.
Resources for Additional Food Safety Information
Federal Food Safety Gateway: www.foodsafety.gov
Fight BAC!®: www.fightbac.org
Be Food Safe: www.befoodsafe.gov
Is It Done Yet?: www.isitdoneyet.gov
For more information and answers to specific questions:
• Call the USDA Meat and Poultry Hotline 1-888-MPHotline (1-888- 674-6854) TTY: 1-800- 256-7072. Hours: 10:00 a.m. to 4:00 p.m. Eastern time, Monday through Friday, in English and Spanish, or email: mphotline.fsis@usda.gov
• Visit “Ask Karen,” FSIS’s Web-based automated response system at www.fsis.usda.gov
[1] http://www.cdc.gov/foodborneburden/. Accessed June 1, 2015.