
CHAPTER |
Shifts Needed To Align With Healthy Eating Patterns |
Introduction
Following healthy eating patterns is vital to health. This chapter provides a snapshot of current eating patterns of people in the United States in comparison to the recommendations in Chapter 1. Key Elements of Healthy Eating Patterns and describes shifts that are needed to align current intakes to recommendations. In some cases, the news is good—for certain aspects of eating patterns, some individuals are following the guidance or are close to meeting the recommendations. However, other aspects of the diet are far from the recommendations. Most Americans would benefit from shifting food choices both within and across food groups and from current food choices to nutrient-dense choices. Some shifts that are needed are minor and can be accomplished by making simple substitutions, while others will require greater effort to accomplish.
About This Chapter
This chapter focuses on the fourth Dietary Guideline:
1. Follow a healthy eating pattern across the lifespan. All food and beverage choices matter. Choose a healthy eating pattern at an appropriate calorie level to help achieve and maintain a healthy body weight, support nutrient adequacy, and reduce the risk of chronic disease.
2. Focus on variety, nutrient density, and amount. To meet nutrient needs within calorie limits, choose a variety of nutrient-dense foods across and within all food groups in recommended amounts.
3. Limit calories from added sugars and saturated fats and reduce sodium intake. Consume an eating pattern low in added sugars, saturated fats, and sodium. Cut back on foods and beverages higher in these components to amounts that fit within healthy eating patterns.
4. Shift to healthier food and beverage choices. Choose nutrient-dense foods and beverages across and within all food groups in place of less healthy choices. Consider cultural and personal preferences to make these shifts easier to accomplish and maintain.
5. Support healthy eating patterns for all. Everyone has a role in helping to create and support healthy eating patterns in multiple settings nationwide, from home to school to work to communities.
The chapter includes quantitative information on intakes and common sources of food groups, their subgroups, and other dietary components, including nutrients. The chapter also includes strategies to help shift current eating patterns toward the healthy patterns described in Chapter 1. Complementary strategies to support individuals in their effort to make shifts are discussed in greater detail in Chapter 3. Everyone Has a Role in Supporting Healthy Eating Patterns.
Current Eating Patterns in the United States
The typical eating patterns currently consumed by many in the United States do not align with the Dietary Guidelines. As shown in Figure 2-1, when compared to the Healthy U.S.-Style Pattern:
• About three-fourths of the population has an eating pattern that is low in vegetables, fruits, dairy, and oils.
• More than half of the population is meeting or exceeding total grain and total protein foods recommendations, but, as discussed later in the chapter, are not meeting the recommendations for the subgroups within each of these food groups.
• Most Americans exceed the recommendations for added sugars, saturated fats, and sodium.
In addition, the eating patterns of many are too high in calories. Calorie intake over time, in comparison to calorie needs, is best evaluated by measuring body weight status. The high percentage of the population that is overweight or obese suggests that many in the United States overconsume calories. As documented in the Introduction, Table I-1, more than two-thirds of all adults and nearly one-third of all children and youth in the United States are either overweight or obese.
Current eating patterns can be moved toward healthier eating patterns by making shifts in food choices over time. Making these shifts can help support a healthy body weight, meet nutrient needs, and lessen the risk for chronic disease.
The following sections highlight average intakes of the food groups and other dietary components for age-sex groups and show that, in some cases, individuals are close to meeting recommendations, but in others, more substantial change is needed. They also provide examples of foods commonly consumed. Understanding what current intakes are and how food groups and other dietary components are consumed can help inform shifts that are needed to support healthy eating patterns.
In this chapter, intakes of food groups and other dietary components are described in two ways:
1. the total amount consumed from all sources in comparison to recommendations or limits, and 2. the proportion of this intake that comes from different food categories based on the form in which foods are eaten—such as soups, sandwiches, or burritos. The What We Eat in American (WWEIA) Food Categories[1] provide insight into the sources of food group and nutrient intakes and are therefore useful in identifying strategies to improve eating patterns.
Figure 2-1.
Dietary Intakes Compared to Recommendations. Percent of the U.S. Population Ages 1 Year & Older Who Are Below, At, or Above Each Dietary Goal or Limit

NOTE: The center (0) line is the goal or limit. For most, those represented by the orange sections of the bars, shifting toward the center line will improve their eating pattern.
DATA SOURCES: What We Eat in America, NHANES 2007-2010 for average intakes by age-sex group. Healthy U.S.-Style Food Patterns, which vary based on age, sex, and activity level, for recommended intakes and limits.
Figure 2-2.
Empower People To Make Healthy Shifts
Making changes to eating patterns can be overwhelming. That’s why it’s important to emphasize that every food choice is an opportunity to move toward a healthy eating pattern. Small shifts in food choices—over the course of a week, a day, or even a meal—can make a big difference. Here are some ideas for realistic, small shifts that can help people adopt healthy eating patterns.
Changing Physical Activity Patterns for a Healthy Lifestyle
Current Physical Activity:
Only 20 percent of adults meet the Physical Activity Guidelines for aerobic and muscle-strengthening activity. Males are more likely to report doing regular physical activity compared to females (24% of males versus 17% of females meet recommendations), and this difference is more pronounced between adolescent boys and girls (30% of males versus 13% of females meet recommendations). Despite evidence that increments of physical activity as short as 10 minutes at a time can be beneficial, about 30 percent of adults report engaging in no leisure time physical activity. Disparities also exist; individuals with lower income and those with lower educational attainment have lower rates of physical activity and are more likely to not engage in leisure time physical activity.
Overall, physical activity associated with work, home, and transportation has declined in recent decades and can be attributed to less active occupations; reduced physical activity for commuting to work, school, or for errands; and increased sedentary behavior often associated with television viewing and other forms of screen time.

Shift Physical Activity Choices:
Most individuals would benefit from making shifts to increase the amount of physical activity they engage in each week. Individuals would also benefit from limiting screen time and decreasing the amount of time spent being sedentary.
Figure 2-3.
Average Daily Food Group Intakes by Age-Sex Groups, Compared to Ranges of Recommended Intake
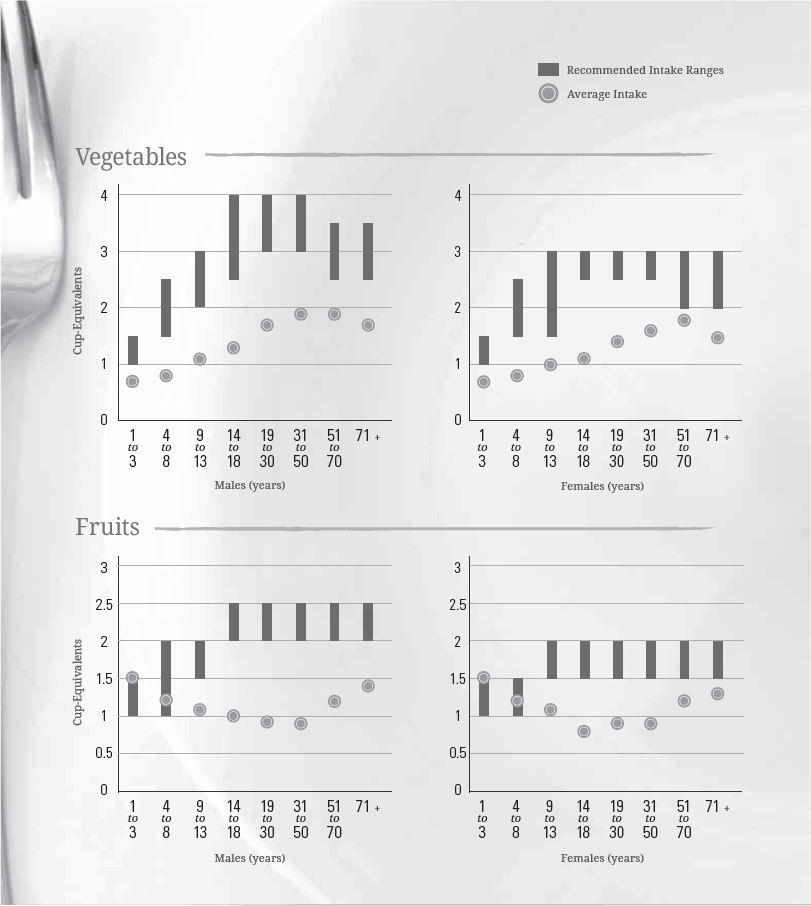
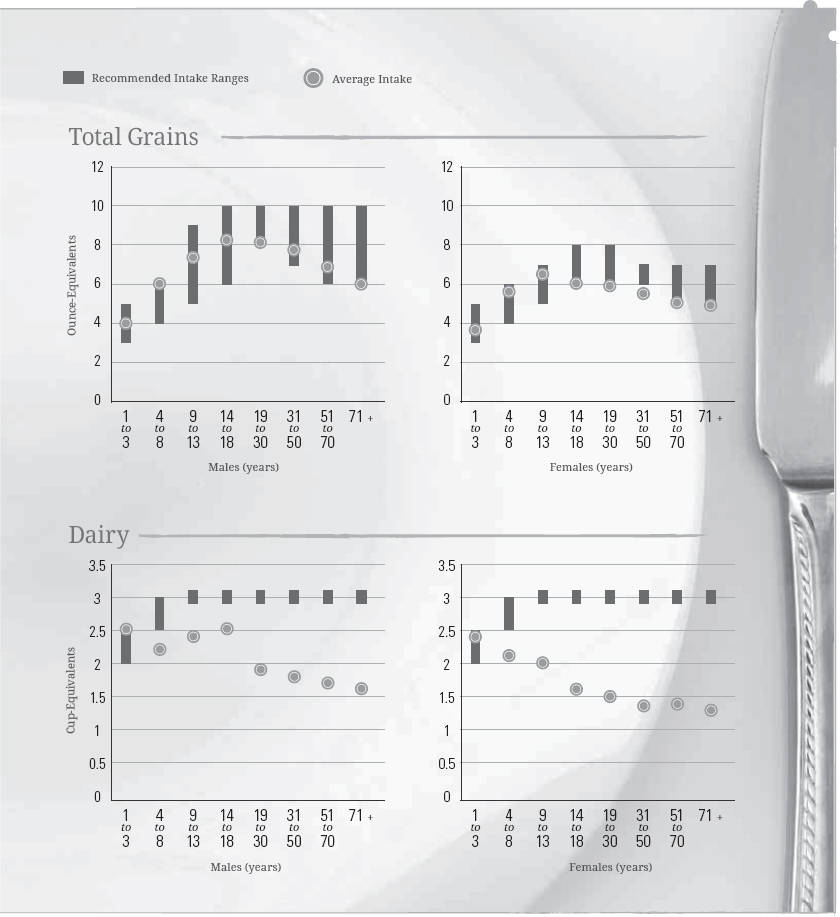
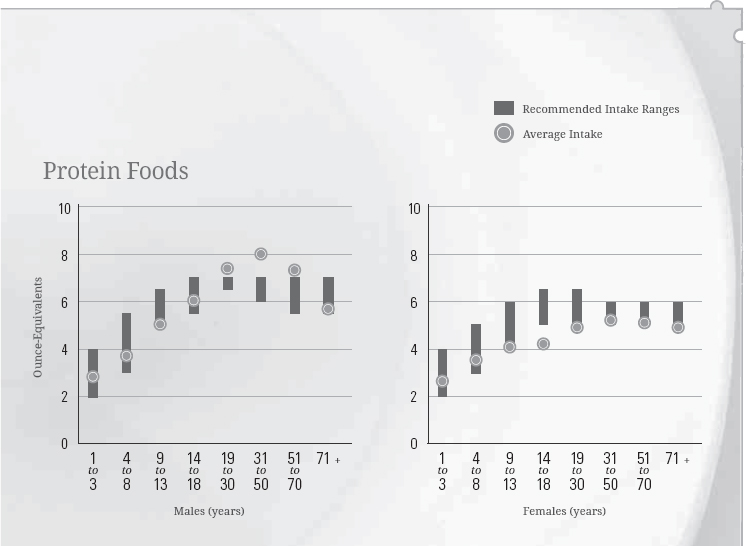
DATA SOURCES: What We Eat in America, NHANES 2007-2010 for average intakes by age-sex group. Healthy U.S.-Style Food Patterns, which vary based on age, sex, and activity level, for recommended intake ranges.
A Closer Look at Current Intakes & Recommended Shifts
As described in Chapter 1, most foods in healthy eating patterns should come from the food groups. As Figure 2-3 shows, across the U.S. population, average intakes of foods from the food groups are far from amounts recommended in the Healthy U.S.-Style Eating Pattern.
Food Groups
The following sections describe total current intakes for each of the food groups and for oils, and the leading food categories contributing to this total. They also describe the shifts in food choices that are needed to meet recommendations and provide strategies that can help individuals make these shifts.
Vegetables
Current Intakes: Figure 2-3 shows the low average intakes of vegetables across age-sex groups in comparison to recommended intake levels. Vegetable consumption relative to recommendations is lowest among boys ages 9 to 13 years and girls ages 14 to 18 years. Vegetable intakes relative to recommendations are slightly higher during the adult years, but intakes are still below recommendations. In addition, with few exceptions, the U.S. population does not meet intake recommendations for any of the vegetable subgroups (Figure 2-4).
Calories in Nutrient-Dense Versus Current Typical Choices in the Food Groups
To stay within energy requirements while meeting nutritional needs, food choices in each food group should be in nutrient-dense forms. However, in many food groups, foods as they are typically eaten are not in nutrient-dense forms—they contain additional calories from components such as added sugars, added refined starches, solid fats, or a combination. For example, in the dairy group, nutrient-dense choices such as fat-free milk, plain fat-free yogurt, and low-fat cheese contain an average of about 80 calories per cup-equivalent. In contrast, many dairy products that are typically consumed, such as whole milk, sweetened yogurt, and regular cheese, contain almost 150 calories per cup-equivalent.[2] Similarly, in the protein foods group, nutrient-dense (lean) choices of meats and poultry contain an average of about 50 calories per ounce-equivalent, but the higher fat choices that are typically consumed contain about 80 to 100 calories per ounce-equivalent. Grains and vegetables also are often consumed in forms that contain additional calories from added sugars or solid fats that are added in processing or preparing the food, rather than in nutrient-dense forms.

When typical instead of nutrient-dense choices are made in each food group, individuals consume extra calories when meeting their food group recommendations. Shifting from typical choices to nutrient-dense options is an important principle for maintaining calorie balance in a healthy eating pattern. A related principle, reducing the portion size of foods and beverages that are not in nutrient-dense forms, also can help to maintain calorie balance.
Figure 2-4.

Average Vegetable Subgroup Intakes in Cup-Equivalents per Week by Age-Sex Groups, Compared to Ranges of Recommended Intakes per Week
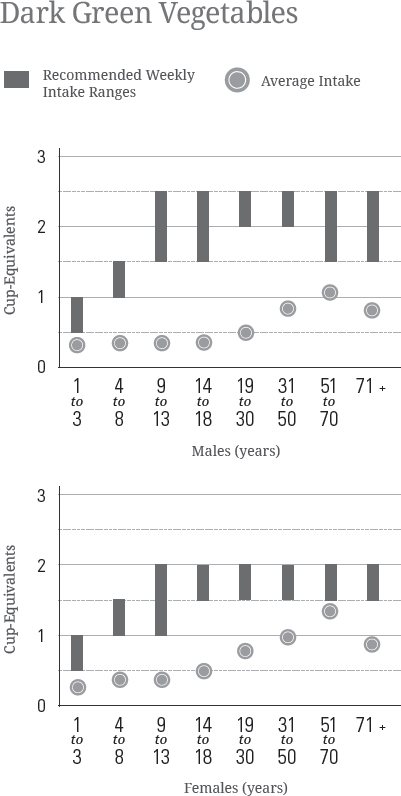
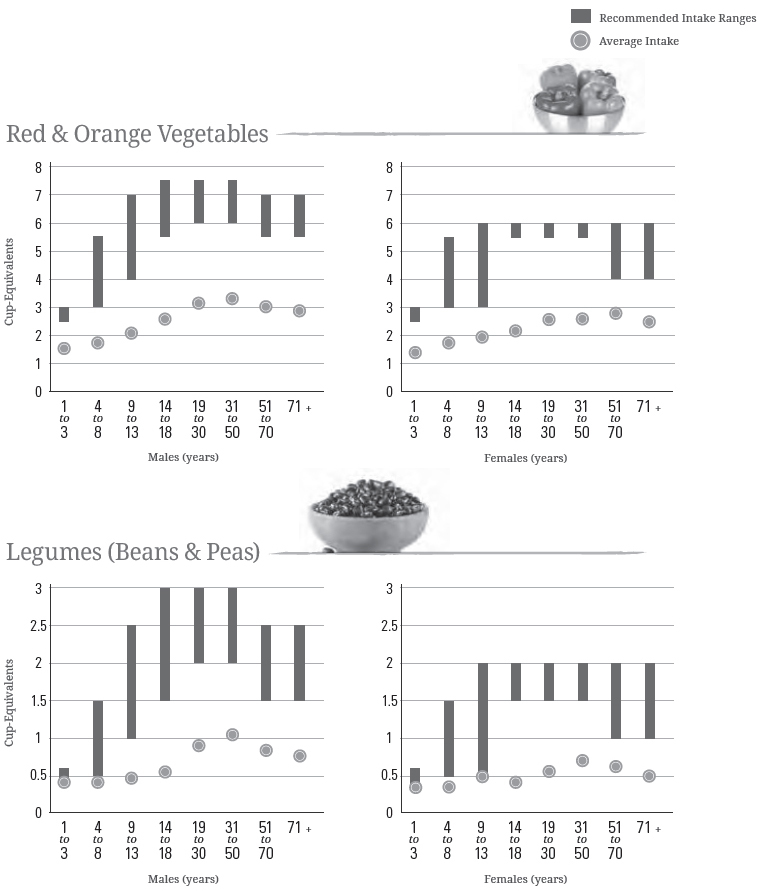

DATA SOURCES: What We Eat in America, NHANES 2007-2010 for average intakes by age-sex group. Healthy U.S.-Style Food Patterns, which vary based on age, sex, and activity level, for recommended intake ranges.
Potatoes and tomatoes are the most commonly consumed vegetables, accounting for 21 percent and 18 percent of all vegetable consumption, respectively. Lettuce and onions are the only other vegetables that make up more than 5 percent each of total vegetable group consumption. Table 2-1 lists additional examples of vegetables in each of the subgroups. About 60 percent of all vegetables are eaten as a separate food item, about 30 percent as part of a mixed dish, and the remaining 10 percent as part of snack foods, condiments, and gravies. Vegetables are part of many types of mixed dishes, from burgers, sandwiches, and tacos to pizza, meat stews, pasta dishes, grain-based casseroles, and soups.

Shift To Consume More Vegetables:
For most individuals, following a healthy eating pattern would include an increase in total vegetable intake from all vegetable subgroups, in nutrient-dense forms, and an increase in the variety of different vegetables consumed over time (see Table 2-1). Strategies to increase vegetable intake include choosing more vegetables—from all subgroups—in place of foods high in calories, saturated fats, or sodium such as some meats, poultry, cheeses, and snack foods. One realistic option is to increase the vegetable content of mixed dishes while decreasing the amounts of other food components that are often overconsumed, such as refined grains or meats high in saturated fat and/or sodium. Other strategies include always choosing a green salad or a vegetable as a side dish and incorporating vegetables into most meals and snacks.
Table 2-1.
Examples of Vegetables in Each Vegetable Subgroup

Fruits
Current Intakes: As shown in Figure 2-3, average intake of fruits is below recommendations for almost all age-sex groups. Children ages 1 to 8 years differ from the rest of the population in that many do meet recommended intakes for total fruit. Average intakes of fruits, including juice, are lowest among girls ages 14 to 18 years and adults ages 19 to 50 years. Older women (ages 51 years and older) and young children consume fruits in amounts close to or meeting minimum recommended intakes (Figure 2-3).
About one-third of the intake of fruits in the U.S. population comes from fruit juice, and the remaining two-thirds from whole fruits (which includes cut up, cooked, canned, frozen, and dried fruits). The highest proportion of juice to whole fruits intake is among children ages 1 to 3 years, for whom about 47 percent of total fruit intake comes from fruit juice, and about 53 percent from whole fruits. Average juice intakes for young children are within the limits recommended by the American Academy of Pediatrics (see the Fruits section of Chapter 1).
Fruits and fruit juices are most likely to be consumed alone or in a mixture with other fruit, rather than as part of a mixed dish that includes foods from other food groups. Almost 90 percent of all fruit intake comes from single fruits, fruit salads, or fruit juices. The most commonly consumed fruits are apples, bananas, watermelon, grapes, strawberries, oranges, peaches, cantaloupe, pears, blueberries, raisins, and pineapple. Commonly consumed fruit juices are orange juice, apple juice, and grape juice.
Figure 2-5.
Average Whole & Refined Grain Intakes in Ounce-Equivalents per Day by Age-Sex Groups, Compared to Ranges of Recommended Daily Intake for Whole Grains & Limits for Refined Grains*
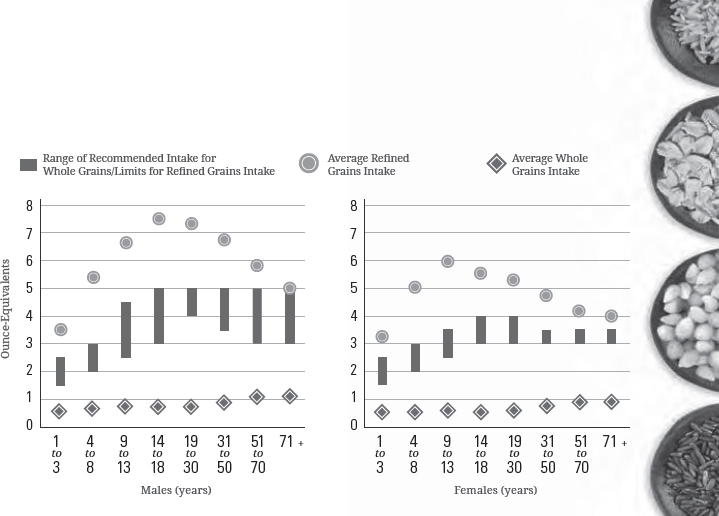
*NOTE: Recommended daily intake of whole grains is to be at least half of total grain consumption, and the limit for refined grains is to be no more than half of total grain consumption. The blue vertical bars on this graph represent one half of the total grain recommendations for each age-sex group, and therefore indicate recommendations for the minimum amounts to consume of whole grains or maximum amounts of refined grains. To meet recommendations, whole grain intake should be within or above the blue bars and refined grain intake within or below the bars.
DATA SOURCES: What We Eat in America, NHANES 2007-2010 for average intakes by age-sex group. Healthy U.S.-Style Food Patterns, which vary based on age, sex, and activity level, for recommended intake ranges.
Shift To Consume More Fruits:
To help support healthy eating patterns, most individuals in the United States would benefit from increasing their intake of fruits, mostly whole fruits, in nutrient-dense forms. A wide variety of fruits are available in the U.S. marketplace, some year-round and others seasonally. Strategies to help achieve this shift include choosing more fruits as snacks, in salads, as side dishes, and as desserts in place of foods with added sugars, such as cakes, pies, cookies, doughnuts, ice cream, and candies.
Grains
Current Intakes: Intakes of total grains are close to the target amounts (Figure 2-3) for all age-sex groups, but as shown in Figure 2-5, intakes do not meet the recommendations for whole grains and exceed limits for refined grains. Average intakes of whole grains are far below recommended levels across all age-sex groups, and average intakes of refined grains are well above recommended limits for most age-sex groups.
Examples of commonly consumed whole-grain foods are whole-wheat breads, rolls, bagels, and crackers; oatmeal; whole-grain ready-to-eat cereals (e.g., shredded wheat, oat rings); popcorn; brown rice; and whole-grain pasta. Examples of refined grain foods are white bread, rolls, bagels, and crackers; pasta; pizza crust; grain based desserts; refined grain ready-to-eat cereals (e.g., corn flakes, crispy rice cereal); corn and wheat tortillas; white rice; and cornbread. As noted in Chapter 1, most refined grain foods in the United States are made from enriched grains. Almost half of all refined grains intake is from mixed dishes, such as burgers, sandwiches, tacos, pizza, macaroni and cheese, and spaghetti with meatballs. About 20 percent of refined grain intake comes from snacks and sweets, including cakes, cookies, and other grain desserts. The remaining 30 percent of refined grain intake is eaten as a separate food item, such as cereals, breads, or rice. About 60 percent of whole-grain intake in the United States is from individual food items, mostly cereals, rather than mixed dishes.


Shift To Make Half of All Grains Consumed Be Whole Grains:
Shifting from refined to whole-grain versions of commonly consumed foods—such as from white to 100% whole-wheat breads, white to whole-grain pasta, and white to brown rice—would increase whole-grain intakes and lower refined grain intakes to help meet recommendations. Strategies to increase whole grains in place of refined grains include using the ingredient list on packaged foods to select foods that have whole grains listed as the first grain ingredient. Another strategy is to cut back on refined grain desserts and sweet snacks such as cakes, cookies, and pastries, which are high in added sugars, solid fats, or both, and are a common source of excess calories. Choosing both whole and refined grain foods in nutrient-dense forms, such as choosing plain popcorn instead of buttered, bread instead of croissants, and English muffins instead of biscuits also can help in meeting recommendations for a healthy eating pattern.
Dairy
Current Intakes: As shown in Figure 2-3, average intakes of dairy for most age-sex groups are far below recommendations of the Healthy U.S.- Style Pattern. Average dairy intake for most young children ages 1 to 3 years meets recommended amounts, but all other age groups have average intakes that are below recommendations. An age-related decline in dairy intake begins in childhood, and intakes persist at low levels for adults of all ages.
Fluid milk (51%) and cheese (45%) comprise most of dairy consumption. Yogurt (2.6%) and fortified soy beverages (commonly known as “soymilk”) (1.5%) make up the rest of dairy intake. About three-fourths of all milk is consumed as a beverage or on cereal, but cheese is most commonly consumed as part of mixed dishes, such as burgers, sandwiches, tacos, pizza, and pasta dishes.
Shift To Consume More Dairy Products in Nutrient-Dense Forms:
Most individuals in the United States would benefit by increasing dairy intake in fat-free or low-fat forms, whether from milk (including lactose-free milk), yogurt, and cheese or from fortified soy beverages (soymilk). Some sweetened milk and yogurt products may be included in a healthy eating pattern as long as the total amount of added sugars consumed does not exceed the limit for added sugars, and the eating pattern does not exceed calorie limits. Because most cheese contains more sodium and saturated fats, and less potassium, vitamin A, and vitamin D than milk or yogurt, increased intake of dairy products would be most beneficial if more fat-free or low-fat milk and yogurt were selected rather than cheese. Strategies to increase dairy intake include drinking fat-free or low-fat milk (or a fortified soy beverage) with meals, choosing yogurt as a snack, or using yogurt as an ingredient in prepared dishes such as salad dressings or spreads. Strategies for choosing dairy products in nutrient-dense forms include choosing lower fat versions of milk, yogurt, and cheese in place of whole milk products and regular cheese.
Protein Foods
Current Intakes: Overall, average intakes of protein foods are close to amounts recommended for all age-sex groups (Figure 2-3). However, Figure 2-6 shows that the average intakes of protein foods subgroups vary in comparison to the range of intake recommendations. Overall, average intakes of seafood are low for all age-sex groups; average intakes of nuts, seeds, and soy products are close to recommended levels; and average intakes of meats, poultry, and eggs are high for teen boys and adult men. Legumes (beans and peas), a vegetables subgroup, also may be considered as part of the protein foods group (see the About Legumes (Beans and Peas) call-out box in Chapter 1). As shown in Figure 2-4, intakes of legumes are below vegetable group recommendations.
Commonly consumed protein foods include beef (especially ground beef), chicken, pork, processed meats (e.g., hot dogs, sausages, ham, luncheon meats), and eggs. The most common seafood choices are shrimp, tuna, and salmon; and the most common nut choices are peanuts, peanut butter, almonds, and mixed nuts. Slightly less than half (49%) of all protein foods are consumed as a separate food item, such as a chicken breast, a steak, an egg, a fish filet, or peanuts. About the same proportion are consumed as part of a mixed dish (45%), with the largest amount from burgers, sandwiches, and tacos.
Figure 2-6.
Average Protein Foods Subgroup Intakes in Ounce-Equivalents per Week by Age-Sex Groups, Compared to Ranges of Recommended Intake
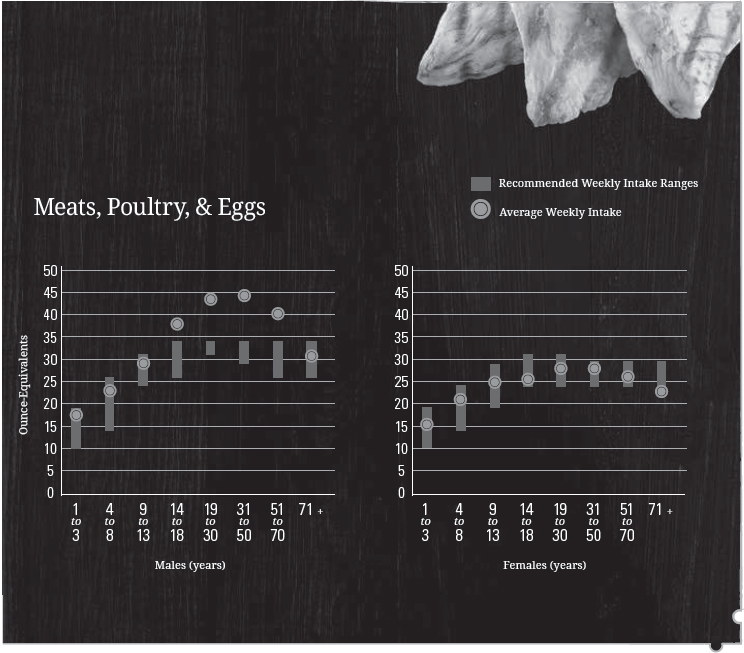
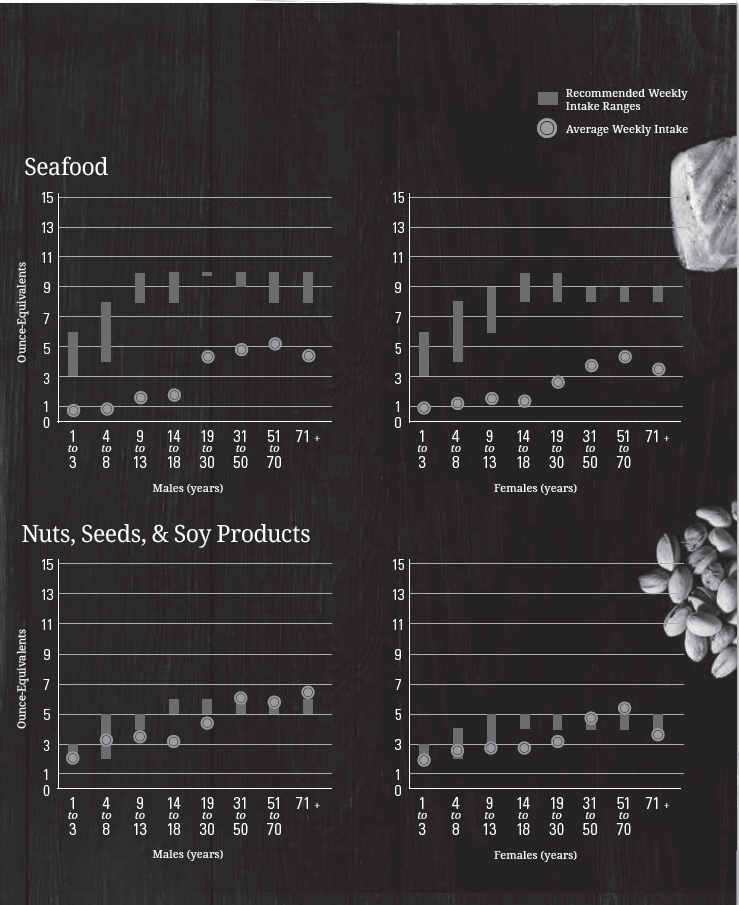
DATA SOURCES: What We Eat in America, NHANES 2007-2010 for average intakes by age-sex group. Healthy U.S.-Style Food Patterns, which vary based on age, sex, and activity level, for recommended intake ranges.

Shift To Increase Variety in Protein Foods Choices and To Make More Nutrient-Dense Choices:
Average intake of total protein foods is close to recommendations, while average seafood intake is below recommendations for all age-sex groups. Shifts are needed within the protein foods group to increase seafood intake, but the foods to be replaced depend on the individual’s current intake from the other protein subgroups. Strategies to increase the variety of protein foods include incorporating seafood as the protein foods choice in meals twice per week in place of meat, poultry, or eggs, and using legumes or nuts and seeds in mixed dishes instead of some meat or poultry. For example, choosing a salmon steak, a tuna sandwich, bean chili, or almonds on a main-dish salad could all increase protein variety.
Shifting to nutrient-dense options, including lean and lower sodium options, will improve the nutritional quality of protein food choices and support healthy eating patterns. Some individuals, especially teen boys and adult men, also need to reduce overall intake of protein foods (see Figure 2-3) by decreasing intakes of meats, poultry, and eggs and increasing amounts of vegetables or other underconsumed food groups.
Oils
Current Intakes: Average intakes of oils are below the recommendations for almost every age-sex group (Figure 2-7). However, intakes are not far from recommendations. In the United States, most oils are consumed in packaged foods, such as salad dressings, mayonnaise, prepared vegetables, snack chips (corn and potato), and as part of nuts and seeds. Oils also can be used in preparing foods such as stir-fries and sautés. The most commonly used oil in the United States is soybean oil. Other commonly used oils include canola, corn, olive, cottonseed, sunflower, and peanut oil. Oils also are found in nuts, avocados, and seafood. Coconut, palm, and palm kernel oils (tropical oils) are solid at room temperature because they have high amounts of saturated fatty acids and are therefore classified as a solid fat rather than as an oil. (See Chapter 1 for more information on tropical oils.)
Figure 2-7.
Average Intakes of Oils & Solid Fats in Grams per Day by Age-Sex Group, in Comparison to Ranges of Recommended Intake for Oils
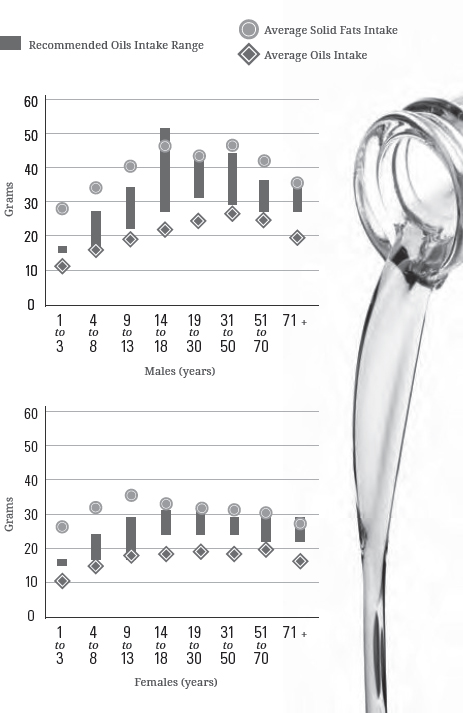
DATA SOURCES: What We Eat in America, NHANES 2007-2010 for average intakes by age-sex group. Healthy U.S. Style Food Patterns, which vary based on age, sex, and activity level, for recommended intake ranges.

Shift From Solid Fats to Oils:
To move the intake of oils to recommended levels, individuals should use oils rather than solid fats in food preparation where possible. Strategies to shift intake include using vegetable oil in place of solid fats (butter, stick margarine, shortening, lard, coconut oil) when cooking, increasing the intake of foods that naturally contain oils, such as seafood and nuts, in place of some meat and poultry, and choosing other foods, such as salad dressings and spreads, made with oils instead of solid fats.
Other Dietary Components
As described in Chapter 1, in addition to the food groups, other components also should be considered when building healthy eating patterns, including limiting the amounts of added sugars, saturated fats, and sodium consumed. Additionally, for adults who choose to drink alcohol, drinking should not exceed moderate intake, and the calories from alcoholic beverages should be considered within overall calorie limits.[3]
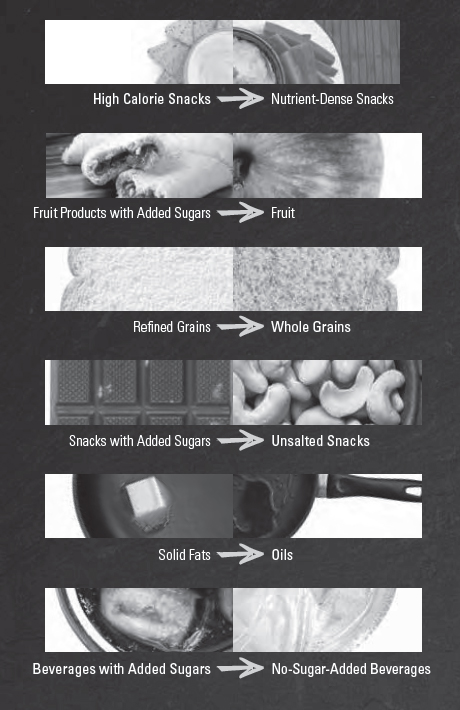
Figure 2-8.
Typical Versus Nutrient-Dense Foods & Beverages
Achieving a healthy eating pattern means shifting typical food choices to more nutrient-dense options—that is, foods with important nutrients that aren’t packed with extra calories or sodium. Nutrient-dense foods and beverages are naturally lean or low in solid fats and have little or no added solid fats, sugars, refined starches, or sodium.

Figure 2-9.
Average Intakes of Added Sugars as a Percent of Calories per Day by Age-Sex Group, in Comparison to the Dietary Guidelines Maximum Limit of Less than 10 Percent of Calories
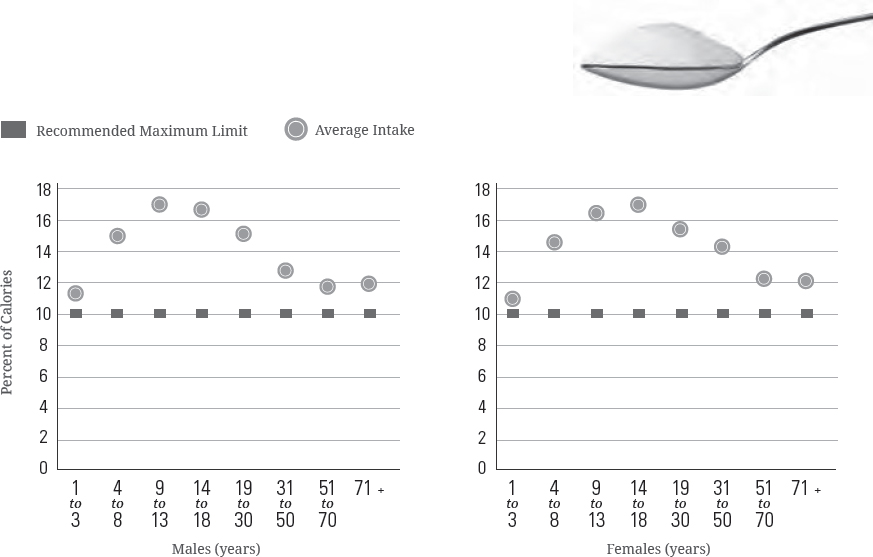
NOTE: The maximum amount of added sugars allowable in a Healthy U.S.-Style Eating Pattern at the 1,200-to-1,800 calorie levels is less than the Dietary Guidelines limit of 10 percent of calories. Patterns at these calorie levels are appropriate for many children and older women who are not physically active.
DATA SOURCE: What We Eat in America, NHANES 2007-2010 for average intakes by age-sex group.
The following sections describe total intakes compared to limits for these components, and the leading food categories contributing to this total.
Added Sugars
Current Intakes: Added sugars account on average for almost 270 calories, or more than 13 percent of calories per day in the U.S. population. As shown in Figure 2-9, intakes as a percent of calories are particularly high among children, adolescents, and young adults. The major source of added sugars in typical U.S. diets is beverages, which include soft drinks, fruit drinks, sweetened coffee and tea, energy drinks, alcoholic beverages, and flavored waters (Figure 2-10). Beverages account for almost half (47%) of all added sugars consumed by the U.S. population (Figure 2-10). The other major source of added sugars is snacks and sweets, which includes grain-based desserts such as cakes, pies, cookies, brownies, doughnuts, sweet rolls, and pastries; dairy desserts such as ice cream, other frozen desserts, and puddings; candies; sugars; jams; syrups; and sweet toppings. Together, these food categories make up more than 75 percent of intake of all added sugars.
Figure 2-10.
Food Category Sources of Added Sugars in the U.S. Population Ages 2 Years & Older

DATA SOURCE: What We Eat in America (WWEIA) Food Category analyses for the 2015 Dietary Guidelines Advisory Committee. Estimates based on day 1 dietary recalls from WWEIA, NHANES 2009-2010.

Shift To Reduce Added Sugars Consumption to Less Than 10 Percent of Calories per Day:[4]
Individuals have many potential options for reducing the intake of added sugars. Strategies include choosing beverages with no added sugars, such as water, in place of sugar-sweetened beverages, reducing portions of sugar-sweetened beverages, drinking these beverages less often, and selecting beverages low in added sugars. Low-fat or fat-free milk or 100% fruit or vegetable juice also can be consumed within recommended amounts in place of sugar-sweetened beverages. Additional strategies include limiting or decreasing portion size of grain-based and dairy desserts and sweet snacks and choosing unsweetened or no-sugar-added versions of canned fruit, fruit sauces (e.g., applesauce), and yogurt. The use of high-intensity sweeteners as a replacement for added sugars is discussed in Chapter 1 in the Added Sugars section.
Saturated Fats
Current Intakes: Current average intakes of saturated fats are 11 percent of calories. Only 29 percent of individuals in the United States consume amounts of saturated fats consistent with the limit of less than 10 percent of calories (see Figure 2-1). As shown in Figure 2-11, average intakes do not vary widely across age-sex groups. Average intakes for both adult men and adult women are at 10.9 percent, and the average intake for children ranges from 11.1 percent up to 12.6 percent of calories.
The mixed dishes food category is the major source of saturated fats in the United States (Figure 2-12), with 35 percent of all saturated fats coming from mixed dishes, especially those dishes containing cheese, meat, or both. These include burgers, sandwiches, and tacos; pizza; rice, pasta, and grain dishes; and meat, poultry, and seafood dishes. The other food categories that provide the most saturated fats in current diets are snacks and sweets, protein foods, and dairy products.
Shift To Reduce Saturated Fats Intake to Less Than 10 Percent of Calories Per Day:
Individuals should aim to shift food choices from those high in saturated fats to those high in polyunsaturated and monounsaturated fats. Strategies to lower saturated fat intake include reading food labels to choose packaged foods lower in saturated fats and higher in polyunsaturated and monounsaturated fats, choosing lower fat forms of foods and beverages that contain solid fats (e.g., fat-free or low-fat milk instead of 2% or whole milk; low-fat cheese instead of regular cheese; lean rather than fatty cuts of meat), and consuming smaller portions of foods higher in saturated fats or consuming them less often. One realistic option is to change ingredients in mixed dishes to increase the amounts of vegetables, whole grains, lean meat, and low-fat or fat-free cheese, in place of some of the fatty meat and/ or regular cheese in the dish. Additional strategies include preparing foods using oils that are high in polyunsaturated and monounsaturated fats, rather than solid fats, which are high in saturated fats (see Chapter 1, Figure 1-2), and using oil-based dressings and spreads on foods instead of those made from solid fats (e.g., butter, stick margarine, cream cheese) (see Solid Fats call-out box).
Figure 2-11.
Average Intakes of Saturated Fats as a Percent of Calories per Day by Age-Sex Groups, in Comparison to the Dietary Guidelines Maximum Limit of Less Than 10 Percent of Calories
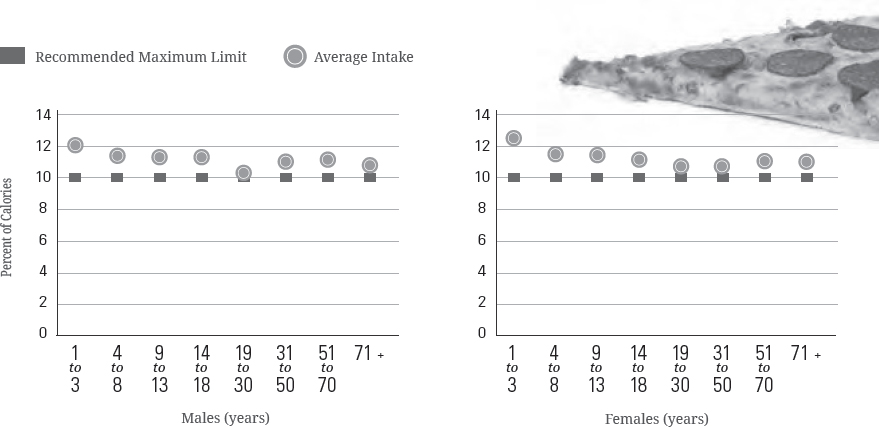
DATA SOURCE: What We Eat in America, NHANES 2007-2010 for average intakes by age-sex group.
Figure 2-12.
Food Category Sources of Saturated Fats in the U.S. Population Ages 2 Years & Older
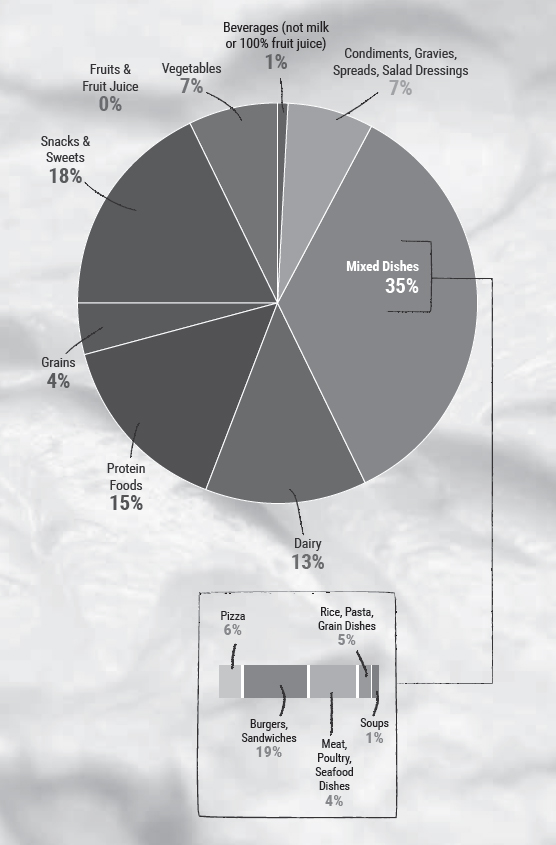
DATA SOURCE: What We Eat in America (WWEIA) Food Category analyses for the 2015 Dietary Guidelines Advisory Committee. Estimates based on day 1 dietary recalls from WWEIA, NHANES 2009-2010.
Solid Fats
Solid fats are the fats found in meats, poultry, dairy products, hydrogenated vegetable oils, and some tropical oils. They contain more saturated fatty acids and less mono- and polyunsaturated fatty acids, compared to oils (see Chapter 1, Figure 1-2). Solid fats, including the tropical oils, are solid at room temperature. In some foods, such as whole milk, the solid fat (butterfat) is suspended in the fluid milk by the process of homogenization.
The purpose of discussing solid fats in addition to saturated fats is that, apart from the effects of saturated fats on cardiovascular disease risk, solid fats are abundant in diets in the United States and contribute substantially to excess calorie intake. Solid fats, consumed as part of foods or added to foods, account for more than 325 calories or more than 16 percent of calories per day, on average, for the U.S. population but provide few nutrients. Food category sources of solid fats are similar to those for saturated fats: mixed dishes, snacks and sweets, protein foods, and dairy. Because solid fats are the major source of saturated fats, the strategies for reducing the intake of solid fats parallel the recommendations for reducing saturated fats. These strategies include choosing packaged foods lower in saturated fats; shifting from using solid fats to oils in preparing foods; choosing dressings and spreads that are made from oils rather than solid fats; reducing overall intake of solid fats by choosing lean or low-fat versions of meats, poultry, and dairy products; and consuming smaller portions of foods higher in solid fats or consuming them less often.
Figure 2-13.
Average Intake of Sodium in Milligrams per Day by Age-Sex Groups, Compared to Tolerable Upper Intake Levels (UL)
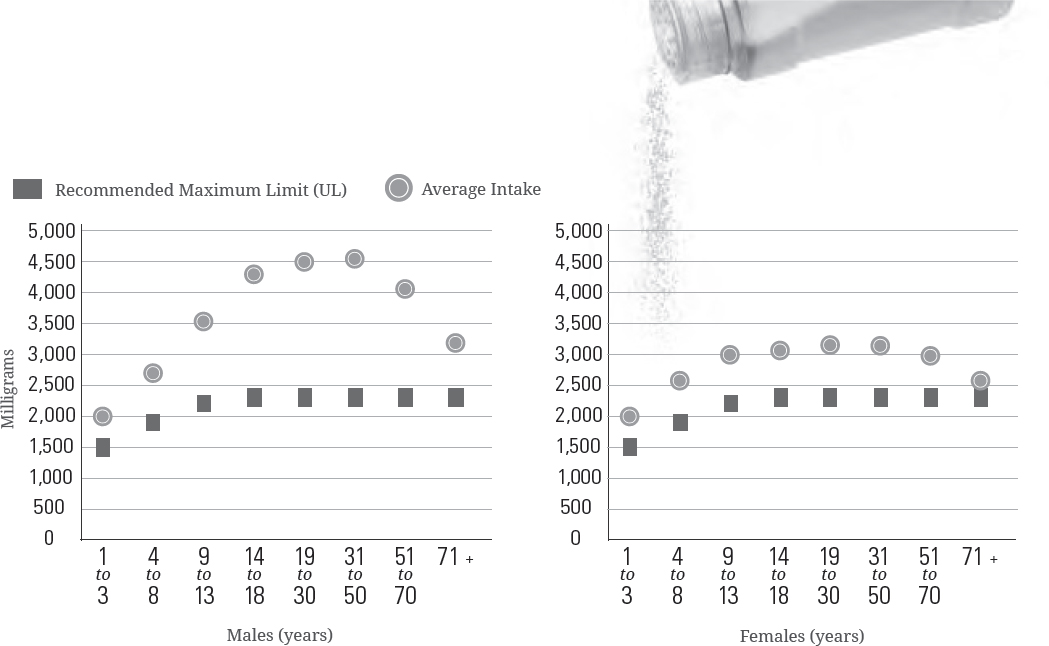
DATA SOURCES: What We Eat in America, NHANES 2007-2010 for average intakes by age-sex group. Institute of Medicine Dietary Reference Intakes for Tolerable Upper Intake Levels (UL).
Sodium
Current Intakes: As shown in Figure 2-13, average intakes of sodium are high across the U.S. population compared to the Tolerable Upper Intake Levels (ULs). Average intakes for those ages 1 year and older is 3,440 mg per day. Average intakes are generally higher for men than women. For all adult men, the average intake is 4,240 mg, and for adult women, the average is 2,980 mg per day. Only a small proportion of total sodium intake is from sodium inherent in foods or from salt added in home cooking or at the table. Most sodium consumed in the United States comes from salts added during commercial food processing and preparation.
Sodium is found in foods from almost all food categories (Figure 2-14). Mixed dishes—including burgers, sandwiches, and tacos; rice, pasta, and grain dishes; pizza; meat, poultry, and seafood dishes; and soups—account for almost half of the sodium consumed in the United States. The foods in many of these categories are often commercially processed or prepared.

Shift Food Choices To Reduce Sodium Intake:[5]
Because sodium is found in so many foods, careful choices are needed in all food groups to reduce intake. Strategies to lower sodium intake include using the Nutrition Facts label to compare sodium content of foods and choosing the product with less sodium and buying low-sodium, reduced sodium, or no-salt-added versions of products when available. Choose fresh, frozen (no sauce or seasoning), or no-salt-added canned vegetables, and fresh poultry, seafood, pork, and lean meat, rather than processed meat and poultry. Additional strategies include eating at home more often; cooking foods from scratch to control the sodium content of dishes; limiting sauces, mixes, and “instant” products, including flavored rice, instant noodles, and ready-made pasta; and flavoring foods with herbs and spices instead of salt.
Figure 2-14.
Food Category Sources of Sodium in the U.S. Population Ages 2 Years & Older
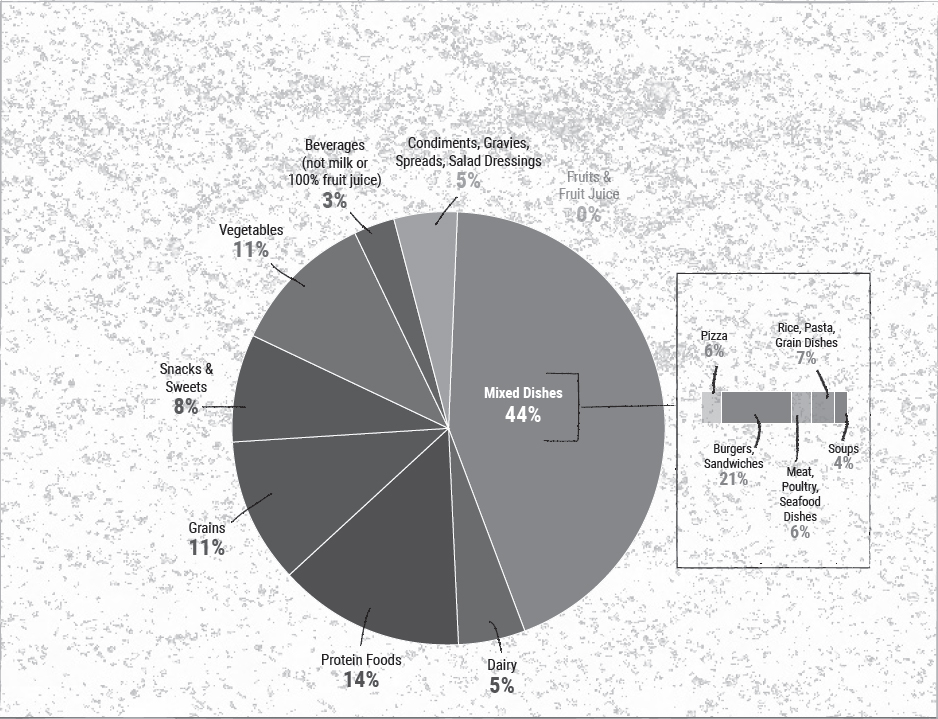
DATA SOURCE: What We Eat in America (WWEIA) Food Category analyses for the 2015 Dietary Guidelines Advisory Committee. Estimates based on day 1 dietary recalls from WWEIA, NHANES 2009-2010.
Alcohol
In 2011, approximately 56 percent of U.S. adults 21 years of age and older were current drinkers, meaning that they had consumed alcohol in the past month; and 44 percent were not current drinkers. Current drinkers include 19 percent of all adults who consistently limited intake to moderate drinking, and 37 percent of all adults who did not. Drinking in greater amounts than moderation was more common among men, younger adults, and non-Hispanic whites. Two in three adult drinkers do not limit alcohol intake to moderate amounts one or more times per month.
The Dietary Guidelines does not recommend that individuals begin drinking or drink more for any reason. The amount of alcohol and calories in beverages varies and should be accounted for within the limits of healthy eating patterns. Alcohol should be consumed only by adults of legal drinking age. There are many circumstances in which individuals should not drink, such as during pregnancy. See Chapter 1 and Appendix 9. Alcohol for additional information.
Caffeine

More than 95 percent of all adults consume caffeine from foods and/or beverages.[6] Average intakes of caffeine among adults, by age-sex group, range from 110 mg (females ages 19 to 30 years) up to 260 mg (males ages 51 to 70 years) per day. These amounts are substantially less than 400 mg per day, which is the upper amount associated with moderate coffee consumption that can be incorporated into healthy eating patterns. However, daily intakes of caffeine exceed 400 mg per day for a small percent of the adult population. The 90th percentile of caffeine intake for men ages 31 to 70 years, and the 95th percentile of caffeine intake for women ages 31 years and older, is greater than 400 mg per day. Caffeine sources for adults are largely from coffee and tea, which provide about 70 to 90 percent of total caffeine intake across all adult age groups.
Average intakes for children (5 to 32 mg/d) and adolescents (63 to 80 mg/d) are low. Caffeine sources for children and adolescents are distributed among coffee, tea, and sugar-sweetened beverages in roughly equal amounts. For young children, desserts and sweets also are a notable source of caffeine from certain ingredients such as chocolate, but intake of caffeine is low from all sources.
Underconsumed Nutrients & Nutrients of Public Health Concern
In addition to helping reduce chronic disease risk, the shifts in eating patterns described in this chapter can help individuals meet nutrient needs. This is especially important for nutrients that are currently underconsumed. Although the majority of Americans consume sufficient amounts of most nutrients, some nutrients are consumed by many individuals in amounts below the Estimated Average Requirement or Adequate Intake levels. These include potassium, dietary fiber, choline, magnesium, calcium, and vitamins A, D, E, and C. Iron also is underconsumed by adolescent girls and women ages 19 to 50 years. Low intakes for most of these nutrients occur within the context of unhealthy overall eating patterns, due to low intakes of the food groups—vegetables, fruits, whole grains, and dairy—that contain these nutrients. Shifts to increase the intake of these food groups can move intakes of these underconsumed nutrients closer to recommendations.
Of the underconsumed nutrients, calcium, potassium, dietary fiber, and vitamin D are considered nutrients of public health concern because low intakes are associated with health concerns. For young children, women capable of becoming pregnant, and women who are pregnant, low intake of iron also is of public health concern.
Shift to eating more vegetables, fruits, whole grains, and dairy to increase intake of nutrients of public health concern.
Low intakes of dietary fiber are due to low intakes of vegetables, fruits, and whole grains. Low intakes of potassium are due to low intakes of vegetables, fruits, and dairy. Low intakes of calcium are due to low intakes of dairy. If a healthy eating pattern, such as the Healthy U.S.-Style Eating Pattern, is consumed, amounts of calcium and dietary fiber will meet recommendations. Amounts of potassium will increase but depending on food choices may not meet the Adequate Intake recommendation. To increase potassium, focus on food choices with the most potassium, listed in Appendix 10. Food Sources of Potassium, such as white potatoes, beet greens, white beans, plain yogurt, and sweet potato.
Although amounts of vitamin D in the USDA Food Patterns are less than recommendations, vitamin D is unique in that sunlight on the skin enables the body to make vitamin D. Recommendations for vitamin D assume minimum sun exposure. Strategies to achieve higher levels of intake of dietary vitamin D include consuming seafood with higher amounts of vitamin D, such as salmon, herring, mackerel, and tuna, and more foods fortified with vitamin D, especially fluid milk, soy beverage (soymilk), yogurt, orange juice, and breakfast cereals. In some cases, taking a vitamin D supplement may be appropriate, especially when sunshine exposure is limited due to climate or the use of sunscreen.
The best food sources of potassium, calcium, vitamin D, and dietary fiber are found in Appendix 10, Appendix 11, Appendix 12, and Appendix 13, respectively.
Substantial numbers of women who are capable of becoming pregnant, including adolescent girls, are at risk of iron-deficiency anemia due to low intakes of iron. To improve iron status, women and adolescent girls should consume foods containing heme iron, such as lean meats, poultry, and seafood, which is more readily absorbed by the body. Additional iron sources include legumes (beans and peas) and dark-green vegetables, as well as foods enriched or fortified with iron, such as many breads and ready-to-eat cereals. Absorption of iron from non-heme sources is enhanced by consuming them along with vitamin C-rich foods. Women who are pregnant are advised to take an iron supplement when recommended by an obstetrician or other health care provider.
Beverages
Beverages are not always remembered or considered when individuals think about overall food intake. However, they are an important component of eating patterns. In addition to water, the beverages that are most commonly consumed include sugar-sweetened beverages, milk and flavored milk, alcoholic beverages, fruit and vegetable juices, and coffee and tea. Beverages vary in their nutrient and calorie content. Some, like water, do not contain any calories. Some, like soft drinks, contain calories but little nutritional value. Finally, some, like milk and fruit and vegetable juices, contain important nutrients such as calcium, potassium, and vitamin D, in addition to calories.
Beverages make a substantial contribution to total water needs as well as to nutrient and calorie intakes in most typical eating patterns. In fact, they account for almost 20 percent of total calorie intake. Within beverages, the largest source of calories is sweetened beverages, accounting for 35 percent of calories from beverages. Other major sources of calories from beverages are milk and milk drinks, alcoholic beverages, fruit and vegetable juices, and coffee and tea.
When choosing beverages, both the calories and nutrients they may provide are important considerations. Beverages that are calorie-free—especially water—or that contribute beneficial nutrients, such as fat-free and low-fat milk and 100% juice, should be the primary beverages consumed. Milk and 100% fruit juice should be consumed within recommended food group amounts and calorie limits. Sugar-sweetened beverages, such as soft drinks, sports drinks, and fruit drinks that are less than 100% juice, can contribute excess calories while providing few or no key nutrients. If they are consumed, amounts should be within overall calorie limits and limits for calories from added sugars (see Chapter 1). The use of high-intensity sweeteners, such as those used in “diet” beverages, as a replacement for added sugars is discussed in Chapter 1 in the Added Sugars section.
For adults who choose to drink alcohol, limits of only moderate intake (see Appendix 9) and overall calorie limits apply.[8] Coffee, tea, and flavored waters also can be selected, but calories from cream, added sugars, and other additions should be accounted for within the eating pattern.
Folic Acid for Women Capable of Becoming Pregnant & Who Are Pregnant

The RDAs for folate are based on the prevention of folate deficiency, not on the prevention of neural tube defects. The RDA for adult women is 400 micrograms (mcg) Dietary Folate Equivalents (DFE)[7] and for women during pregnancy, 600 mcg DFE daily from all sources.
Folic acid fortification of enriched grain products in the United States has been successful in reducing the incidence of neural tube defects. Therefore, to prevent birth defects, all women capable of becoming pregnant are advised to consume 400 mcg of synthetic folic acid daily, from fortified foods and/or supplements. This recommendation is for an intake of synthetic folic acid in addition to the amounts of food folate contained in a healthy eating pattern. All enriched grains are fortified with synthetic folic acid. Sources of food folate include beans and peas, oranges and orange juice, and dark-green leafy vegetables, such as spinach and mustard greens.
Opportunities for Shifts in Food Choices
To support a healthy body weight, meet nutrient needs, and lessen the risk of chronic disease, shifts are needed in overall eating patterns—across and within food groups and from current typical choices to nutrient-dense options. Eating patterns are the result of choices on multiple eating occasions over time, both at home and away from home. As a result, individuals have many opportunities to make shifts to improve eating patterns.
The majority of the U.S. population consumes three meals a day plus more than one snack. Children ages 2 to 5 years are most likely to consume three meals a day, with 84 percent consuming three meals and most often, two or more snacks. In contrast, only half of adolescent females and young adult males consume three meals a day, but most also have two or more snacks per day. Also, among most age groups, 40 to 50 percent consume two to three snacks a day, and about one-third consume four or more snacks a day.
About two-thirds (67%) of the calories consumed by the U.S. population are purchased at a store, such as a grocery store or supermarket, and consumed in the home. However, Americans have increased the proportion of food they consume away from home from 18 percent in 1977-1978 to 33 percent in 2009-2010.
These data suggest that multiple opportunities to improve food choices exist throughout the day and in varied settings where food is obtained and consumed. Small shifts made at each of these many eating occasions over time can add up to real improvements in eating patterns.
Summary
The U.S. population, across almost every age and sex group, consumes eating patterns that are low in vegetables, fruits, whole grains, dairy, seafood, and oil and high in refined grains, added sugars, saturated fats, sodium, and for some age-sex groups, high in the meats, poultry, and eggs subgroup. Although most Americans urgently need to shift intakes to achieve the healthy eating patterns described in Chapter 1, young children and older Americans generally are closer to the recommendations than are adolescents and young adults. For some aspects of eating patterns, maintaining the intake levels of young children as they grow into adolescence and adulthood could result in healthy eating patterns across the lifespan and improved health over time.

[1] The What We Eat in America (WWEIA) Food Categories provide an application to analyze foods and beverages as consumed. Each of the food and beverage items that can be reported in WWEIA, National Health and Nutrition Examination Survey, are placed in one of the mutually exclusive food categories. More information about the WWEIA Food Categories is available at: http://www.ars.usda.gov/Services/docs.htm?docid=23429. Accessed November 25, 2015.
[2] Britten P, Cleveland LE, Koegel KL, Kuczynski KJ, and Nickols-Richardson MS. Impact of typical rather than nutrient dense food choices in the US Department of Agriculture Food Patterns. J Acad Nutr Diet. 2012;112 (10):1560-1569.
[3] It is not recommended that individuals begin drinking or drink more for any reason. The amount of alcohol and calories in beverages varies and should be accounted for within the limits of healthy eating patterns. Alcohol should be consumed only by adults of legal drinking age. There are many circumstances in which individuals should not drink, such as during pregnancy. See Appendix 9. Alcohol for additional information.
[4] See Added Sugars section of Chapter 1 for more information and Appendix 3. USDA Food Patterns: Healthy U.S.-Style Eating Patterns for specific limits on calories that remain after meeting food group recommendation in nutrient-dense forms (“calorie limits for other uses”).
[5] The recommendation to limit intake of sodium to less than 2,300 mg per day is the UL for individuals ages 14 years and older set by the IOM. The recommendations for children younger than 14 years of age are the IOM age- and sex-appropriate ULs (see Appendix 7. Nutritional Goals for Age-Sex Groups, Based on Dietary Reference Intakes and Dietary Guidelines Recommendations).
[6] Caffeine is a substance that is generally recognized as safe (GRAS) in cola-type beverages by the Food and Drug Administration for use by adults and children. For more information, see: Code of Federal Regulation Title 21, subchapter B, Part 182, Subpart B. Caffeine. U.S. Government Printing Office. November 23, 2015. Available at: http://www.ecfr.gov/cgi-bin/retrieveECFR?gp=1&SID=f8c3068e9ec0062a3b4078cfa6361cf6&ty=HTML&h=L&mc=true&r=SECTION&n=se21.3.182_11180. Accessed October 22, 2015.
[7] Dietary Folate Equivalents (DFE) adjust for the difference in bioavailability of food folate compared with synthetic folic acid. Food folate, measured as micrograms DFE, is less bioavailable than folic acid. 1 DFE = 1 mcg food folate = 0.6 mcg folic acid from supplements and fortified foods taken with meals.
[8] It is not recommended that individuals begin drinking or drink more for any reason. The amount of alcohol and calories in beverages varies and should be accounted for within the limits of healthy eating patterns. Alcohol should be consumed only by adults of legal drinking age. There are many circumstances in which individuals should not drink, such as during pregnancy. See Appendix 9 for additional information.