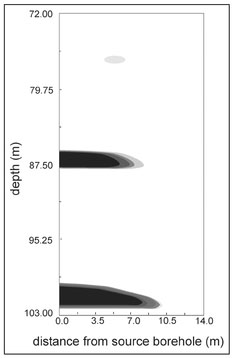
Figure 12.1. A single-view geophysical diffraction tomography image of a tunnel in the Korean DMZ using radar in a cross-borehole geometry. The tunnel appears as the black area at a depth of about 88 meters.
Since the early part of the last century, geophysical techniques have been used to probe the Earth's interior. Because of the obvious economic incentives, a great deal of this effort was focused on resource exploration. Also dating back to the early part of the last century is a mathematical relationship known as the Radon transform. It has long been known that this transform could serve as the basis for tomographic imaging. However, it was not until the 1970s that computing power reached a level sufficient for implementation of the Radon transform in imaging. The first use of the Radon transform in tomographic imaging was CT scanners used in diagnostic medicine. These devices use x-rays and reconstruct images by backprojection. These rays will travel in straight lines in organic materials such as the human body and, as such, imaging by backprojection is valid for these applications. The Radon transform provides images comparable to those that can be obtained by the backprojection process described in Sect. 11.4. However, the application of imaging by this transform is far more computationally efficient, particularly in situations where a large number of source and receiver positions are used. The success of the CT scanner stimulated development of new imaging techniques and applications in many disciplines, including geophysics.
The earliest applications or geophysical tomography involved the use of the Radon transform. Because imaging with the Radon transform implicitly assumes that energy travels along straight rays, these early types of algorithms are referred to as straight-ray backprojection (Sect. 11.1). Subsequently, it was recognized that, unlike x-rays employed in CT scanners, the longer wavelengths used in geophysics do not travel along straight rays and a generalization of the straight ray approach to geophysical tomography that more rigorously accounted for wave effects was introduced.1 This approach was based on earlier work in holographic image reconstruction2 and is referred to as geophysical diffraction tomography (GDT). This is the concept described in Sect. 11.5.
These early efforts led to further developments and refinements in GDT and other methods of imaging. In order to test the efficacy of these developments, GDT field studies have been performed in applications related to archaeology, paleontology, environmental remediation, geotechnical engineering, and national security. Several of these studies are highlighted here.
During the past several decades, tunnels have been discovered between North and South Korea extending through the mountains of the Demilitarized Zone (DMZ). These tunnels were sufficiently large to allow the efficient movement of troops from the north to the south. The presence of these tunnels, as well as the possible existence of additional tunnels yet to be discovered, pose a threat to the security of South Korea. The discovery of these tunnels has stimulated efforts in the development of geophysical techniques for tunnel detection. While the ultimate objective of such efforts is the detection of new tunnels, the known tunnels have served as excellent test beds for evaluation of new techniques.
One of the early applications of GDT involved the imaging of tunnels in the Korean DMZ.3 Data were acquired by the United States Army using a cross-borehole (Fig. 11.3 left) radar system. Here, transmitting and receiving electromagnetic wave antennas were placed in parallel vertical boreholes and these antennas were moved up and down in the boreholes to simulate the response of an array of receiving antennas to a range of plane wave view angles.

Figure 12.1. A single-view geophysical diffraction tomography image of a tunnel in the Korean DMZ using radar in a cross-borehole geometry. The tunnel appears as the black area at a depth of about 88 meters.
Figure 12.1 shows the result of the application of this imaging algorithm for a single horizontal view applied to a known tunnel in the DMZ. Here, the axis of the tunnel is perpendicular to the plane of the imaged cross-section. The imaged quantity is the electromagnetic wave speed. In Fig. 12.1, the spatial distribution of reconstructed wave speed within a vertical slice between the two boreholes is displayed as gray levels with darker shades of gray corresponding to larger values of wave speed. Since the speed of light in air is greater than the speed of light in the host granite, a tunnel will appear as a dark region for this method of rendering. Note in this image that there are three dark features. The known tunnel appears in this image as the black feature at a depth of approximately 88 m and 5 m from one borehole. This feature is horizontally elongated because of the cross-borehole geometry (Sect. 11.2) and because only a single view angle was used. In comparison to straight ray backprojection, the image shown in Fig. 12.1 is comparable to the partial image shown in Fig. 11.1 and it becomes clear through this comparison that a single view in diffraction tomography is far superior to a single view in backprojection.
Figure 12.2 is a diffraction tomography image of the same cross-section shown in Fig. 12.1 but for five view directions.
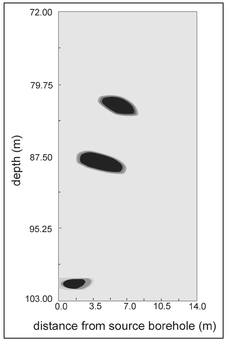
Figure 12.2. A five-view geophysical diffraction tomography image of the same tunnel imaged in Fig. 12.1.
Here, the tunnel has much better definition. There is also a second feature, above the tunnel, that has a similar appearance to the tunnel. It is believed that this feature is a fracture zone of the type known to occur in the granite formation of the DMZ. The deepest feature appearing in this image is not believed to be a tunnel because its cross-sectional size is too small and its reconstructed wave speed is too small to be that of air.
In 1985, a team from the Southwest Paleontology Foundation began excavating a new specie of supergiant sauropod dinosaur that later was given the name Seismosaurus—'the Earth Shaker'.4 The Seismosaurus skeleton was discovered because eight tail bones had been exposed by erosion. By 1987, almost the entire tail had been excavated but the removal of the remainder of the skeleton promised to be quite tedious because it would require excavation from the top of a mesa through as much as 3 m of hard sandstone. Because of the estimated length of this dinosaur—between 45 and 60 m—further excavation without some guidance as to where to dig would be prohibitive. The need to better quantify the location of Seismosaurus' skeletal remains produced an unexpected level of volunteer efforts by scientists.
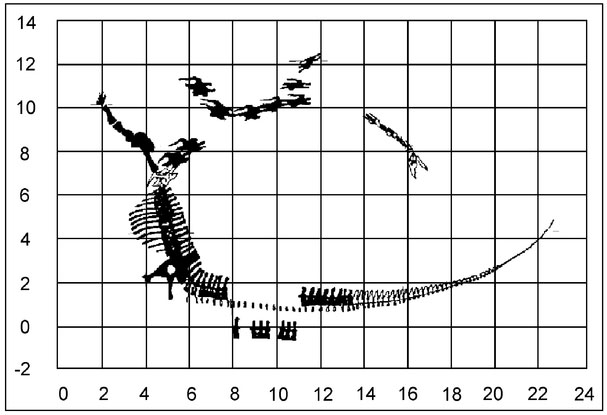
Figure 12.3. Interpretation of the Seismosaurus' skeletal position.
Because of this need (or opportunity), GDT field studies were conducted at the site in 1987 and 1989.5 For both studies, the surface-to-borehole geometry (Sect. 11.2, Fig. 11.3 right) was used with acoustic waves. Figure 12.3 is a composite bone map based on the information derived from excavation and the interpretation of the GDT images after the 1989 field study. The bones shaded in gray are those discovered by excavation, and those shaded in black are those postulated by Dave Gillette, the paleontologist in charge of the excavation. Contrary to fictional accounts of this study presented in the motion picture 'Jurassic Park,' GDT does not provide such good resolution for targets this small (even very large dinosaur bones). The images were again vertical cross-sections displayed as gray levels and, based upon size, aspect ratio, wave speed and position, Dave Gillette made the skeletal interpretation shown in Fig. 12.3.
Figure 12.4 is a GDT image of a vertical cross-section containing what is believed to be two Seismosaurus bones. In this figure as well as Fig. 12.6, sound speed is displayed as gray shades with darker gray shades associated with increasing sound speed. At this site, the dinosaur bone has a greater sound speed than the host sandstone and, consequently, bone should appear darker in the images.
Unfortunately, many areas showing postulated dinosaur bone were never excavated because excavation permits were not granted for these areas. Figure 12.5 shows a photograph of a bone, in place, after it was exposed by excavation and subsequently plastered for preservation. This particular bone is a vertebra from the back.
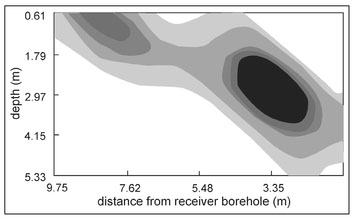
Figure 12.4. Geophysical diffraction tomography image showing two features (depicted in black and dark gray) believed to be dinosaur bones.
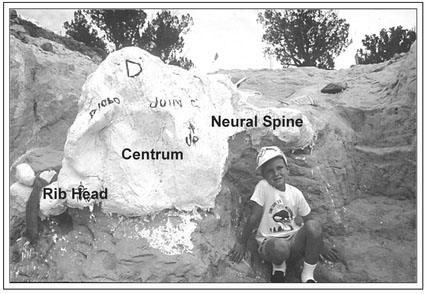
Figure 12.5. Annotated photograph of an excavated and plastered dinosaur bone.
As annotated in this figure, the central portion of bone is called the centrum, with two appendages. One appendage is the head of a rib and the second, called the neural spine, is the part of the bone where muscles are attached. The Seismosaurus skeleton is lying on its right side so that the neural spine would be vertical (projecting upward from the centrum) when the dinosaur was erect. Figure 12.6 is the image of this bone prior to excavation. The centrum, neural spine, and rib head are vaguely discernible in this image. The image is more elongated than expected because surface vegetation limited source access resulting in the views being predominantly horizontal (Sect. 11.2). The features are reversed between Figs. 12.5 and 12.6 because the photo was taken from the opposite direction relative to the image coordinates.
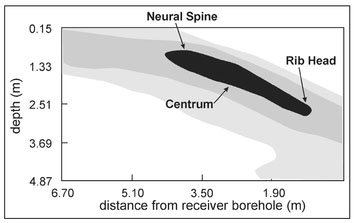
Figure 12.6. Annotated GDT image of the bone shown in Fig. 12.5 prior to excavation.
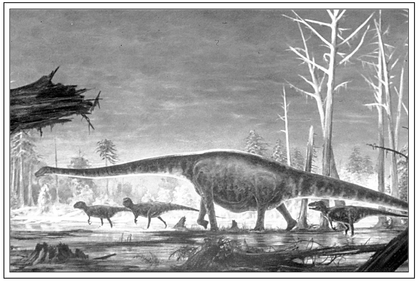
Figure 12.7. Artists rendering of Seismosaurus.
Figure 12.7 is an artists rendering of what Seismosaurus might have looked like during life. Figures 12.8 and 12.9 are photographs of the sacrum of the Seismosaurus, fused vertebrae where the back tail, and hips meet. In Fig. 12.8, a large portion of the sacrum has been exposed by excavation and plastered for preservation. Figure 12.96 shows a portion of the sacrum being hoisted for removal from the site. At nearly 2 m in diameter and weighing over 1000 kilograms, this, at the time, was the largest bone ever discovered.
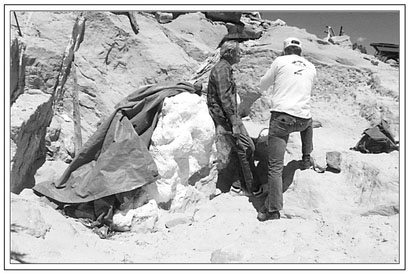
Figure 12.8. Photograph of an exposed and plastered portion of the Seismosaurus sacrum.
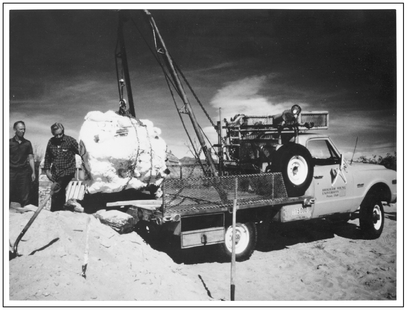
Figure 12.9. Photograph of a portion of the Seismosaurus sacrum being hoisted for removal from the site.
Recently, archaeologists from the University of California, San Diego (UCSD), discovered widespread evidence for underground villages dating to more than 6000 years ago in Israel's Negev desert. Until the discovery of an underground system of ten subterranean rooms and storage facilities connected by narrow tunnels at a site in the Negev desert known as Shiqmim, scholars believed that subterranean architecture was highly localized in the region, occurring only around the city of Beersheva. Based on the work of archaeologists,7 a case can be made for an extensive network of underground systems stretching for over 40 km along the main drainage system in the Negev, the Wadi Beersheva. While subterranean room complexes are known from Capadoccia in Turkey, the Roman period in Palestine, and some historical tribes in East Africa, radiocarbon dates from Shiqmim show that the Negev examples are the earliest known subterranean complexes in the world.
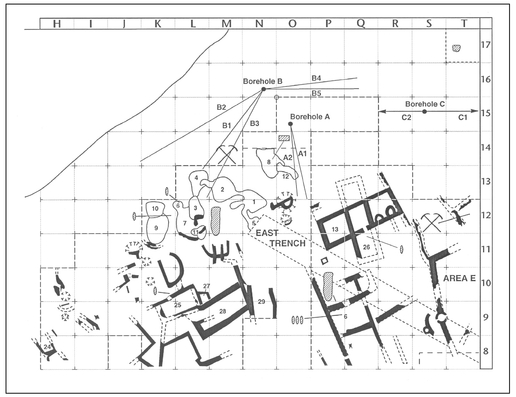
Figure 12.10. Map of the 1992 Shiqmim GDT study area.
In June 1992, the first of two geophysical diffraction tomography field studies8 were carried out at Shiqmim. The purpose of these studies was to identify and locate further subterranean rooms and tunnels in the previously excavated area. Here, seismic waves were used in a surface-to-borehole measurement geometry (Sect. 11.2). Figure 12.10 is a map of the site showing the previously excavated surface and subsurface features as well as the boreholes and source lines used in the GDT study. Individual cross-sectional images were combined to produce three-dimensional renderings of subterranean features. Figures 12.11 and 12.12 show a comparison of excavated features with similar imaged features. Figure 12.11 is a comparison between an excavated room and the GDT image of a room.
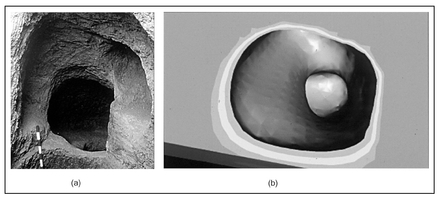
Figure 12.11. The floor of a subterranean room (a) as a photograph showing grain storage pits and (b) as a three-dimensional GDT image.
Both views in this comparison are looking downward. In the photograph, several storage pits are evident in the floor of the room and a similar feature appears in the GDT image of a different and yet-to-be excavated room. Figure 12.12 is a similar comparison of a photograph of an excavated tunnel and a three-dimensional GDT image of a never-excavated tunnel. The comparison of actual to imaged features shown in Figs. 12.11 and 12.12 clearly shows how accurate tomographic images can be.
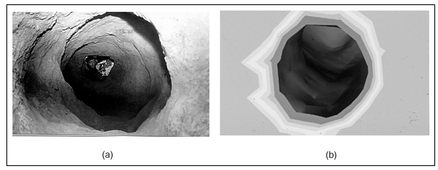
Figure 12.12. Comparison of (a) a photograph of an excavated tunnel and (b) a three-dimensional GDT image of a tunnel prior to excavation.
In September 1993, a GDT imaging team accompanied Tom Levy and the UCSD team on a National Endowment for the Humanities sponsored archaeological expedition to Shiqmim. Since this expedition was expected to be the last of its type at Shiqmim, one goal of the expedition was to use GDT to establish how pervasive the subterranean architecture is at the site. There was an additional goal, this being the evaluation of a new imaging algorithm and data acquisition instrumentation based on a traditional seismic reflection geometry (Sect. 11.6).
Since it was not feasible to attempt to tomographically image the entire 40 kilometer stretch of the Beersheva Wadi, a hillside about300 meters east of the main excavation was selected. There was no prior knowledge about the existence of subterranean features m this portion of the site and thus, it was taken to be representative of the ten hills in the area. Tomographic cross-sections of vertical slices were reconstructed in real time and in the field. In the evenings, software was applied to produce three-dimensional color renderings of subterranean features. When the field survey was complete, a full three-dimensional image revealed a honeycomb of subterranean architecture. This rendering is shown in Fig. 12.13.
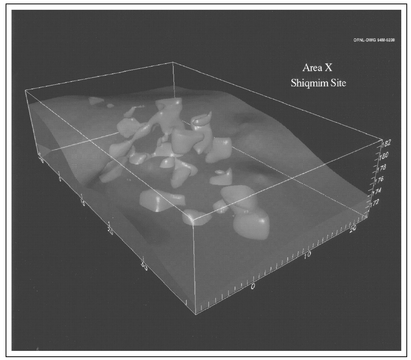
Figure 12.13. Three-dimensional GDT image showing a honeycomb of subterranean features at Shiqmim.
This image shows numerous subterranean rooms and tunnels as well as some surface features. Figure 12.14a shows an enlargement of one area of the image presented in Fig. 12.13 to reveal, in more detail, an isolated subterranean room with a single tunnel entrance from the ground surface. A limited excavation of this area following the application of GDT revealed a surface access tunnel leading to a room as predicted by the imaging (Fig. 12.14b).
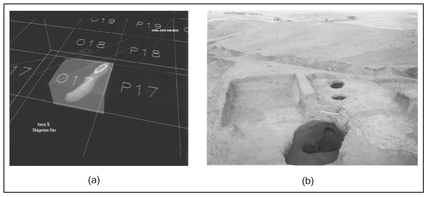
Figure 12.14. An (a) enlargement of the image shown in Fig. 12.13 that more clearly reveals an isolated room and access tunnel and (b) a photograph of the room after excavation.
1. A.J. Devaney, 'Geophysical diffraction tomography', IEEE Transactions on Geoscience and Remote Sensing GE-22 (1984): 3-13.
2. E. Wolf, 'Three-dimensional structure determination of semitransparent object from holographic data', Optics Communications 1 (1969): 153-56.
3. A.J. Witten, 'The application of a maximum likelihood estimator to tunnel detection,' Inverse Problems 7 (1991): L49-L55.
4. D.D. Gillette, Seismosaurus the Earth Shaker. New York: Columbia University Press, 1993.
5. A.J. Witten, D.D. Gillette, J. Sypniewski, and W.C. King, 'Geophysical diffraction tomography at a dinosaur site', Geophysics 57 (1992): 187-95.
6. Photo courtesy of J. Wilson Bechtel, Southwest Paleontology Foundation.
7. T.E. Levy, 'Cult, metallurgy and rank societies—Chalcolithic Period (ca. 4500-3500 BCE)', in The Archaeology of Society in the Holy Land. Edited by T.E. Levy. London: Leicester University Press, 1995.
8. A.J. Witten, T.E. Levy, J. Ursic, and P. White, 'Geophysical diffraction Tomography: new views on the Shiqmim prehistoric subterranean village site (Israel),' Geoarchaeology 10 (1995): 97-118.