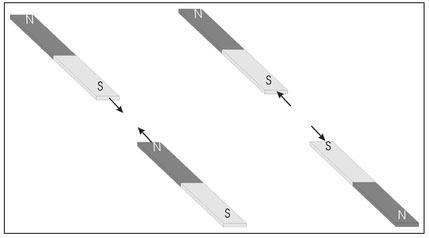
Figure 4.1. Illustration of the attractive force between opposite poles (N—S) and repulsive force between like (S-S) poles.
In Chapter 2, the concepts of scalars, vectors, and forces were introduced. The gravitational force was defined to be a force of mutual attraction between masses and it was demonstrated how changes in the force exerted on one mass can be used to detect subsurface variations in density. Magnetic force is conceptually similar to gravitational force; however, the force does not originate with mass but rather with magnets. A magnetic force is a force acting between two magnets so that, in geophysics, one magnet can be used to detect and locate a second, buried, magnet. This is another example of action-at-a-distance and, because the magnets do not have to be in contact with each other for there to be a force, magnetic forces can be detected at some distance. Conceptually, one magnet can be considered a measurement instrument used to detect and locate a second, presumed buried, magnet by the forces that act between the two magnets. This is the basic concept of magnetic forces in geophysics. The exploitation of magnetic forces in geophysics is known as magnetometry.
Magnetometry is only capable of detecting buried magnets and while this might appear to be quite limiting, it does have many uses. Many man-made objects are magnets and, although these can be quite weak, they frequently can be detected with sensitive tools of magnetometry. There are several types of magnets and by far the best known is the permanent magnet. There is a second type of magnet, known as an induced magnet, which further broadens the applicability of magnetometry. In fact, magnetometry is the most frequently applied geophysical method at archaeological sites. The reason for this is not only its broad applicability but its speed of data acquisition and ease of use.
The similarity between the magnetic force and the gravitational force is quantitative as well as qualitative. In scalar form, the equation governing the mutual force acting between two magnets is
Equation 4.1:
and this relationship is known as Coulomb's Law. This equation is almost identical to that given in Equation 2.1 for the gravitational force; however, here the m's denote the 'strengths' of two magnets (a quantity known as the dipole moment) rather than two masses.
A significant difference exists between the magnetic and gravitational force. Gravity produces only a force of attraction while, in contrast, there are both attractive and repulsive magnetic forces. The reason for this is that magnets are dipoles, i.e., they have two poles, conventionally called a north pole and a south pole, where opposite poles attract and like poles repel (4.1).

Figure 4.1. Illustration of the attractive force between opposite poles (N—S) and repulsive force between like (S-S) poles.
Because there are four poles associated with the two magnets (two north poles and two south poles), there are a total of four forces that must be vector summed (Sect. 2.1). For this reason, the result of this vector summation will depend on the distances between poles and the relative orientation of the two magnets. Figure 4.2 shows the relative direction of the four forces for two different orientations. Clearly, the total force acting in these two cases will differ considerably.
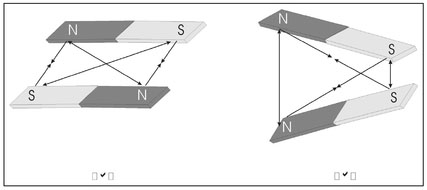
Figure 4.2. Illustration of the four forces acting for two different relative orientations of two magnets.
In Fig. 4.2a, attractive forces occur between the opposite poles of both magnets and repulsive forces exist between like poles. Since a magnetic force decreases with distance (Equation 4.1), and since the distance between opposite poles is less than that between like poles, clearly the resulting force will be one of attraction between the two magnets. Amore complicated situation is depicted in Fig. 4.2b where the two distances between opposite poles are equal and this distance is less than the distance between the two north poles but greater than the distance between the two south poles. The resultant force here would likely cause a rotation of one or both magnets.
A magnetic force is a composite of mutual forces acting among the poles of two or more magnets. With a single magnet, there can be no magnetic force; however, the magnetic force a single magnet is capable of producing if a second magnet were present is known as a magnetic field.
Although all magnets are dipoles, a hypothetical magnet having only one pole (monopole) can be considered. Letting this monopole be a south pole having a unit strength, m = 1, the force that a given dipole magnet exerts on this single pole can be characterized. Figure 4.3 depicts the forces acting on this unit monopole at three different locations relative to the bar magnet. When the monopole is on the north side of the magnet (above the dashed line separating the two poles), the force produced by the magnet's north pole (the vector labeled N) is an attractive force, since this force is a north pole acting on a south pole. The force exerted on the monopole by the south pole of the magnet (the vector labeled S) is a repulsive force since this is a force between like poles. Because, at this location, the south monopole is closer to the north pole of the magnet than the south pole of the magnet, the magnitude of the force exerted by the north pole is greater than that produced by the south pole. The resulting force (the sum of the two forces) is depicted as the bold vector. When the monopole is equidistant from both poles (on the dashed line in Fig. 4.3), the magnitude of the forces produced by the two poles of the bar magnet are equal; however, the direction of these two forces differs. The direction of the resulting force is parallel to the axis of the bar magnet. Positioning the unit monopole close to the bar magnet's south pole results in the force exerted by the south pole being greater than that exerted by the north pole and the resultant force is directed away from the magnet's south pole.
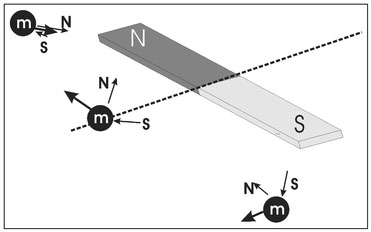
Figure 4.3. Illustration of the imaginary force that would be produced by placing a hypothetical south monopole at three different positions relative to a bar magnet. The force exerted by the north pole on the monopole is the vector labeled N and that exerted by the south pole is the vector labeled S. The bold vector is the sum of these two forces. The dashed line is the dividing point between where the magnet's north and south pole dominate the force.
A magnetic field is constructed by considering the force that would be created by locating a hypothetical south monopole at many locations around a magnet. Figure 4.4 is an example of a magnetic field shown as magnetic field lines. The direction of a particular vector indicates the direction of the force, and the length of the vector represents the magnitude of the force at a particular location. This collection of vectors is a representation of the field surrounding the magnet. The definition of a field line (Fig. 4.4) is somewhat different from the magnetic field discussed above as a collection of vectors. The magnitude of the magnetic force may vary along a field line; however, the direction of the line locally represents the direction of the vector force.
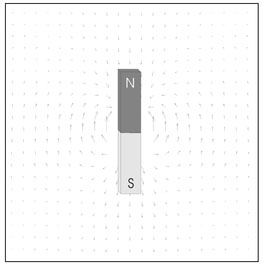
Figure 4.4. An example of a magnetic field where the length and direction of each vector represent the relative direction and magnitude of the force, respectively, at various points.
Contours of constant magnetic force magnitude are called magnetic field lines and these are illustrated in Fig. 4.5.
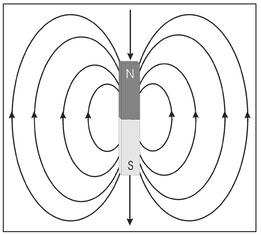
Figure 4.5. Illustration of contours of constant magnetic force magnitude (magnetic field lines).
The convention used in magnetic force is that a force of attraction (between opposite poles) is a negative force and that of repulsion (between like poles) is a positive force. For this reason, a south pole is labeled as the + pole and the north pole labeled as the -pole.
In magnetometry, magnetic fields are important for two reasons. First, they can create induced magnetization that allows the detection of objects that are not magnets in the traditional sense (permanent magnets). This important topic will be considered in Sect. 4.4. Second, while it is, in principle, possible to use the force exerted on one magnet by a buried magnet to detect the buried magnet, this requires either a quite powerful buried magnet or, because magnetic force decreases with distance between the two magnets, that the two magnets be in close proximity. Greater sensitivity can be achieved by measuring the effects magnetic fields can produce. Since magnetic force requires at least two magnets, these effects are not force-based.
In the foregoing discussion, an in was used in Equation 4.1 to characterize the strength of a magnet, which is a dipole, while in Fig. 4.3 it was used to characterize the strength of the force exerted on a single (south) pole. A symmetry exists within magnets where the two poles are of equal strength but opposite 'polarity.' Thus, if the strength of the north pole of a magnet is -in, then the strength of its south pole is necessarily +m. The pole magnitude m does not, by itself, quantify the magnet. The quantity that does completely define a magnet is its dipole moment. The ambiguity between pole strength and dipole moment, as introduced in Equation 4.1, originates with the scalar form given by this equation. It should be clear by now that forces are vectors (Sect. 2.1), and, as such, are characterized by both a magnitude and direction. The scalar form of the magnetic force, as given in Equation 4.1, represents only the magnitude of the force.
The dipole moment of a magnet is properly represented by a vector and usually denoted by m. The magnitude of the dipole moment is defined to be the product of the pole strength m and the distance separating the two poles l. The direction of the dipole moment is along a line connecting the two poles and points from the north (-) pole to the south (+) pole (Fig. 4.6).
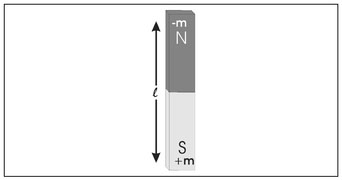
Figure 4.6. Illustration of the dipole moment of a magnet. Here, l is the distance separating the two poles used to compute the dipole moment.
In Fig. 4.4, the magnetic field surrounding a magnet was used to characterize a magnet. The dipole moment is a more fundamental means to characterize a magnet where the magnetic field and magnetic dipole moment are intimately related. Given a magnetic field about a magnet, the magnet's dipole moment can be completely characterized. Similarly, the field around a magnet can be fully described from its dipole moment. Referring to Fig. 4.4, it is clear that increasing the magnitude of the dipole moment will produce a corresponding increase in the magnitudes of all the surrounding magnetic field vectors. Rotating the magnet will alter the direction of the dipole moment and produce a corresponding rotation of the magnetic field vectors.
Magnets are composed of materials with special properties. This is why there are no wooden magnets or silver, gold or copper magnets. Objects that are permanent magnets (permanent is, in this case, a relative term since magnets can be 'demagnetized') must contain iron, cobalt, or nickel. Because these elements can be magnetized, they are referred to as ferromagnetic. The reason these materials can be magnetized is related to their atomic structure. For ferromagnetic materials, the electron orbits of all atoms can become aligned. The magnitude of a magnet's dipole moment will depend on its relative content of a ferromagnetic element. Magnets rich in an element such as iron can be stronger than those in which a ferromagnetic element is a minor constituent. Ferromagnetic content is not the only factor that influences the magnitude of the dipole moment. Since the dipole moment depends on the distance between the two poles, all other factors being equal, a longer magnet should be stronger than a shorter one. A magnet's shape can also play a role in the dipole moment. The poles will be further apart in a bar magnet (such as that illustrated in Fig. 4.4) than in a spherical magnet having the same volume so that, all other factors being equal, the bar magnet will be stronger.
Two paper clips do not 'stick' together and this suggests that paper clips are not magnets. Paradoxically, a paper clip will stick to a magnet. For the moment, accept the fact that this particular paper clip is a magnet; however, it will not stick to a refrigerator door and this implies that the refrigerator door is not a magnet. Recognizing that magnetic force requires at least two magnets and that a refrigerator door is not a magnet, an interesting question is why do magnets stick to refrigerator doors? The answer is that, along with permanent magnets, a second kind of magnet can exist called an induced magnet.
In Sect. 4.3, ferromagnetic elements were introduced and it was stated that, to be a permanent magnet, an object must contain a ferromagnetic element. Objects that contain ferromagnetic elements can be temporarily magnetized and this type of magnetization is called induced magnetization. Induced magnetization can also occur in another class of elements called ferrimagnetic. Since a thorough discussion of ferrimagnetism is outside the scope of this book and unnecessary for an understanding of exploiting geophysical magnetic measurements as they apply to archaeology, here no distinction will be made between ferromagnetism and ferrimagnetism and any element that can be magnetized either permanently or temporarily will be referred as ferromagnetic.
When a ferromagnetic object is exposed to a magnetic field, this object will become temporarily magnetized and this is induced magnetization. Like permanent magnets, induced magnets are characterized by a dipole moment. The magnitude of the induced dipole moment will depend, along with other factors, on the strength of the magnetic field to which it is exposed and the direction of the induced dipole moment will be along the local direction of the magnetic field. Figure 4.4 depicts the magnetic field vectors surrounding a bar magnet and this figure will serve as the basis for illustrating the character of induced dipole moments. In this presentation, a paper clip will be used to represent an object that contains a ferromagnetic element and will become an induced magnet. Figure 4.7 illustrates the paper clip at various locations around a permanent bar magnet.
Figure 4.7a shows the magnetic field vectors from a bar magnet with a paper clip touching its north pole. At this position of the paper clip, the magnetic field is directed southward. As annotated on this figure, this produces an induced north pole on the north side of the paper clip and a south pole on its south side. There are now two magnets, the permanent bar magnet and the induced paper clip magnet and, because there are two magnets, a magnetic force will result.
Since opposite poles attract, the south pole of the paper clip is attracted to the north pole of the bar magnet. Keeping the paper clip in the same position relative to the bar magnet but rotating it 90° (Fig. 4.7b) does not change the direction of the induced magnetic dipole moment (the north pole remains on the north side and south pole on the south side of the paper clip) but reduces the magnitude of the induced dipole moment. The reason for this is that, as discussed in Sect. 4.3, the magnitude of a dipole moment is proportional to the distance between the two poles. For the orientation shown in Fig. 4.7b, the induced poles are closer together than for the orientation shown in Fig. 4.7a.
Changing the location of the paper clip will alter the induced dipole moment in several ways. For the paper clip positioned as shown in Fig. 4.7c, both the magnitude and direction of the local magnetic field has changed. The direction of the induced dipole moment has changed as compared to those illustrated in Figs. 4.7a and 4.7b as a result of the local change in direction of the bar magnet's magnetic field. This field is also weaker so that the magnitude of the induced dipole moment is proportionally reduced. In this orientation, the induced pole separation is not as great as when the axis of the paper clip is aligned with the local direction of the inducing magnetic field (Fig. 4.7d) so that the induced dipole moment is weaker for this orientation; however, the direction of the induced dipole moment is the same for both orientations. Changing the orientation of the paper clip such that its axis is horizontal (Fig. 4.7e) will not change the orientation of the induced dipole moment from those given in Figs. 4.7c or Fig. 4.7d, but the magnitude of the dipole moment will be somewhat less than either of the other two orientations because the poles here are closer together.
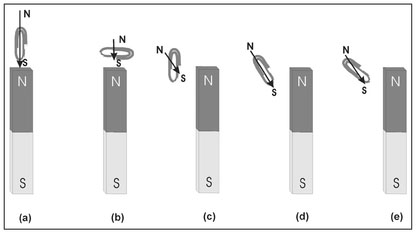
Figure 4.7. Illustration of the dipole moment induced in a ferromagnetic object, here represented by a paper clip, for various locations and orientations relative to a permanent bar magnet.
The magnitude of an induced dipole moment will be proportional to strength of the magnetic field to which it is exposed and its direction will be aligned with this field. This relationship can be expressed in the form
Equation 4.2:
m = k H,
where the dipole moment, m, and the external field, H, are written in bold typeface to explicitly indicate that both of these quantities are vectors. The parameter, k, is a constant that will subsequently be defined. In previous discussions, it has been established that the strength of the induced magnetic object (dipole moment magnitude) can also depend on the relative abundance of a ferromagnetic element that is present in the object as well as its size, shape and orientation relative to the direction of the inducing magnetic field, H, since these attributes influence the separation of the two induced poles which, in turn, influence the dipole moment. All of these factors are incorporated into the constant, k, given in Equation 4.2 and k is known as the magnetic susceptibility. This is appropriate terminology since it characterizes how susceptible an object is to becoming magnetized through its exposure to an external magnetic field.
The basic material property that quantifies an object's capacity to be magnetized is magnetic susceptibility per unit volume which is usually represented by k, the Greek letter kappa. As its name implies, like density (Sect. 2.5), it is independent of the size (volume) of the object and ferromagnetic elements or objects that are rich in these elements are easily magnetized and are characterized by a relatively large magnetic susceptibility per unit volume. Certainly, k has a strong influence on an object's induced dipole moment; however, its shape and orientation relative to the external magnetic field will affect the induced dipole moment. To incorporate shape and orientation into the characterization of the induced dipole moment a new property is introduced that is denoted by ka, referred to as the apparent magnetic susceptibility per unit volume, and defined by
Equation 4.3:
where k is the magnetic susceptibility per unit volume and η (the Greek letter eta) is called the shape factor. This shape factor depends on both an object's shape and its orientation relative to the external magnetic field. Equation 4.3 is mostly conceptual since shape factors are almost impossible to define; however, it does convey how the shape factor can impact the induced dipole moment. When the shape factor is zero (η = 0), the apparent magnetic susceptibility per unit volume, ka, is equal to the magnetic susceptibility per unit volume (k), so that the dipole moment is only dependent on the nature of the object's material, its size, and the external magnetic field. Conversely, when the shape factor is quite large, ka is approximately equal to 1/η and the material property k has no influence on the induced dipole moment.
The constant k introduced in Equation 4.2 is called the magnetic susceptibility and contains all influences on the dipole moment other than the external magnetic field. The basic material property, k, and shape and orientation of the object, η, are introduced by means of the apparent magnetic susceptibility per unit volume (Equation 4.3). The only remaining factor is the object's size and this is represented by its volume V. The magnetic susceptibility can now be defined as
Equation 4.4:
and the dipole moment is defined to be
Equation 4.5:
Equation 4.5 can be used to qualitatively investigate the nature of induced magnetic dipole moments and from this equation the following statements can be made.
The effect of the shape factor on induced dipole moments is described by Equations 4.4 and 4.5. However, this factor has not yet been related to specific object shapes and orientations. Shape factors are very difficult to compute and, consequently, only a few have been tabulated and these are for simple shapes. The smallest possible value for η is zero and this will occur for a thin rod that has its axis oriented along the direction of the external magnetic field (Fig. 4.8a). If an object has a shape somewhat like a thin rod with its axis oriented along the direction of the external field, it can have a large dipole moment. However, the magnitude of the dipole moment will depend on the magnetic susceptibility per unit volume, the object's volume, and the magnitude of the external magnetic field. The largest shape factor value occurs for a thin sheet with an external field perpendicular to the plane of the sheet (Fig. 4.8b). For this shape and orientation, the shape factor is equal to 4π(recall that π = 3.14 and is the ratio of the circumference of a circle to its radius) or η = 12.6. Objects similar in shape to a thin sheet can be quite difficult to magnetize and will have weak induced dipole moments, even for pure ferromagnetic materials (large k) unless the volume is large, there is a strong applied external field, or both. A sphere has a shape factor, η = 4π3, that is intermediate between the rod and the thin sheet. Because of the symmetry of a sphere, its shape factor is independent of its orientation relative to the external magnetic field.
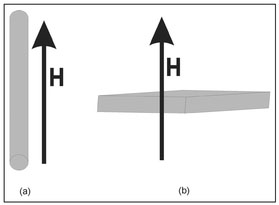
Figure 4.8. Illustration of the shape and orientation relative to the external magnetic field that (a) produces the smallest and (b) the largest shape factor.
Magnetic fields can exist in the absence of magnets. When an electric current flows through a wire or other object, a magnetic field will be created. A relatively strong magnetic field will exist if the wire is coiled and the field produced will be similar to that produced by a magnetic bar with its axis aligned with the axis of the coil (in a direction perpendicular the plane of the coil). Although there will be a magnetic field, there is no magnetic force. Even if a magnet is present near the coil of wire, there is still only one magnet and, for this reason, there can be no magnetic force.
Since a magnetic field can induce magnetism, a ferromagnetic object located near the coil of wire will become an induced magnet. This type of induced magnet is called an electromagnet. The magnetic field produced by a coil of wire is strongest in the center of the coil and the direction of the field here is along the axis of the coil. A relatively strong electromagnet can be created by inserting a ferromagnetic rod, such as an iron nail, in the center of the coil. The induced magnetism is relatively strong because (1) the object is ferromagnetic, (2) it is exposed to a strong magnetic field, and (3) for its shape and orientation, it has a shape factor that is nearly zero.
When a magnetic force exists, it is related to an associated magnetic field through a parameter referred to as the magnetic permeability and is usually denoted by μ (the Greek letter mu). The magnetic permeability accounts for the property of the material that can exist between the two magnets. For example, if this material is ferromagnetic, the resulting induced magnetization would alter the force. For air, water, and most geologic materials, the magnetic permeability is quite small and approximately equal to the value for a vacuum, μ = 4π X 10-7 ohm-seconds per meter. Again, π is the ratio of the circumference of a circle to its diameter and the scientific notation 10-7 = 1/10000000 is used. The magnetic permeability is the ratio of the magnetic force (sometimes referred to as the magnetic induction) to the magnetic field.
The units of magnetic field strength are amperes per meter and those for magnetic force are voltseconds per metr or Tesla. The magnetic forces typically measured in geophysical applications are quite small so that units of magnetic force are generally given as nanoTesla (n T) where 1 nT = 10"9 Tesla. Another commonly encountered unit of magnetic force is the gamma and one gamma is equal to 1 nT.
The fact that the Earth has a magnetic field is important since it is this field that induces dipole moments in ferromagnetic materials allowing their detection by magnetic measurements. For both permanent and induced magnetization, magnetic measurements will include components associated with both subsurface features and the Earth's magnetic field. If the ultimate objective of magnetic measurements is to locate near-surface magnetic anomalies, the features must be distinguished from the Earth's magnetic field. For this reason, it is important to understand and characterize the nature of the Earth's magnetic field.
The Earth's magnetic field can be represented by the superposition of magnetic fields from a number of dipoles of differing dipole moments distributed within the interior of the earth. More than 90% of the Earth's magnetic field can be attributed to one dipole located at the center of the Earth's interior. The current theory for this magnetic source is the convection occurring in the Earth's molten iron core. This dipole has its moment vector pointing towards the magnetic south pole so that, using the conventions presented in Sect. 4.3, the north pole is negative and the south pole is positive. The Earth's magnetic poles do not precisely correspond to its geographic poles (the intersection of the axis of rotation with the Earth's surface). Figure 4.9 shows the orientation of the major magnetic dipole relative to the geographic poles with the Earth's magnetic field vectors superimposed. The magnitude of the Earth's magnetic field (Sect. 4.5) is in excess of 70,000 nT at the poles and has a minimum value of about 35,000 nT near the equator.
It is important to recognize that, in magnetic exploration, the magnetic field or force that is measured will be the superposition of the Earth's background magnetic field or magnetic force along with the contributions from anomalous permanently magnetized or induced features. The spatial variations in the Earth's magnetic field become important to consider because these spatial variations must be distinguishable from those associated with magnetic anomalies in order for these anomalous features to be detected. It can be shown that, for areas over which magnetic measurements are made in near-surface geophysics, spatial variations in the Earth's background magnetic field or magnetic induction can be ignored. This is analogous to the discussion of a flat or spherical Earth presented in Sect. 2.4 where it was demonstrated that, for spatially localized areas on the Earth's surface, the Earth's gravitational acceleration can be considered as constant. Since the surface of the Earth is far from the Earth's magnetic source (about 6,000 km), the Earth's magnetic field can be considered as locally constant.
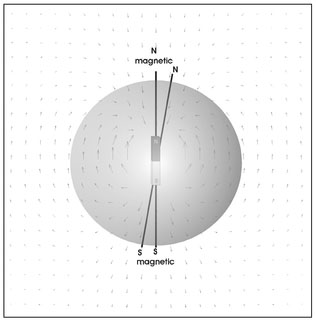
Figure 4.9. Illustration of the Earth's dominant magnetic dipole in relation to the geographic poles and the Earth's magnetic field vectors.
Taking, for example, a 45° magnetic mid-latitude, the rate of change in the north-south direction is about 8 nT and 4 nT per kilometer for the radial (vertical) and tangential (horizontal) components, respectively. This rate of change in the north-south direction is sufficiently small that, for most magnetic measurements, it can be considered as constant. For the single dipole model considered here, there will be no change in the Earth's magnetic field in the east-west direction. There are, in fact, variations in the Earth's magnetic field in the east-west direction. These variations are a result of the contributions of other dipole sources; however, the spatial rate of change in the east-west direction will be less than the north-south variations characterized here by the single dipole source representation.
A compass is simply a bar magnet and direction orientation that can be provided by a compass by virtue of the fact that a powerful bar magnet exists within the Earth's center. A compass exploits the fact that like magnetic poles repel and opposite poles attract. Therefore, when the compass is in the northern hemisphere, the south pole of the compass magnet is attracted to the north pole of the Earth's central magnet (not the Earth's magnetic north pole, Fig. 4.9) and the north pole of the compass magnet points towards the Earth's magnetic north pole (Fig. 4.10). In the southern hemisphere, the north pole of the compass magnet is attracted to the south pole of the Earth's magnet and, consequently, the compass's north pole points northward (Fig. 4.10). This navigation process fails near the equator because both poles of the compass magnet lie between the poles of the Earth's central magnet (Fig. 4.10). In this case, the north pole of the compass magnet is attracted to the south pole of the Earth's magnet and, as a result, the north pole of the compass magnet points southward.
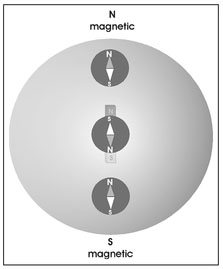
Figure 4.10. Illustration of the orientation of a compass magnet at three different latitudes.
Another way to characterize the effect of the basic material property magnetic susceptibility per unit volume (Sect. 4.4.2) and to quantify the effect of the Earth's magnetic field on near-surface ferromagnetic materials is to consider the magnetic dipole moment induced in a sphere composed of a pure ferromagnetic element. Here, the dipole moment of a 0.05 m radius iron sphere induced by the Earth's magnetic field is taken, for comparative purposes, as a baseline. For material of lesser magnetic susceptibility per unit volume, k, a comparable dipole moment can be induced from the Earth's field at the same location provided that, as given by Equation 4.5, it has a greater volume. Table 4.1 lists various types of geologic material, their magnetic susceptibility per unit volume,1 and radius of a sphere of this material that will produce the same dipole moment as the 0.05 radius iron sphere.
Table 4.1. Comparative table of magnetic susceptibility per unit volume for various geologic materials and the radius of a sphere of each material that would produce a dipole moment comparable to a 0.05 m radius sphere of iron.
| rock type | K | sphere radius (m) |
| sedimentary rocks | 0.0003 | 0.49 |
| metamorphic rocks | 0.002 | 0.26 |
| granites and rhyolites | 0.003 | 0.23 |
| gabbros and basalts | 0.004 | 0.21 |
| ultrabasic rocks | 0.08 | 0.08 |
| magnetite | 15 | 0.05 |
From this table it is obvious that sedimentary rocks are not easily magnetized. Because of the low magnetic susceptibility per unit volume of this type of material, a sample of this material must be quite large for it to exhibit any induced magnetism. In fact, the volume of a sphere of sedimentary rock must be about one-thousand times greater than a sphere of iron to manifest a comparable induced dipole moment.
There is a relationship between permanent magnetization and induced magnetization. The action of certain forces, magnetic forces as well as other forces, can result in the creation of a magnetic dipole moment in certain materials that will persist long after the force that induced this magnetization has ceased. This type of magnetization is called remnant magnetization. For example, the exposure of a ferromagnetic material to a sufficiently high external magnetic field or mechanical forces acting on a ferromagnetic material will result in permanent magnetization. Other types of remnant magnetization are described briefly below.
For some geologic materials, remnant magnetization is far more significant than induced magnetization. As a result of material forces that have acted on such materials in the past, they have a dipole moment that is independent of any current external field and their dipole moments reflect the orientation of the external field at the time of magnetization. The most important types of remnant magnetization are thermoremnant magnetization and viscous remnant magnetization. The measure of the relative contribution from remnant and induced magnetization is the so-called Q factor which is the ratio of typical values of the remnant dipole moment to the dipole moment induced in a comparable volume of geologic material. Table 4.2 provides values of Q factors for several rock types.
Table 4.2. Q factors (the ratio of remnant to induced magnetization) for various rock types.
| rock type | Q factor |
| Basalt | 100 |
| Gabbros | 20 |
| Granite | 5 |
To better comprehend the units of magnetic force (induction) and to further quantify the differences between permanent, induced, and remnant magnetization, it is useful to reexamine Tables 4.1 and 4.2. For all materials given in Table 4.1, the induced magnetic force one meter away from the center of the sphere of given radius would be 15 nT. It is clear from Table 4.2 that, for these materials, remnant magnetization can be responsible for a much greater magnetic force than induced magnetization. For example, the 15 nT induced anomalous magnetic force for the spheres of basalt, gabbros and granite would be 1500 nT, 300 nT, and 75 nT, respectively, if these materials have remnant magnetization.
Permanently magnetized features are usually associated with man-made ferrous metal objects. Such objects can become magnetized by mechanical forces that were exerted on these objects during their manufacturing process such as the rolling of steel. To provide perspective on the magnitude of magnetic force associated with permanently magnetized objects, consider the anomalous magnetic field measured over an 81 mm mortar shell. The maximum measured magnetic field was about 200 nT for a measurement made approximately one meter above this mortar shell. Since the measurement distance here is the same as that assumed for the induced magnetic field of a 0.05 m radius iron sphere, the two can be compared directly. At a comparable distance the magnetic field induced in the sphere is 15 nT compared to 200 nT for the permanently magnetized mortar shell. Since the magnitude of a magnetic anomaly is linearly proportional to the dipole moment, the permanent dipole moment is more than 30 times greater than the induced dipole moment in the iron sphere. For this comparison to be relevant, the mass or, alternatively, volumes of these objects must be considered. An 81 mm mortar is 81 mm in diameter and approximately 280 mm long. The mortar shell has an exterior steel casing and is filled with a non-ferromagnetic material (the explosive). The thickness of the steel shell is much less than 5 mm; however, the thickness will conservatively be assumed here to be 5 mm. With these dimensions, the volume of steel can easily be computed and, based on this volume, the radius of a solid steel sphere having comparable volume can subsequently be computed. It is found that this equivalent radius is 0.04 m making the mortar shell smaller than the iron sphere; however, the mortar shell has a substantially greater dipole moment.
For the application of magnetic measurements in near-surface geophysics, any magnetic fields that are not associated with near-surface magnetic sources can be considered external. By this definition, the Earth's magnetic field can be considered as external. However, as demonstrated above, with relatively small-scale magnetic measurements, the Earth's field is essentially constant, contributing only a constant value to all measurements. Magnetic features on or above the ground surface can also be regarded as external fields and, to some extent, these external fields must be considered in the design of a magnetic survey.
Here, external magnetic fields are taken to be fields caused by magnetic sources so far away from the study region that these fields are constant in space but vary over time. Because magnetic measurements are made by moving the measurement instrument in space at a certain temporal acquisition speed, temporally varying magnetic fields can appear as spatial variations in the measurements. Since near-surface magnetic features are recognized by the spatial variations in the magnetic field they produce, timevarying magnetic fields will appear in magnetic data as spatial variations that can be misinterpreted as subsurface magnetic anomalies.
The two main sources of this type of magnetic field are both associated with the sun. The sun has its own magnetic field that is quite strong. However, because the sun is such a great distance from the earth, its field strength anywhere on the Earth is relatively small. Furthermore, since the earth is so far from the sun, the solar magnetic field on Earth is essentially constant. Temporal variations in the solar magnetic field can occur as a result of sun spots and solar magnetic storms. These variations can occur over time periods as short as several minutes and can change the solar magnetic induction on earth by as much as 1000 nT. The second type of external field is associated with the solar wind. The solar wind is a continuous stream of charged particles emitted by the sun that travel far into space. These particles are attracted by the Earth's magnetic poles and, because the earth's magnetic poles do not coincide with the geographic poles, these charged particles spiral into the poles. Since moving charged particles represent a flow of electrical current and electrical currents induce magnetic fields (Sect. 4.4.3), the solar wind produces a magnetic field that varies diurnally with the rotation of the Earth about its axis relative to the magnetic poles. Temporal variations in the magnetic induction associated with the solar wind can be as much as 30 nT.
This section provides a brief overview of the tools commonly used for magnetic measurements. These types of instruments are called magnetometers. The intent of this section is not to provide a complete discussion of the principles of operation of each of these instruments, but rather, to concentrate on what these tools measure, their sensitivity, and their data acquisition speed.
Magnetometers measure the magnetic field, or a component of this field, rather than the magnetic force. While a compass (Sect. 4.6.1) could be used as a magnetometer to measure magnetic force, and will work for sufficiently large magnetic anomalies, it is too insensitive for most applications. The three commonly employed types of magnetometers are discussed individually below. Each of these uses indirect techniques to measure the magnetic field.
Flux-Gate Magnetometers—This type of magnetometer exploits the inverse of the magnetic dipole induced in a ferromagnetic rod by an electrical current flowing through a wire wound around the rod (Sect. 4.4.3). When a ferromagnetic rod is exposed to an external magnetic field, a dipole moment is induced in this rod. In turn, the magnetic field produced by this induced magnetized rod induces an electrical current in a coil of wire that is wound around the rod. This induced current can be measured and will be proportional to the strength of the component of the external magnetic induction along the direction parallel to the axis of the rod. Because flux-gate magnetometers measure the component of the vector magnetic field along the direction of the axis of the magnetometer's rod, they can be considered vector instruments. This fact introduces certain benefits and limitations. The obvious benefit is that three flux-gate magnetometers can be integrated into a single instrument. By orienting each of the three rods in orthogonal directions, the three components of the magnetic field can simultaneously be measured. The problem with such a configuration is that it is quite sensitive to instrument orientation. To appreciate this limitation, consider the radial (vertical) component of the earth's magnetic field measured by a tri-axial flux gate magnetometer. Assuming a mid-magnetic latitude 45° and a slight instrument inclination of 1°, the error associated with instrument tilt is about 424 nT. This error is substantial. However, it is important to note that flux-gate magnetometers are not this sensitive to the orientation of the ferrous rod so that the 424 nT estimate is excessive but serves to demonstrate the effect.
Most flux-gate magnetometers are designed to measure the vertical component of the magnetic field and can provide measurements accurate to about 1 nT without sophisticated leveling. The cycle time for flux-gate magnetometers is quite short so that they can be used to acquire data at a rate of many samples per second.
Proton Precession Magnetometers—This type of magnetometer consists of a coil of wire surrounding a container filled with a hydrogen-rich fluid. When power is applied to the coil, a magnetic field is induced in a direction parallel to the coil axis. The protons of the hydrogen atoms act as minute dipoles and align themselves with this field. When the current to the coil is suspended, the external field is removed and the protons will precess (spin) at a certain frequency around the direction of the magnetic field to which the fluid is exposed. This will be the Earth's magnetic field as well as the field produced by any other magnetic sources. The precession of the protons induces an alternating current in the coil and the frequency of this alternating current will be the precession frequency. The precession frequency and, hence, the frequency of the alternating current will be proportional to the strength of the magnetic field.
Proton precession magnetometers measure the magnitude of the magnetic field vector, often referred to as the total field. The operation of this magnetometer requires that the axis of the fluid-filled container be approximately aligned with the direction of the magnetic field vector being measured. In most circumstances, the major component of this field vector is the Earth's background field and, as such, the magnetometer cylinder must be aligned within about 45° of the Earth's field. Proton precession magnetometers are slightly more sensitive than flux-gate magnetometers and are less sensitive to the orientation of the instrument. There is a cycle time associated with a proton precession magnetometer measurement because the measurement process involves several steps—applying and then removing an external field followed by the establishment of proton precession. This cycle time can be almost one second, making data acquisition slower for proton precession magnetometers than for flux-gate magnetometers.
Alkali Vapor Magnetometers—This type of magnetometer, also known as an optically pumped magnetometer, is similar to the proton precession magnetometer in that it requires the precession of certain types of atoms when exposed to a magnetic field. Alkali vapor magnetometers, however, do not rely on a current induced in a coil. Instead, they exploit the changes in optical transparency of alkali vapors, usually cesium, when exposed to a magnetic field. A polarized light having a certain wavelength is passed through a sample of this vapor and the magnitude of the magnetic field can be inferred from the measured intensity of the transmitted light. Like proton precession magnetometers, alkali vapor magnetometers measure the magnitude of the magnetic field vector (total field); however, alkali vapor magnetometers are more sensitive to the orientation of the instrument relative to the direction of the measured magnetic field and, typically, the axis of the magnetometer cylinder must be aligned within about 15° of the direction of the measured field.
Alkali vapor magnetometers are far more sensitive than either flux-gate or proton precession magnetometers, having a sensitivity of about 0.01 nT. This sensitivity does not necessarily make these type of magnetometer more desirable since this sensitivity is well below the ambient magnetic noise levels encountered at most sites. A major advantage of alkali vapor magnetometers over proton precession magnetometers is the sampling rate. Alkali vapor magnetometers can typically acquire data at a rate of ten samples per second.
As noted above, both proton precession and alkali vapor magnetometers measure the total magnetic field but require some degree of alignment with the direction of this field vector. If this alignment is perfect, the total field is equal to the component of the induction along the axis of the magnetometer. In most near-surface magnetic measurements, the magnetic field is the Earth's background field plus the magnetic field produced by near-surface magnetic features. Without knowing the characteristics of these other magnetic sources and, hence, the direction of the magnetic field they produce, there is no way to achieve proper instrument alignment short of continuously varying this alignment at every measurement point until a maximum measured value is obtained. This would be a very slow and impractical process so that proton precession and alkali vapor magnetometers are typically approximately aligned with the direction of the Earth's magnetic field and it is recognized that other sources of magnetic induction may not be detected if their directions are significantly different from that of the Earth.
There is another class of tools used for magnetic measurements. These types of tools are called magnetic gradiometers, or simply gradiometers. Gradiometers consist of two magnetometers, of any of the types listed above, separated by a relatively small distance. Typically, gradiometers store or display the measured value from both of the magnetometers within the gradiometer. However, the fundamental operating procedure is to subtract the magnetic field measured by the two magnetometers. External fields, such as the Earth's field (Sect. 4.6) or other external fields (Sect. 4.8), are associated with sources so far away that their contribution at each magnetometer within the gradiometer is virtually identical. For this reason, the contribution of external fields is eliminated in the gradient measurement. The removal of the Earth's background field is not essential since, as shown in Sect. 4.6, this field is constant over the typical extent of survey regions and, hence, contributes only a constant background value to all measurements. Since the Earth's magnetic field is in the order of 50,000 nT while near-surface magnetic anomalies may produce a field as small as 15 nT, the removal of the Earth's background field serves to make the relatively weak near-surface magnetic anomalies more apparent in the acquired data. The removal of temporally varying external magnetic fields such as those described in Sect. 4.8 is more important since magnetic measurements are made by moving the instrument over the surface of a site and, as a result, temporal variations in a magnetic field can be manifested as spatial variations.
Gradiometers can be constructed for a variety of orientations and separations between the two magnetometers. Mobility considerations dictate that the two magnetometers within the gradiometer must be relatively close together, typically no more than about one meter apart, otherwise the gradiometer would be difficult to move. The most common types of gradiometers are vertical gradiometers where the two magnetometers are arranged one above the other and horizontal gradiometers where one magnetometer is beside the other with both being at the same elevation. There is no reason why other configurations cannot be used.
When considering the quantity that is measured by a magnetometer or gradiometer, it must be remembered that the magnetic field is a vector and almost all tools used for magnetic measurements respond to a certain scalar component (Sect. 2.1) of this vector. This point is illustrated in Fig. 4.11 where the Earth's magnetic field vector and the vector field produced by some secondary magnetic source are drawn in black. The vertical component of this secondary source magnetic field, as would be measured by a flux-gate magnetometer, is shown in medium gray and the component of the secondary source magnetic field along the direction of the Earth's field, as would be measured by a proton precession or alkali vapor magnetometer, is drawn in light gray. The magnitudes of these two vectors are clearly different suggesting that different magnetic measurement tools can produce differing results.
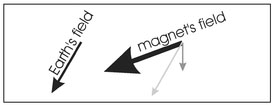
Figure 4.11. Illustration of the Earth's magnetic field vectors and the vector field from a secondary source at some point (black). The secondary magnetic field vector is decomposed into a vertical component (medium gray) and the component along the direction of the Earth's magnetic field (light gray).
To further characterize the differences in measurements among different magnetic instruments, consider the sequence of patterns of field lines shown in Fig. 4.12. The field around a magnet taken to be buried horizontally relative to the Earth's surface is shown in Fig. 4.12a. The Earth's field will always be present in a magnetometer measurement and this field will be locally constant (Sect. 4.6) as shown for a mid-northern latitude in Fig. 4.12b. The actual field in the vicinity of the buried magnet will be a superposition of the magnet's field and the Earth's field (Fig. 4.12c).
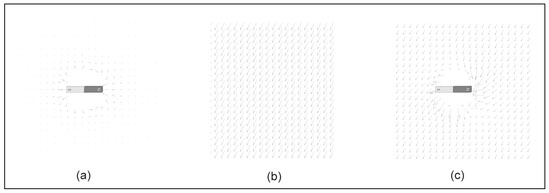
Figure 4.12. Magnetic field vectors (a) around a magnet buried horizontally with respect to the Earth's surface, (b) locally in a mid-northern latitude, and (c) the superposition of the contributions from the magnet and the Earth.
Figure 4.13 shows graphs of the vertical component (solid line) and the component along the direction of the Earth's magnetic field (dashed line) for measurements made on or just above the Earth's surface along a line directly over the top of a buried magnet with its axis aligned horizontally with respect to the ground surface and pointing in a north-south direction. For almost all magnetic measurements, the Earth's magnetic field will be considerably larger than that produced by any buried magnetic feature. For this reason, the constant background contribution from the Earth's magnetic field has been removed from this figure. Because it is assumed here that the magnet is buried horizontally and aligned north-south, there should be a symmetry in the north-south direction where the magnitude to the anomalous magnetic field produced by the north pole of the magnet is equal to that caused by its south pole. This is true for the vertical component (solid line, Fig. 4.13) but not for the component along the direction of the Earth's field (dashed line). An asymmetry is caused by the nature of the quantity measured by proton precession and alkali vapor magnetometers that will be absent in flux-gate measurements and, since the direction of the Earth's magnetic field varies globally, this asymmetry can be strongly latitude dependent.
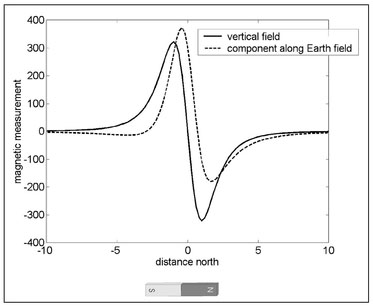
Figure 4.13. Graph of the change in the vertical component (solid line) and the component along the direction of the Earth's field (dashed line) directly over the top of a magnet buried horizontally with its axis aligned in a north-south direction.
There are numerous similarities between the fundamental concepts of magnetics and gravity (Chapter 2). For example, both exploit static forces and are based on essentially identical definitions of force (Equations 4.1 and 2.1). There are also fundamental differences between gravity and magnetic forces. Most importantly, gravity is a monopole force and the magnetic force is a dipole, and that drastically changes how these two measurements are interpreted. In addition, magnetic measurements can be made quite rapidly (Sect. 4.9) while gravity measurements are time consuming (Sect. 2.7), which allows for a far more efficient acquisition of magnetic data.
Magnetic data can be acquired along a line and displayed as line plots such as those shown in Fig. 4.13. In order to properly resolve a magnetic feature, it is necessary to sample (collect) the data at an appropriately fine spatial interval. This is quite similar to the spatial sampling presented for gravity (Sect. 2.9.1). Specific consideration for magnetic spatial sampling will be considered in Sect. 4.12.
Because of the rapid speed at which magnetic data can be acquired, most magnetic measurements are made over some horizontal two-dimensional area. Most modern magnetometers have internal data recorders and these instruments can be programmed to acquire data at fixed time intervals such as five samples per second. This type of sampling allows for quite efficient data acquisition without the need to grid a site (Fig. 2.23). Rather than establish a complete grid system, corners of the area to be surveyed are established with identified locations along which lines of data are to be collected (Fig. 4.14a). Data can then be acquired by walking (or towing) the magnetometer along each of these predefined data lines. Since the magnetometer can acquire data at a preprogrammed rate, the spatial sampling depends on the walking speed and temporal sampling rate. For example, if data acquisition is specified as five samples per second and 10 seconds are required to traverse a distance of 50 meters, the total number of samples collected is 5 samples per second X 10 seconds = 50 samples over a length of 50 meters. The spatial sampling interval is then the total distance traveled divided by the total number of samples or measurement spacing = 50 meters/50 samples = 1 meter. Data can be collected over sequential lines by walking in the same direction or, more efficiently, by walking in alternating directions (Fig. 4.14b). The process continues until the entire area is surveyed (Fig. 4.14c). The survey area need not be rectangular as shown in Fig. 4.14 but it is usually necessary to traverse straight and parallel lines.
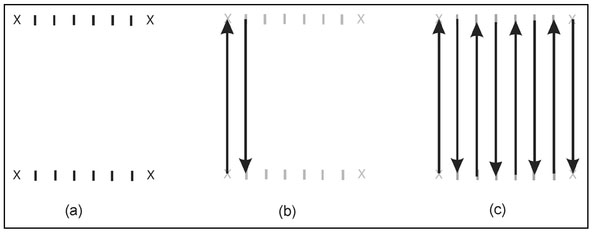
Figure 4.14. Illustration of an efficient procedure to acquire magnetic data where (a) corners of the survey area (X's) and walking lines (tick marks) are established and (b) data is acquired at fixed time intervals along each line until (c) all lines in the specified area have been traversed.
For this method of data acquisition to yield reasonably accurate measurement locations, walking speed must remain constant along any one line; however, this speed can change from line to line. Figure 4.15a shows the acquired data points (circles) along a single line provided that the walking speed remains constant. This yields measurement locations that are uniformly spaced along this line. For reference, the open circle indicated fifth (of nine) measurement points is properly located at the midpoint of the line. If the walking speed changes during the course of a single line, the measurement locations will be nonuniform. To illustrate the effects of a variable walking speed, assume that the walking speed is constant over most of the traversing line but slows at the end of a line (Fig. 4.15b). In this case, the measurement spacing is nonuniform and the fifth sample (open circle) is actually acquired away from the midpoint of the line. Since it has been assumed that the walking speed is constant, this measurement point will be incorrectly positioned at the midpoint of the line as given in Fig. 4.15a. If alternating line directions are used (Fig. 4.14c) and there is always a deceleration at the endpoint, measurement points will be misplaced in opposite directions (Fig. 4.15c) and, as shown, what are interpreted to be measurements made along a lateral (solid) line through the center of the survey region actually represent points along a saw-toothed (dashed) line.
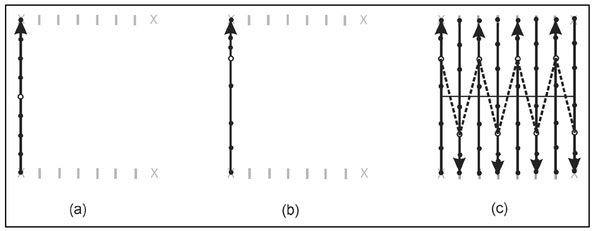
Figure 4.15. Illustration of the effects of variable walking speed when time-recording magnetic data. The circles show measurement locations along a line where the open circle is the fifth out of nine points acquired. For a constant walking speed along a single line (a), these measurement points are uniformly spaced along the entire line. When the walking speed slows as the end of the line is reached (b), points are no longer uniformly spaced and the mid-time sample is no longer at the center of the line. A consistent end-of-line deceleration for alternating line directions (c) will produce points that are dislocated in alternating directions on sequential lines.
To avoid such problems in this form of data acquisition it is necessary to start a traverse ahead of the beginning of each line so that a constant walking speed is achieved before data acquisition is initiated. At the far end of each line, data acquisition must be completed prior to any deceleration.
Because of the rapid rate of acquisition of magnetic data, almost all magnetic measurements are twodimensional. Magnetoeter manufacturers provide software for conveying data from the instrument to a computer that allows the transfer of this data acquired in a variety of measurement configurations (Sect. 4.10.1) and formatting this information such that it can be used in commercially available graphics software. Figure 4.16 shows the same synthesized two-dimensional magnetic data acquired over a horizontal plane as a contour plot, false color (gray-scale) plot and surface plot (Sect. 2.9.2).

Figure 4.16. The display of synthetic magnetic data for a horizontally oriented dipole displayed as a (a) contour plot, (b) gray-scale plot, and (c) surface plot. The Earth's constant background magnetic field has been removed.
In examining Fig. 4.16 it must be recognized that gravity measurements respond to spatial distribution of density variations (Sect. 2.5) and hence yield some reproduction of feature shape (Sect. 2.10). In contrast, magnetic measurements respond to the dipole moment (Sect. 4.3) of the magnetic source and provide no shape discrimination. This is why the magnetic data (Fig. 4.16) exhibits a bipolar character. The contour plot (Fig. 4.16a) shows two sets of concentric contours—positive values above the south pole of the presumed buried magnet and negative values about its north pole. From these patterns of contours, qualitative information can be obtained about the horizontal location, orientation, and relative depth and magnitude of the magnetic source.
The location of a magnet and its dipole moment (Sect. 4.3) are both vectors and, as such, each can be characterized by three orthogonal (perpendicular) components (Sect. 2.1). For example, the magnet's location can be completely quantified by three position components of the location vector that can be defined as its distance east and distance north of an arbitrary reference position as well as its depth relative to a horizontal plane such as the local ground surface. Similarly, the dipole moment vector can be decomposed into its three vector components or, alternatively, its magnitude and two angles that define its orientation. The angles can be the horizontal orientation of the magnet's north pole in degrees relative to the Earth's magnetic north and the inclination of the magnet's north pole in degrees relative to horizontal. It is possible to infer these characteristics from visual inspection of magnetic data such as those shown in Fig. 4.16.
To elaborate oil this type of interpretation, consider the four magnetic features defined in Table 4.3. The orientation of the dipole moment is defined by two angles. The horizontal angle is the angle, in degrees, of the magnet's north pole relative to the Earth's magnetic north direction. For example a horizontal angle of 90° indicates that the magnet's north pole is to the east. Similarly, the vertical angle is defined as the direction of the magnet's north pole relative to horizontal so that a vertical angle of 90° defines the north pole as vertically upward. The vertical component of the magnetic field over a horizontal measurement plane that encloses all these features is displayed as a contour plot in Fig. 4.17 (next page).
Table 4.3. Locations and dipole moments for four magnetic features. The angles are in degrees based on the position of each magnet's north pole.
The horizontal orientations of the sources are obvious from the relative positions of two polar responses of each magnet in Fig. 4.17. Magnet 1 (lower left) has its north polar response to the southwest and its south polar response to the northeast. The dipole moment vector will be aligned with a line drawn through the center of these responses from the north to the south polar response. This indicates that the horizontal orientation of this magnet is towards the northeast. A similar analysis of the Magnet 2 (upper left) data confirms that its dipole moment vector is horizontally oriented to the south.
The vertical field component data for Magnets 1 and 2 also exhibit a symmetry between poles. For each positive contour line for a given magnet, there is a mirror-image identically sized and shaped negative contour line. This symmetry is a direct result of the fact that a magnetic force results from the contributions of two forces—one caused the magnet's north pole and the other by its south pole (Sect. 4.1). Consider two points symmetrically positioned on either side of a horizontally aligned magnet and for a horizontal measurement plane (Fig. 4.18a). The point on the north side of the magnet is a distance rN_N away from the magnet's north pole and a distance rs_N away from its south pole. For a point on the south side of the magnet, these distances are rs_s and rN_s. Since force is inversely proportional to distance from a pole (Sect. 4.1) and, for the horizontal alignment assumed here, rN_N = rs_s, rs_N = rN_s and equal but opposite forces exist at these symmetrically located points.
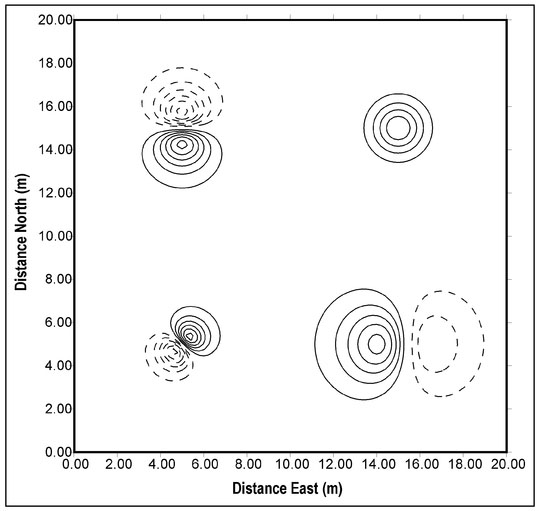
Figure 4.17. Contour plot of the vertical component of the magnetic field as measured on the ground surface over the four magnetic features defined in Table 4.3. Positive values of the vertical component of the field are shown as solid lines and negative values as dashed lines.
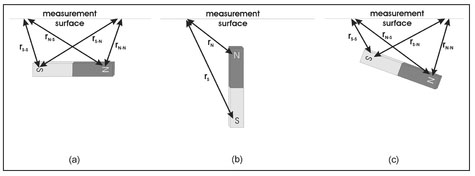
Figure 4.18. Illustration of the distances from a magnet's poles to measurement locations on a horizontal surface for (a) a horizontal magnet, (b) a vertical magnet, and (c) a magnet inclined with its south pole shallower than its north pole.
For a vertically aligned magnet below a horizontal measurement plane (Fig. 4.18b), the upper pole is closer to the measurement surface than the lower pole. As shown in this figure, the north pole is the upper pole and rN is always less than rs so that the measured field is everywhere negative. In the case of Magnet 4 (Fig. 4.17, Table 4.3), all the contour lines are positive, establishing that this magnet has a vertical orientation with a shallow south pole.
The vertical component of the magnetic field produced by Magnet 3 (lower right, Fig. 4.17) suggests that the north pole of this magnet occurs on the east side or that the dipole moment of this magnet is aligned from east to west. However, the South polar response is stronger than the north polar response, which implies that this magnet is horizontally aligned. Unlike the horizontally aligned magnet, the distances from the poles (Fig. 4.18c) are not equal and, for a shallower south pole, rN_N is greater than rs_s and rs-N is greater than rN_s. For this reason, such a vertical inclination will yield a stronger south polar response. This is the case for Magnet 3 and, hence, it can be concluded that this magnet has some vertical inclination with its south pole shallower than its north pole.
Quantitative depth estimation is considered in Sect. 4.12 and here a more qualitative analysis is presented. Like gravity (Sect. 2.12.1), the rate of change of the anomalous magnetic field associated with an isolated magnetic object is depth-dependent. As the magnet's depth increases, the field measured on a planar surface changes more slowly as the measurement is moved away from a local maximum (either a north or south polar response). This is manifested in contour plots as relatively closely spaced contours for a shallowly buried magnet with an increased spacing between contour lines for a deeper magnet. In Fig. 4.17, contour lines are more closely spaced for Magnet 1 than for Magnet 4 indicating that Magnet 1 is the deeper of the two magnets. This finding is confirmed by the actual magnet depths (Table 4.3).
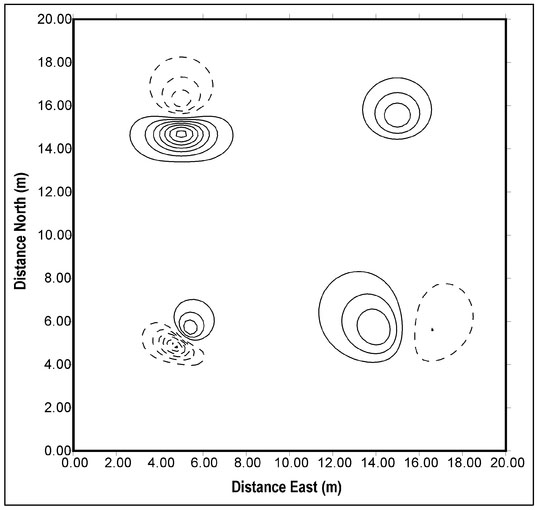
Figure 4.19. Contour plot of the magnetic field aligned with the Earth's magnetic field as measured on the ground surface over the four magnetic features defined in Table 4.3. Positive values are shown as solid lines and negative values as dashed lines.
Figure 4.19 shows the component of the magnetic field along the direction of the Earth's magnetic field for a mid-northern latitude for the magnetic features defined in Table 4.3. These are the same features for which the vertical component of the magnetic field is shown in Fig. 4.17 and it should be noted that significant differences appear between these two measured quantities. In particular, the polar symmetry exploited in the vertical component is absent for the field component along the direction of the Earth's magnetic field. For example, the symmetric, mirror-image pole evident in the vertical component for a horizontal magnet (Magnets 1 and 2, Fig. 4.17), does not occur for the field component along the direction of the Earth's magnetic field. Thus, qualitative analysis is more difficult when measurements are made using a proton precession or an alkali vapor magnetometer than for a flux-gate magnetometer. Since the Earth's magnetic field varies primarily with latitude, the character of the differences examined here will change with latitude.
Here, the definition! of external field (Sect. 4.8) is broadened to include any external features that may exist in magnetic data that are not attributable to buried objects of interest in a particular survey. These can be buried objects such as power lines or surface objects such as fences. In interpreting magnetic data, it must constantly be recognized that magnetometers are omnidirectional so that their response is not limited to sources that lie underground and, in some cases, detected magnetic sources can be located some distance outside the survey region. In order to avoid misinterpretation of magnetic data, it is necessary to be aware of the locations of all features that can possibly produce a magnetic response.
Figure 4.20a presents actual magnetic data acquired at a cemetery in Oklahoma2 as a gray-scale plot with contour lines superimposed. This data was acquired using an alkali vapor magnetometer. The sawtooth pattern visible in the contour lines is a result of variations in walking speed during the data acquisition (Sect. 4.10.1). One external field is immediately evident and that is the Earth's magnetic field. The measured magnetic field ranges from 51400 to 54150 nT and the variations in the magnetic field are perturbations about the Earth's background field of about 52000 nT. A number of spatially isolated magnetic features appear in the data including the small dipolar response at about 5 m west and 12 m south and a broader monopolar response at about 25 m west and 4 m south. There is also a continuous increase in measured magnetic field from the south to the north.
From this data alone, the following interpretation can be made.
While this interpretation is plausible, it is, for the most part, wrong. Figure 4.20b presents the magnetic data with an overlay of surface features mapped prior to data acquisition. An iron fence extends continuously along the south side of the surveyed area 4 m from the southern boundary. This fence is ferromagnetic and will produce a magnetic response. The increase in the measured magnetic field in the northward direction is a result of the presence of this fence. Since magnetic force decreases with distance from a magnetic source (Sect. 4.1), it might be expected that the magnetic field should decrease, rather than increase, away from the fence. There is no paradox here since all magnetic sources have two poles with, by definition, the north pole producing a negative response. Thus, when moving a measurement point away from a north pole, the response becomes less negative. Each element of the fence is a magnetic object. If it is an induced magnetic object, its north pole will occur on the north side (Sect. 4.6.2) and moving the measurement northward away from a north pole will result in a change in measured value that becomes less negative with distance. When these decreasing magnitude negative numbers are added to a constant positive number, here the Earth's constant local background field, the response will become more positive. From this analysis it can be concluded that the northward change in the measured magnetic field is a result of the iron fence.
The locations of all headstones in the magnetic survey region are indicated by rectangles on Fig. 4.20b. Given this information, it is clear that most of the isolated magnetic features that are apparent in the data are spatially correlated with headstone locations. These features are magnetic but they are not buried. Instead, they are a result of steel reinforcing bars within the concrete headstones. When the manifestations of all external fields are accounted for, there appears to be only one significant buried magnetic source, the one located at 25 m west and 4 m south.
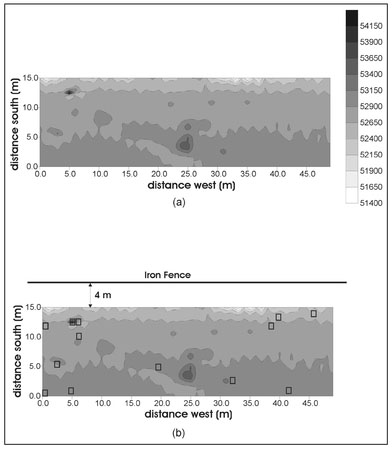
Figure 4.20. Display of magnetic data acquired with an alkali vapor magnetometer at a cemetery site displayed as (a) gray-scales with superimposed contour lines and (b) with surface features annotated.
There are a great many subsurface features that can be detected using magnetic measurements. Most of these are associated with permanent or remnant magnetization; however, induced magnetic objects can also be detected provided that they are of sufficient size and have a relatively large magnetic susceptibility (Sect. 4.6.2). A number of applications of magnetic measurements in geophysics are described below.
These last two items are particularly useful in archaeological prospecting and merit further discussion. When soils contain a ferromagnetic element, each grain of soil will become an induced magnet (Sect. 4.4.1) with its dipole moment aligned with the Earth's magnetic field. Figure 4.21 shows a local direction of the Earth's magnetic field and depicts each soil grain as a small bar magnet aligned with the direction of the Earth's magnetic field. In such situations and in the absence of any other magnetic features, magnetic measurements made anywhere over this region will yield the same constant value. This constant background value will be higher than that measurement if the soil is not ferromagnetic. The reason for this difference is that for non-ferromagnetic Soil the background field is only that produced by the Earth. When the soil is ferromagnetic, the Earth's magnetic field is reinforced by all the small bar magnets (soil grains) that are locally aligned with the Earth's field.
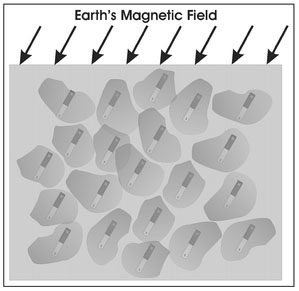
Figure 4.21. Illustration of the reinforcing of the Earth's background magnetic field by ferromagnetic soil.
An induced magnet remains magnetized for some time after the inducing magnetic field has been removed. This time duration is proportional to the time the object has been an induced magnet. A ferrous object exposed to a magnetic field for several minutes may remain magnetized for several seconds after removal of the inducing magnetic field. If the ferrous object is exposed to a magnetic field for several millenia, it could remain magnetized for tens or hundreds of years. When magnetism is induced for such long periods, there is a special name used to designate the persistent magnetism that remains. This is paleomagnetism.
If a small area of ferromagnetic soil is disturbed, the orientation of dipole moments of the disturbed soil grains will become randomized (Fig. 4.22). This situation generally persists for a short time with the dipole moments quickly re-orienting along the direction of the Earth's field (Fig. 4.21). This will be the case if the soil is not paleomagnetic. For paleomagnetic soils, the reorientation may require decades or longer. During this time there will be a gradual change back to a magnetically uniform state. However, before this state is achieved the soil dipole orientations will be locally random (Fig. 4.22) and, in this region, the magnetic fields caused by the soil will not reinforce the Earth's field. As a consequence, a relative localized magnetic low will occur above this area of disturbed soil. It must be recognized that this exploitation of paleomagnetism can only reveal relatively modern disturbances and limits the age of detectable activities to those that have occurred within the past century, at best. The use of magnetic measurement to locate areas of disturbed soil can be applied indirectly in the location of archaeological sites. Specifically, paleomagnetism can be used to locate past excavations that have been abandoned, subsequently backfilled by natural or other forces, and eventually lost.
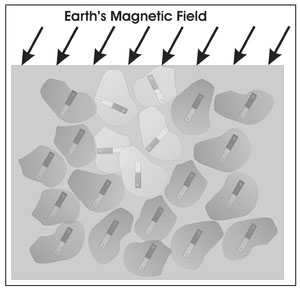
Figure 4.22. Illustration of an area of disturbed ferromagnetic soil where, for a short time, the dipole moments of the soil grains become randomized in the disturbed area.
A more common exploitation of ferromagnetic soil in archaeology is the mapping of buried stonewalls. Such an application of magnetometry will only be successful if relatively low magnetic susceptibility rocks such as limestone or other sedimentary rocks (Table 4.1) are buried in ferromagnetic soil. Under these circumstances, some of the magnetic soil is replaced by non-magnetic rock (Fig. 4.23). In a subsurface region of stone wall, there are fewer grains of magnetic soil to reinforce the Earth's magnetic field so that stone walls can be recognized as a pattern of linear or rectilinear lows in magnetic data.
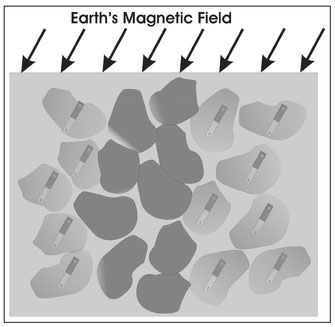
Figure 4.23. Illustration of the effect of the presence of a non-magnetic stone wall embedded in a background of magnetic soil.
The spatial rate of change in a measured gravitational force (Sect. 2.12) was used to estimate the characteristics of a buried object. It was shown that these characteristics could be estimated exactly (at least to within the accuracy of the measurements) provided that some assumptions about the feature size and shape are valid. A similar analysis is performed here for magnetic measurements and, although the general concepts applied to gravity data are valid, there are specific differences in the quantitative analysis. While changes in measured gravitational acceleration result from a density difference, shape, and orientation of a buried object, magnetic measurements respond to the location, magnitude, and orientation of the dipole moment vector of a buried magnetic object. Certainly, magnetic objects have a shape; however it is not directly manifested in magnetic measurements. In the interpretation of magnetic data, the role of shape and orientation as it applies to gravity measurements is replaced by the orientation of the dipole moment. A further complicating difference in magnetic feature estimation is that, unlike gravity data which always appear as a monopole, magnetic data is always dipolar in character. As a result, the estimation of magnetic feature characteristics can vary depending on which polar response is analyzed. All gravimeters (Sect. 2.8) measure the vertical component of gravitational acceleration; however, magnetometers can measure either the vertical component of the magnetic field (flux gate) or the magnetic field component along the direction of the Earth's magnetic field (proton precession and alkali vapor). Applying simple estimation procedures, such as those that will be presented here, can yield different results depending on the instrument used to acquire magnetic data.
This section will consider the estimation of magnetic target depth, evaluation of spatial sampling criteria, and the merits of magnetic gradient measurements (Sect. 4.9). Examples of these procedures are based on synthetic magnetic data. Table 4.4 lists the characteristics of five magnetic sources used in this pursuit and the synthesized component of the anomalous magnetic field along the direction of the Earth's magnetic field as would be measured on the Earth's surface is presented as a contour plot in Fig. 4.24. Magnet 4 in this table is taken to be an induced magnet produced by the exposure of an 8 cm radius iron sphere to the Earth's magnetic field.
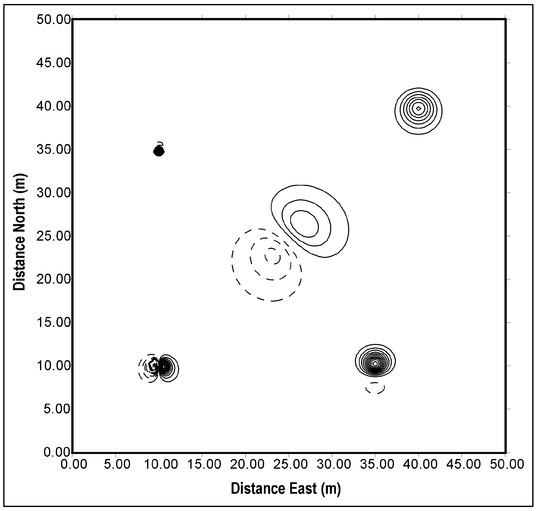
Figure 4.24. Contour plot of the component of synthetic anomalous magnetic data along the direction of the Earth's magnetic field for the five magnetic features defined in Table 4.4.
Some interpretation of the data shown in Fig. 4.24 can be accomplished by inspection. First, the horizontal locations of the targets that are manifested as dipoles (Magnets 1 to 4) are approximately at the zero point between the positive (south) and negative (north) lobes. For the feature that appears as a monopole (Magnet 5), the lateral position is approximately below the center of the concentric contour lines. Some information can also be extracted about the orientation of the features from the pattern of contour lines around each feature. Any features that appear as dipoles and are not aligned with the projection of the Earth's field onto the measurement plane (here, the north-south or γ direction) are likely to be permanent magnetic features with their horizontal component oriented in the direction from the negative to the positive lobes of the magnetic data. Thus, Magnets 1 and 5 are likely to be permanent magnets with the horizontal component of their dipole moments oriented approximately east-west and northeast-southwest, respectively. Since monopoles cannot exist, any feature that is manifested as a monopole, such as Magnet 5, is likely to be a permanent magnet with a vertically oriented dipole moment. Induced magnetic features will appear as dipoles with their dipole moment aligned with the Earth's magnetic field. Consequently, these dipoles will appear in magnetic data as dipoles with the horizontal component of their dipole moments aligned with the projection of the Earth's field onto the measurement plane. For the Earth's field considered here, this is the north-south direction. Therefore, it is not possible to differentiate between an induced and permanent magnetic feature when the dipole moment is so aligned. In Fig. 4.24, Magnets 2 and 4 can either be permanent or induced magnetic anomalies.
Depth estimation for gravity measurements was implemented with a so-called half-maximum rule (Sect. 2.12.1), where the half-maximum value, denoted by △x½, is defined to be the horizontal distance from the maximum anomalous gravity measurement to the point where it is half this value. A similar formula to that given for gravity (Equation 2.22) is given here based on the fact that the magnitude of the magnetic force far from a dipole magnet decays with the cube of the distance. Specifically, the half-maximum rule for estimating the depth d of a magnetic source is
Equation 4.6:
d = 1.3 △x½– h,
where h is the distance above the ground surface at which measurements are made. The inclusion of h in this formula explicitly represents the fact that magnetic measurements are typically made by walking with the magnetometer some distance above the ground surface. The cubic rate of decay on which Equation 4.6 is based is independent of the position of the ground surface and only based on distances from the magnetic source to the measurement instrument.
The fundamental difference between magnetic force and gravitational force is that, for an object having a density difference with respect to its surroundings, there is only a single force. The force exerted by a magnet is the vector sum of two forces, one caused by each of its two poles. This vector sum is not accurately represented in Equation 4.6 and, furthermore, no simple formula can be derived that would be exact under any circumstances.
Equation 2.22 will yield an exact estimate of feature depth provided that the buried object is a sphere. Changes in shape will introduce errors into the depth estimate (Sect. 2.12.2). The accuracy of the depth estimate for a magnetic target using Equation 4.6 will depend on the orientation of the magnet's dipole moment; however, there is no orientation for which this formula will be exact. The effect of dipole moment orientation on the half-maximum distance is illustrated in Fig. 4.25. Here, line plots of the vertical component of the magnetic field are drawn for the three orientations shown below. In all cases, the center of the magnet is 2 m below the measurement line. A solid circle on each graph indicates the location of the half-maximum value from the local high associated with the South (positive) pole. These half-maximum values are 2.4 m, 1.0 m, and 1.6 m that yield depth estimates (Equation 4.6) of 3.12 m, 1.3 in. and 2.08 m for the horizontal, vertical, and inclined dipole, respectively. Although the depth to the center of the magnet is the same in all cases, the depth to the shallowest pole changes with orientation and this is, in part, responsible for the varying depth estimates.
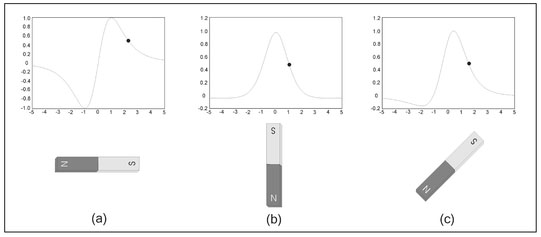
Figure 4.25. Graphs of the vertical component of the magnetic field as measured over (a) a horizontal magnet, (b) a vertical magnet, and (c) a magnet inclined at 45°.
Equation 4.6 is now used to estimate the vertical distance from the measurement plane to each magnetic anomaly shown in Fig. 4.24. As an aid in this estimation, an enlarged plot of the data around each target is shown individually in Figs. 4.26 to 4.30.
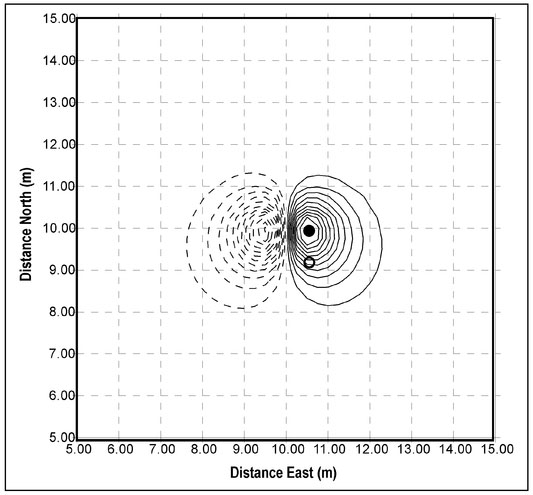
Figure 4.26. Contours of the component of the magnetic field aligned with the Earth's field in the vicinity of Magnet 1. Contour intervals are ± 20 nT. The solid and open circles indicate the location of a maximum value and a half-maximum value, respectively.
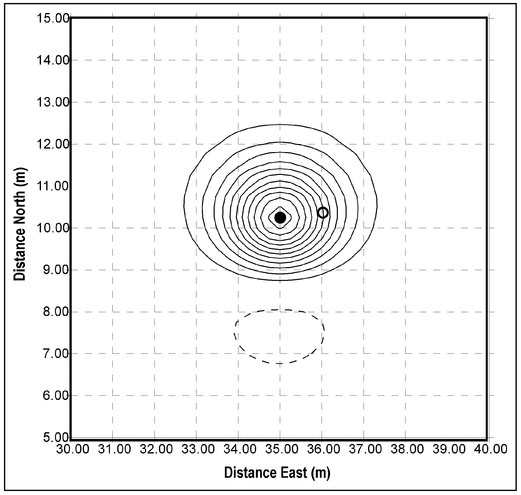
Figure 4.27. Contours of the component of the magnetic field aligned with the Earth's field in the vicinity of Magnet 2. Contour intervals are ± 20 nT. The solid and open circles indicate the location of a maximum value and a half-maximum value, respectively.
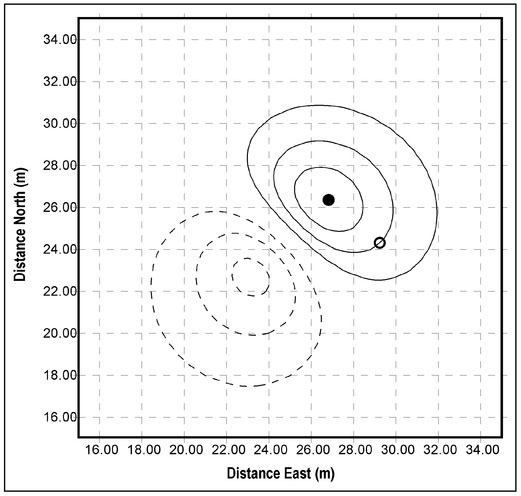
Figure 4.28. Contours of the component of the magnetic field aligned with the Earth's field in the vicinity of Magnet 3. Contour intervals are ± 20 nT. The solid and open circles indicate the location of a maximum value and a half-maximum value, respectively.
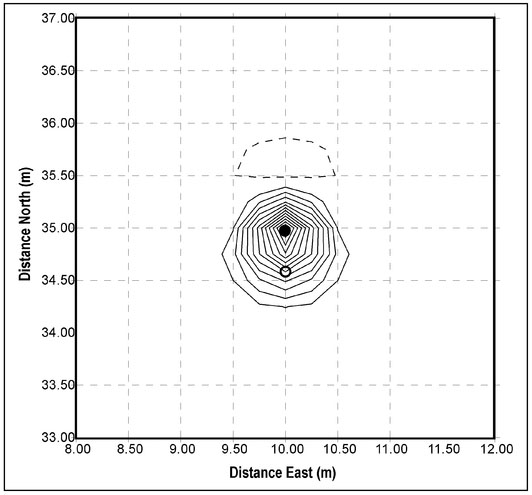
Figure 4.29. Contours of the component of the magnetic field aligned with the Earth's field in the vicinity of Magnet 4. Contour intervals are ± 20 nT. The solid and open circles indicate the location of a maximum value and a half-maximum value, respectively.
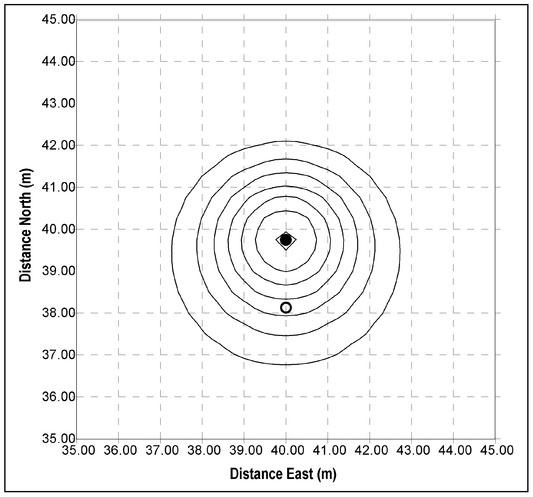
Figure 4.30. Contours of the component of the magnetic field aligned with the Earth's field in the vicinity of Magnet 5. Contour intervals are ± 20 nT. The solid and open circles indicate the location of a maximum value and a half-maximum value, respectively.
In these figures, the solid contour lines are positive values and the dashed lines are negative values. The half-maximum distances used in the depth estimation are the distances from the solid to the open circles indicated on each plot. Table 4.5 presents the results of the application of the half-maximum method (Equation 4.6) for the five magnetic features shown in Fig. 4.24.
Table 4.5. Estimates of magnetic target depths for the magnetic data presented in Fig. 4.24 and described in Table 4.4 using the half-maximum method.
| magnet no. | half-maximum distance (m) | depth (m) | |
| actual | estimated | ||
| 1 | 0.8 | 1 | 1.04 |
| 2 | 1.2 | 2 | 1.56 |
| 3 | 3.6 | 5 | 4.68 |
| 4 | 0.4 | 0.5 | 0.52 |
| 5 | 1.8 | 3 | 2.34 |
As indicated by the results presented in this table, the half-maximum rule provides reasonable depth estimates for all the magnets. This is expected for the dipole-like targets, Magnets 1 to 4. However, it may appear inconsistent for Magnet 5 which appears as a monopole source. In fact, Magnet 5 is a dipole and only appears as a monopole because of its vertical orientation. While the half-maximum method provides reasonable depth estimates, this is because the magnetic data shown in Fig. 4.24 is synthesized without any signal noise. As is evident in Figs. 4.24 to 4.30, different half-maximum distances can be defined based on the direction chosen from the maximum to a half-maximum value and the estimated depth can change simply on the basis of the direction selected. All depth estimates presented in Table 4.5 are based on half-maximum distances selected from the south (positive) polar response. Magnets 1 to 4 have a dipolar response so that either polar response can be selected for depth estimation. Using the north (negative) response for any of these magnetic features would result in a different estimated depth. Actual magnetic data will have noise making the estimate of the half-maximum distance less precise and, consequently, degrading the depth estimate.
The half-maximum formulation can also be used as a guide in establishing the spatial sampling when designing a magnetic survey. If it is assumed that it will be necessary to estimate target depths from magnetic measurements, then the spatial sampling must be such that the half-maximum distance can be resolved. It is clear from Equation 4.6 that the half-maximum distance is proportional to the vertical distance from the measurement plane to the magnetic target and, as such, the spatial sampling is dictated by the shallowest target of interest. In the case of the data shown in Fig. 4.24, this is Magnet 4 (Table 4.4) which is 0.5 m below the measurement plane. Using the representation for the half-maximum distance given by Equation 4.6, at this vertical distance the half-maximum distance is about 0.36 m. Thus, the spatial sampling should in some manner be related to this distance. The anomalous magnetic data presented in Fig. 4.24 was synthesized assuming a spatial sampling in both the, x and y directions of 0.25 m. This spatial sampling was used to ensure that the shallowest target would be well resolved. Since the anomalous magnetic field changes rapidly with measurement position for shallow targets, the manifestation of a shallow target in magnetic data will be restricted to a small horizontal region around the maximum value. If the spatial sampling is too coarse, shallow targets may appear in only one or several measurement points making it difficult to discriminate real magnetic features from noise. It is also possible that shallow magnetic features will be totally absent from the measurements with a coarse spatial sampling. For the deepest target shown in Fig. 4.24, Magnet 3, at a depth of 5 m, the half-maximum distance is about 3.6 m. Figure 4.31 is data synthesized for the same magnetic targets specified in Table 4.4 but using a spatial sampling of 2.5 m. For this spatial sampling, it should be expected that Magnet 3, the deepest target, will be well resolved; however, the resolution of the shallower targets is in question. It is clear by comparing this figure to Fig. 4.24 that, for this spatial sampling, there is little change in the manifestation of Magnet 3; however, the contours associated with all other targets have changed. Magnet 1 is completely absent and, while Magnets 2 and 4 still appear quite strong, they both appear as monopoles rather than dipoles. Magnet 5 has changed minimally and this is because it is 3 m deep and, for this depth, has a half-maximum distance of about 2.2 m which is comparable to the spatial sampling used.
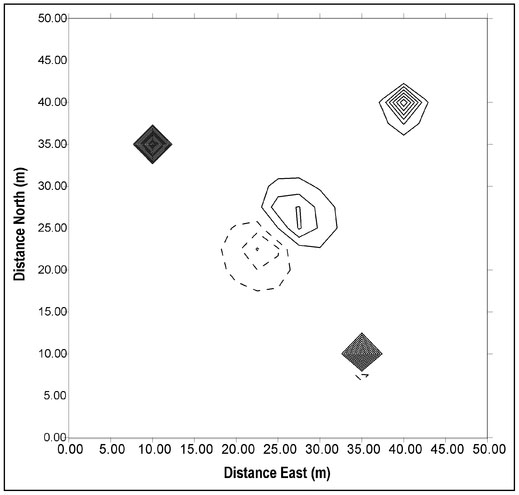
Figure 4.31. Contour plot of the component of the synthetic anomalous magnetic data along the direction of the Earth's magnetic field for the five magnetic features defined in Table 4.4 using a 2.5 m spatial sampling.
Based on the above discussion, a spatial sampling comparable to the half-maximum distance for the shallowest target is desirable. While this might seem overly restrictive, this is not necessarily the case. Consider the shallowest target in Fig. 4.24. The distance from the measurement plane to the target is 0.5 m with an associated half-maximum value of 0.36 m. In reality, magnetic measurements are not made on the ground surface, but rather, some distance above. Letting h be the magnetic sensor height above the ground and d be the depth of the target, then the vertical distance from the measurement plane to the target is z = d + h. A reasonable value of h is about 1 m and, for a target that is 0.5 m deep, z = 1.5 and the half-maximum distance is 1.1 m. This is not an unreasonable spatial sampling for a high resolution magnetic survey. Because of the data logging capabilities of modern magnetometers and gradiometers (Sect. 4.9), magnetic surveys with such fine spatial sampling can be accomplished in reasonably short times.
Magnetic gradiometers (Sect. 4.9) consist of two magnetometers having a fixed spatial relationship to each other and typically separated by a small distance. The purpose of a gradiometer is to remove the contributions from external fields (Sects. 4.8 and 4.10.3), where external fields can be those produced by the Earth or extra-terrestrial magnetic sources as well as nearby magnetic objects on, above, or below the ground surface. Gradiometers exploit the fact that the magnetic field from relatively distant sources changes slowly with measurement location. Because of the slow change, when two measurements made at a relatively close spacing are subtracted, the remainder will be quite small. In this manner, the contributions from distant magnetic sources are greatly suppressed. This concept is illustrated in Fig. 4.32 where two magnetometers are separated by a small vertical distance. A magnet is located on the ground surface distances R1 and R2 away from the two magnetometers. A buried magnet, the feature of interest, is shown buried directly beneath the two magnetometers with its distance from them being r1 and r2. If the extraneous magnet is a horizontal distance of 20 m away from the magnetometers and these two magnetometers are 1 m and 1.5 m above the ground surface, R1 = 20.025 m and R2 = 20.056 m. There is only a 0.15% difference between these two distances and, taking the magnetic field to decrease as the cube of the distances, the difference in the magnetic field at these two measurement locations is 0.5%. By subtracting the two measurements, only 0.5% of the external field remains. If the buried magnet is 1 m deep, r1 = 2 m and r2 = 2.5 m. The difference in the magnetic field caused by this magnet at the two measurement positions is 49% so that a significant contribution from this source remains after the subtraction. Gradiometers do not eliminate all unwanted magnetic fields but preferentially minimize the contributions from those produced by more distant sources.
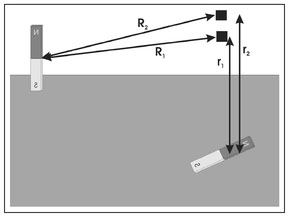
Figure 4.32. Illustration of the magnetic gradiometer concept where measurements made at two magnetometer locations (black squares) are subtracted to preferentially minimize the contributions from distant magnetic sources.
Vertical gradiometers have their two magnetometers vertically aligned (Fig. 4.32). To illustrate a complication of gradient measurements, such measurements have been synthesized for the magnetic sources identified in Table 4.4 for two vertical separations between the magnetometers (Fig. 4.33). In one case, data synthesized for a measurement distance 0.5 m above the measurement surface assumed for the magnetic data shown in Fig. 4.24 is subtracted from the original data (Fig. 4.33a). This yields a synthetic data set for a vertical magnetometer separation of 0.5 m. A similar simulation is also provided for a vertical separation of 1 m (Fig. 4.33b). Comparing the magnetic data (Fig. 4.24) to the 0.5 m separation gradient data (Fig. 4.33a), it is obvious that differences exist and the most profound of these are associated with the deeper magnets (Magnets 3 and 5, Table 4.4). Most significant is that Magnet 3, the deepest, is completely absent in the gradient data. The reason for this is that a gradient measurement suppresses the contributions from more distant targets and this, by definition, includes deeper targets. Part of this lost information can be recovered by increasing the magnetometer spacing (Fig. 4.33b). Although the manifestation of Magnet 3 is weak, it does appear. Ideally, the spacing between magnetometers within a gradiometer should be based on the deepest target to be resolved. This spacing should increase with increasing feature depth, although larger separation can be awkward to implement.
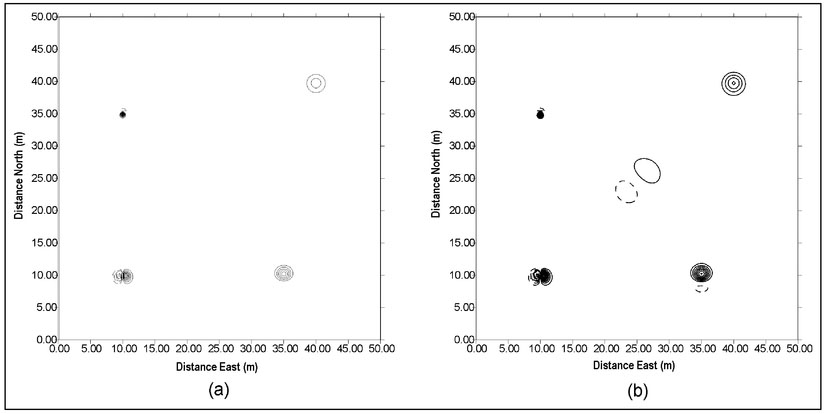
Figure 4.33. Synthetic vertical gradiometer data for the magnetic targets specified in Table 4.4 for separations of (a) 0.5 m and (b) 1 m.
The loss of information inherent in gradient measurements is not insurmountable. Most gradiometers actually record and store data from each individual magnetometer. This information is available, along with the gradient data, for interpretation. It should be stressed that interpreting gradient data without consideration of data from a single magnetometer admits the possibility that buried features of interest will be overlooked.
In practice, gradiometers can have any desired orientation, such as the vertical configuration considered above. A horizontal gradiometer has both magnetometers at the same distance above the ground but separated by some fixed horizontal distance. This type of gradiometer is considered here to demonstrate additional complications that can arise when non-vertical alignments are used. Assume that a magnet is buried with the horizontal component of its dipole moment aligned in a north-south direction and consider a horizontal gradiometer with its two magnetometers are separated by some distance in the north-south direction. If measurements are made with this gradiometer directly over the top of the above-described magnet, this instrument will be measuring the slope of the measured magnetic field. Figure 4.34 (next page) shows a graph of the vertical component of the magnetic field along this measurement line with line segments added at several positions along this measurement to characterize the slopes at these points. When the measurement is far removed in either direction from the magnet, the magnetic field is essentially constant so that the slope is zero. As the measurement point approaches the north (negative) pole, the slope becomes negative. With further movement along the measurement line, the slope sequentially changes to zero, positive, zero, negative and zero. In this case, the horizontal gradient data will produce a magnetic feature with three, rather than two, poles. This is entirely an effect of the measurement configuration and has nothing to do with the character of the magnetic source.
This effect is illustrated in Fig. 4.35a (next page) which shows the magnetic measurement (solid line) and the horizontal gradiometer measurement (dashed line). Here, two symmetric poles become a strong central south (positive) pole with a weaker north pole on either side. For comparison, Fig. 4.35b presents similar plots for the magnetometer data and the vertical gradiometer data. In this case, both sets of measurements offer a similar symmetric two-pole structure with the gradiometer response being somewhat weaker.
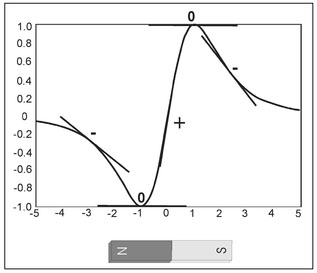
Figure 4.34. Illustration showing how a horizontal gradiometer measures slope changes to yield a tri-polar response from a dipole source.
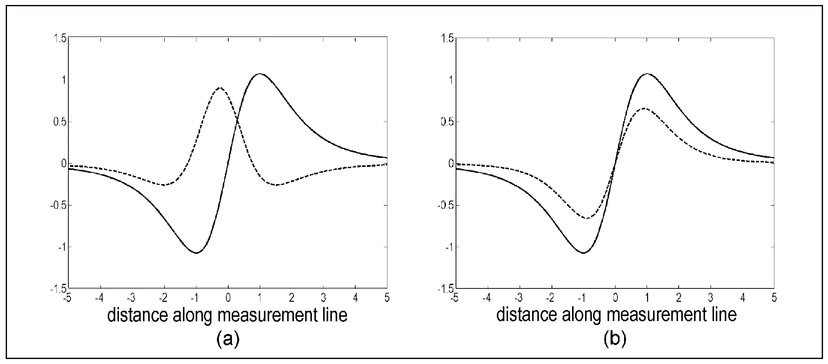
Figure 4.35. Graphs of magnetometer data (solid line) and gradiometer data (dashed line) for (a) a horizontal gradiometer and (b) a vertical gradiometer.
When horizontal gradiometer measurements are made in two-dimensions, the change in manifested response can be even more pronounced. Figure 4.36 displays a contour plot of synthetic horizontal gradiometer data for the magnetic targets itemized in Table 4.4. Here, the magnetometer orientation is north-south and the two magnetometers have a one meter spacing. Magnet 1 (Table 4.4) has its dipole moment aligned east-west and this orientation is mimicked in the magnetometer data (Fig. 4.24). For its horizontal gradiometer counterpart, this magnet appears as four poles, two north poles oriented southwest to northeast and two south poles oriented southeast to northwest. Magnet 2 appears in the magnetometer data with a strong south pole occurring north of the weak north pole. In the gradiometer data, this magnet is represented by a dipole with near-symmetric pole strengths and with the north pole north of the south pole. Magnet 3 is the deepest of the targets and, because gradiometers preferentially suppress deeper features, its response is quite weak. Magnet 4 shows a characteristic dipole response for a north-south oriented dipole moment in the magnetometer data. However, in the horizontal gradiometer data, it presents three poles that are aligned north-south with a central north pole between two south poles. When a dipole moment is aligned vertically, it appears as a monopole in magnetometer measurements made over a horizontal plane. This is the case for Magnet 5. This magnet, in the gradient data, has the appearance of a north-south oriented dipole.
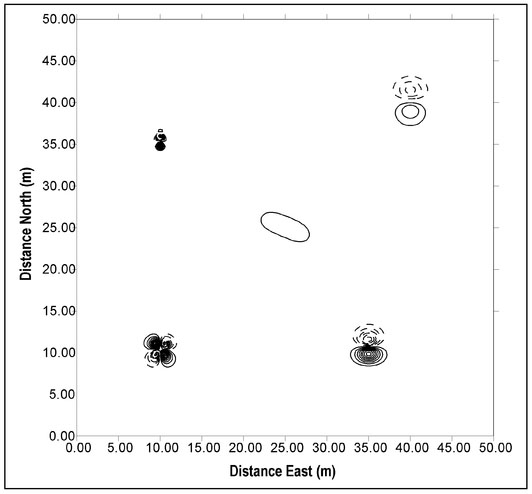
Figure 4.36. Synthetic horizontal gradiometer data for the magnetic targets specified in Table 4.4 for a separation of 1 m.
A final drawback to the use of gradiometer measurements is that such a measured quantity does not vary with the inverse cube of the distance so that the depth estimation formula (Equation 4.6) is even more inaccurate. Since magnetic measurements are usually available from gradiometers, it is best to use this information for depth estimation.
Another method to minimize the effects of external magnetic fields is by the use of a base station. In this approach, two magnetometers are used where one is moved within the survey region in the usual manner while the other remains fixed at some location outside of the survey area. If the two magnetometers synchronously record the magnetic field, the two data sets can be subtracted as is done with gradiometers. The advantage to the use of a base station is that it is not a gradient measurement so it does not change the character of the measured magnet response—dipoles remain dipoles, etc.—nor does it mute the response of buried magnetic Sources within the survey region. Base stations are best suited for removing external fields that are caused by strong distant magnetic sources, such as those of the Earth or the sun. Abase station will only remove contributions to the magnetic field that do not change substantially within the survey area.
The concept of integrated case studies was introduced in Sect. 2.13. The intent of these case studies is to illustrate how the use of multiple geophysical techniques can greatly improve interpretation. For this purpose, three adjacent sites were described (Fig. 2.54) where the subsurface features of interest are a complex of utility tunnels on a university campus.
In this section, magnetic measurements are introduced and these are interpreted in conjunction with the previously considered gravity measurements. Magnetic data considered here was acquired with an alkali vapor magnetometer (Sect. 4.9) by walking straight, parallel north-south lines in alternating directions. For all three areas (Fig. 2.54), a line spacing of about 61 cm was used and the magnetometer was programmed to acquire data at a rate of five samples per second. The walking speeds of this study provided a measurement spacing along each line of about 30 cm (Sect. 4.10.1). The gray-shaded regions shown in Fig. 2.54 were surveyed with the magnetometer in this manner. This provided a near-uniform measurement grid with grid cells having approximate dimensions of 61 cm in the east-west direction and 30 cm in the north-south direction. Taking the larger dimension of each cell (61 cm) to be the halfmaximum value (Sect. 4.12.1), the vertical distance from the measurement surface to the buried target would be about 80 cm (Equation 4.6). For these surveys, the magnetometer was carried approximately 1 m above the ground surface yielding a depth estimation of 20 cm above the ground surface. This would suggest that all buried magnetic features can be well resolved for these measurement spacings (Sect. 4.12.2).
The magnetic data presented here has had the background field, presumably associated with the Earth's magnetic field, approximately removed by subtracting the average value of all data over each area.
The magnetic data for Area 1 is displayed as a gray-scale plot with superimposed contour lines in Fig. 4.37 and as contour lines superimposed over the area map (Fig. 2.54) in Fig. 4.38. For all geophysical techniques considered here, shallowly buried objects will appear as changes in the acquired data with measurement location. Inspection of the magnetic data (Fig. 4.37) shows a relatively uniform background with a strong area of magnetic activity confined to an east-west running strip through the center. In this strip there appear to be several isolated well-defined dipoles as well as broader features that could represent the coalescing of multiple dipoles. These all could be associated with utilities within the tunnel, for example, segments of steel or iron pipe, or hardware used to suspend the utilities within the tunnel.
There is an alternative interpretation of this data. As evident in Fig. 4.38, a region of an anomalous magnetic field is directly over the sidewalk. Frequently, steel rods are used to reinforce concrete. These reinforcing rods can manifest a magnetic response and the data given in Figs. 4.37 and 4.38 could be associated with steel rods and not the tunnel.
The gravity measurements (Figs. 2.56 and 2.57) can be considered to reduce the ambiguity of the interpretation of the magnetic data. Figure 2.56 clearly shows a relative low in gravitational acceleration indicative of a void which is clearly under the sidewalk (Fig. 2.57). Given that this void exists and that there is a magnetic change in this same area lends support to the conclusion that the magnetic activity is associated with the utility tunnel. It should also be recognized that the information gleaned from the gravity measurements does not eliminate the possibility that the measured magnetic response is associated with steel rods in the concrete sidewalk.
It would appear that gravity information is more definitive than the magnetic data since it unambiguously identifies an area of very low density below the sidewalk. This information, however, is derived from a single line. From this single line, it is possible that, while a void exists, it can be a spatially isolated feature such as a vault or a manhole. Furthermore, if this void is a tunnel, the single line of gravity data does little to characterize its orientation. Gravity measurements acquired over many lines could be used to more completely quantify the existence and orientation of the tunnel. Since gravimeters must be leveled at each measurement station (Sect. 2.8), this would be an extremely time consuming process. Although less definitive, a single gravity line can be used to locate the utility tunnel at one point and infer its extent and orientation using more time-efficient magnetic measurements.
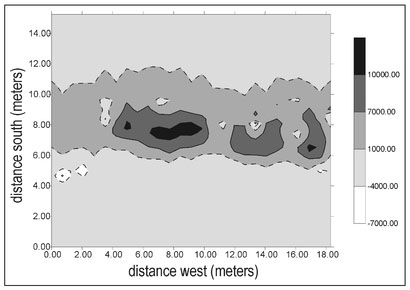
Figure 4.37. Gray-scale plot, with superimposed contour lines, of the magnetic data acquired over Area 1.
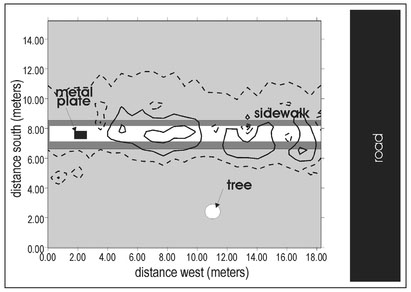
Figure 4.38. Contour plot of the magnetic data acquired over Area 1 superimposed over the base map.
Figures 4.39 and 4.40 display the magnetic data from Area 2 as a gray-scale plot and a contour plot superimposed over the base map, respectively. Both the magnetic data and the gravity data (Fig. 2.59) are more complex than for Area 1. The magnetic data (Fig. 4.39) show a region of magnetic change extending east-west; however, this change is not nearly as robust as for Area 1. Again, this strip is spatially associated with a sidewalk (Fig. 4.40) and the saw-tooth pattern in the data is a consequence of a variable walking speed over most of the data acquisition lines (Sect. 4.10.1). There is also a broad magnetic low extending north-south southward from the east-west running sidewalk.
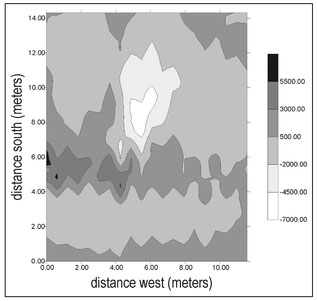
Figure 4.39. Gray-scale plot, with superimposed contour lines, of the magnetic data acquired over Area 2.
Perhaps the most important information that can be extracted from the magnetic data is that there are two diagonal sidewalks in Area 2 and neither appears in the magnetic data (Fig. 4.40). This lends considerable support to the interpretations for both Area 1 and Area 2 that magnetic anomalies are associated with utility tunnels and not related to the sidewalks. In light of this, one plausible interpretation of the magnetic data from Area 2 is that an east-west tunnel (a continuation of the tunnel in Area 1) exists under one sidewalk and a second tunnel extends southward towards the building. This tunnel passes under one of the diagonal sidewalks (Fig. 4.40).
The gravity data for Line 1 (Fig. 2.59a) exhibits a general decreasing trend with distance along this measurement line. This trend is associated with the building (Sect. 2.11) just south of the survey area (Fig. 4.40). There is a relative low in gravitational acceleration at about 5 m on this line and this position correlates with the interpreted east-west tunnel from the magnetic data. Because this gravity data is dominated by the presence of the building, the gravitational manifestation of this tunnel is not nearly as obvious as the tunnel in Area 1. A second relative low in measured gravitational acceleration occurs a distance of 9 m along gravity Line 1. This feature is caused by some unidentified source so that, in the absence of the magnetic data, this low could be interpreted to be a second tunnel. Data from gravity Line 2 (Fig. 2.59b) exhibits a very weak relative low at the interpreted location of the north-south tunnel from the magnetic data. This tunnel would likely be overlooked if the gravity data were considered alone.
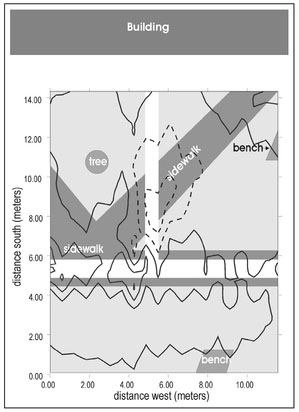
Figure 4.40. Contour plot of the magnetic data acquired over Area 2 superimposed over the base map.
Figures 4.41 and 4.42 present the magnetic data acquired over Area 3 in the same formats as those presented for Areas 1 and 2. The saw-tooth pattern evident in this data is again attributable to a variable walking speed (Sect. 4.10.1). These data clearly display two perpendicular strips of magnetic change (Fig. 4.41) and both of these occur above sidewalks (Fig. 4.42). There is a diagonal sidewalk in the northeast corner of this area for which there is no magnetic response. This, given the findings from Area 2, suggests that the magnetic features in the Area 3 data are a result of the presence of two tunnels, an eastwest tunnel that is a continuation of the tunnels in Areas 1 and 2 and the second tunnel extending northward from this tunnel.
A single gravity line was used in Area 3 (Fig. 2.61) extending diagonally across both tunnels. The east-west tunnel is quite evident in this data (Fig. 2.62). However, the north-south tunnel is not so obvious, producing a response comparable in magnitude to that of the nearby lamp post, and less prominent than that from the tree. The south tunnel easily could be missed in the absence of the magnetic data.
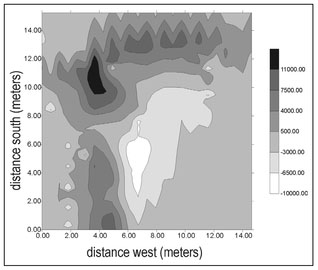
Figure 4.41. Gray-scale plot, with superimposed contour lines, of the magnetic data acquired over Area 3.
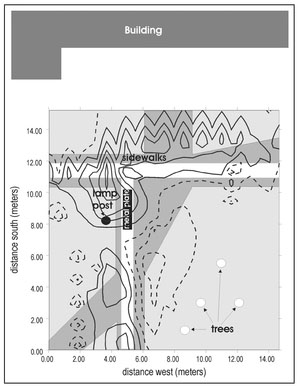
Figure 4.42. Contour plot of the magnetic data acquired over Area 3 superimposed over the base map.
1. Robert H. Burger, Exploration Geophysics of the Shallow Subsurface. Prentice Hall: Englewood Cliffs, 1992; D.S. Parasnis, Principles of Applied Geophysics. London: Chapman & Hall, 1986.
2. A.J. Witten, R. Brooks, and T. Fenner, 'The Tulsa Race Riot of 1921: a geophysical study to locate a mass grave', The Leading Edge (2001): 655-60.