1
Innovation
The Source of Rapid Growth
Raicho Bojilov
ABSTRACT This chapter establishes productivity growth and, in turn, innovation as major, if not the most important, sources of growth in gross domestic product (GDP) per capita in the long run. We review the historical development of the main concepts in the study of economic growth and highlight the central role of innovation, along with the difficulties in the measurement of productivity growth on an aggregate level. It turns out that standard economic analysis is ill suited to the study of innovation. We review how our work relates to the only recently emerging literatures on institutions and on economic culture. The chapter concludes with a review of our data sources and a descriptive analysis that leads to a list of stylized facts that motivates the rest of our work.
Introduction
Economists have consistently found that more than 50 percent of economic growth in developed economies cannot be accounted for by accumulation of production inputs, such as labor and capital. Similarly, they have found that between 40 and 60 percent of growth in output per worker across industries in developed economies, the US in particular, has been driven by growth in total factor productivity (TFP), which is defined as the portion of output not explained by the amount of inputs used in production. Thus, much of the observed economic growth cannot be traced back to easily measured and understood forces. Yet persistent differences in TFP are crucial to explaining the observed persistent differences in economic performance.
In this chapter, we provide a brief review of basic growth accounting and then relate our work to the existing literature. In this way, we hope to highlight the main issues that are at stake in our research investigation, in particular the advantages and disadvantages of using aggregate TFP data. Then, we present the data that we use in our cross-country comparison of productivity and innovation. We conclude with a set of stylized facts that motivate the rest of our analysis.
In more detail, a sizeable proportion of the growth in GDP per capita across countries can be accounted for by TFP growth and, therefore, innovation. We find evidence for a decline in productivity across the developed economies after the early 1970s. This trend was only partially mitigated by the IT revolution. Thus, the innovations in the IT industry appear to have failed to lift the aggregate innovation and, in turn, TFP growth even in the US. Also, much of the TFP growth in the first decades after WWII is due to catching up with the best practices in the world, and countries differ significantly in their ability to catch up. Finally, with the help of long TFP series, we show that early on, the UK was the global TFP leader, but the US managed to catch up and overtake the UK by the early 1930s. Since no country can become a leader only by following, any theoretical or empirical exercise on the data needs to allow for the existence of multiple centers of innovation in the world.
1. The Black Box
In 1927, Paul Douglas and Charles Cobb proposed a functional form that captures the salient features of the observed relation between capital, labor, and aggregate output measured as GDP in the US.1 The two Americans have observed that, over the years, the shares of total output that went to labor and capital remained virtually the same, and they developed a mathematical expression that captured that defining feature of the American macroeconomic life. Their formulation was analytically very useful and yet remarkably simple:

where Yt stands for output in year t, At for overall technological level in year t, Kt for capital in year t, and L for labor in year t. The power represents the share of total output that goes to capital, and the compliment 1 represents the share of total output in the economy that goes to labor as compensation. The overall technological level At is known in economic jargon as TFP or multifactor productivity. Of all the ingredients in the formula, TFP is the most mysterious and most intangible one: as the residual in a growth regression, it stands for little more than the ignorance of economists. Nevertheless, there is a general agreement that innovations contribute to the increase in At: despite a number of subsequent variations, this formulation has remained a benchmark in the analysis of economic growth not only in the US but across the world.
This benchmark formulation can help us perform a useful exercise in growth accounting. We take the natural logarithm of the formula and obtain:

Taking differences over time, we obtain that, approximately, the growth in output from year to year t is captured by the following expression:

where ![]() is the growth in total output,
is the growth in total output, ![]() the growth in the overall technological level,
the growth in the overall technological level, ![]() the growth in capital, and
the growth in capital, and ![]() the growth in labor. With the help of national statistics, economists usually have no problem obtaining reasonably accurate measures of output, capital, and workers over time. The one thing that remains unobservable, however, is TFP, At. Nevertheless, assuming that they have postulated the correct functional relation between all the ingredients, economists may be able to obtain an estimate of At as the residual from a regression of output Yt on Kt and Lt: through a similar procedure, we can obtain
the growth in labor. With the help of national statistics, economists usually have no problem obtaining reasonably accurate measures of output, capital, and workers over time. The one thing that remains unobservable, however, is TFP, At. Nevertheless, assuming that they have postulated the correct functional relation between all the ingredients, economists may be able to obtain an estimate of At as the residual from a regression of output Yt on Kt and Lt: through a similar procedure, we can obtain ![]() as the residual from a growth regression.
as the residual from a growth regression.
The estimated measures of TFP and TFP growth have many limitations. One of them is that these estimated measures do not have natural or meaningful units. Another, more serious limitation is that as residuals from a regression, they capture everything that economists simply cannot measure and explain. Thus, TFP is a black box whose ingredients and inner workings by construction remain hard, if not impossible, to study. Perhaps, to show that the students of the dismal science do have a sense of humor after all, many economists refer to TFP as the Solow residual.
As a consequence, economists have a hard time measuring in the aggregate the level and growth of innovation in an economy. They only know that innovation is one of the ingredients in TFP and that the estimated TFP is an upper bound for the level of innovation. Worse still, the growth literature starting with Barro and Sala-i-Martin (1992) has consistently documented that, for both developed and developing economies, changes in labor and capital in standard growth regressions cannot explain between 40 and 60 percent of observed output growth.2 In other words, 40 to 60 percent (and sometimes even more) of output growth falls under the category of the Solow residual, or more euphemistically TFP. It turns out that the ignorance of economists is consistently high.
This brief discussion shows that there are challenges to our study of innovation and its dynamics that are rooted deep in standard economic theory. Until recently, economists entertained a rather mechanistic view of the macroeconomy: the elements of economic activity—the growth of TFP, the volume of business investment, employment level, and job satisfaction—are all regarded as determined from initial conditions known as the “state of the economy.” Standard models are built to elucidate the mechanics of this determination. On the microeconomic side, the individual is not seen as having a positive role to play either. The standard models of a market economy view the individual participant in the economy as essentially robotic—as if programmed to calculate correct reactions to data, such as prices. Given such a framework, standard economic theory is unable to say anything interesting about innovation, a rather central element of economic life, except for an upper bound on its magnitude. Recent poor economic performance in both Europe and the US has, however, enticed many economists to look beyond the standard tool kit acquired at university. We hope to contribute to this line of research.
We take as given the estimated TFP series for a set of developed economies and study the transmission of TFP shocks across countries and over time. Then we investigate how differences in the defining features of the dynamics of TFP shocks, presumably proxies for innovation shocks, relate to differences in beliefs and attitudes about economic life across countries. Before we delve into our analysis of these issues, we first review the related work, present the data that we use in our empirical work, and summarize the stylized facts that emerge from a simple descriptive analysis of these data.
2. Related Work
Apart from the broad understanding that TFP is related to innovation, economists have only a few insights to offer on its sources and the laws that govern its dynamics. Nelson and Phelps (1966), followed more recently by Aghion and Howitt (1992) and Aghion, Howitt, and Murtin (2011), have made some advances in the understanding of the statistical structure of TFP growth.3 Intuitively, they define a frontier of best production practices and stipulate that productivity growth in a country, measured by TFP growth, is increasing in the distance between the country’s own technological level and the best practices in the world. Other related research includes Amador and Coimbra (2007), Barro (1991), Baumol (1986), Lucas (1988), Romer (1986, 1990), and Sala-i-Martin (1997).4 Our work follows in the same research tradition, but it departs from the existing literature in several important respects.
We consider a generalized Aghion-Nelson-Phelps framework, which allows us to decompose TFP growth in each country into two components. The first one is the familiar imported innovation, associated with catching up to the best practices in the world. The second component is indigenous innovation, which originates in the country itself and pushes both the best-practice frontier of the country and the world as a whole. Our specification allows us to investigate several issues, from which previous research has abstracted away. First and foremost, we allow each country to generate innovation, which pushes the worldwide technological frontier. Second, we allow innovation to spread across countries at different speeds, depending on the strength of the transmission mechanism between two countries. Consequently, the speed at which an innovation is adopted across the world may depend on the country from which the innovation originates. Third, these generalizations allow us to map out how innovation shocks propagate across the world.
The limitations of aggregate TFP data have stimulated many researchers to use micro-level data to study innovation. Acemoglu, Akcigit, and Kerr (2016) use patent data of 1975–2010 to measure the network of citations across fields, and they find that the growth in the number of patents in a field leads to future innovation in linked fields.5 Akcigit, Grisby, and Nicholas (2017) show that based on patent data between 1880 and 1940, more geographically connected states are more inventive.6 Furthermore, based on citation data, Mohnen and Belderbos (2013) describe matrices of intersectoral and international spillover weights in order to study and evaluate the Europe-wide impact of R&D policies.7 Moser, Voena, and Waldinger (2014) show that fields with more immigrants experienced faster growth, based on historical citation data of 1880–1940 and 1920–1970.8
The recent studies using microlevel data make very important contributions, but the measures used, in particular patents, have their own problems and only provide partial understanding of innovation. For example, the innovations and productivity growth due to the use of patented products after purchase are not measured by patents. Also, industrial secrets are innovations that are not patented. Often, particularly in the past, innovations, such as the internet, were not patented, but they did have a huge positive impact on productivity. In other cases, patents were used to preclude the entry of potential competitors, which is the case with the US patent on airplanes given to the Wright brothers: as a result, the US had to purchase and use French and British airplanes during WWI despite being the country where the modern airplane was first developed. In fact, it was France and then the UK that pioneered commercial rights, rather than the US, precisely because of long judicial battles related to patent rights. Turnover of firms and products also has similar advantages and disadvantages.
We are not dismissing any prior research based on concrete measures of innovation or downgrading its usefulness. In our work, we just follow an alternative route that starts with representative aggregate measures and analyzes their statistical properties across countries and over time. In fact, we regard work on concrete measures of innovation as complementary to our approach rather than as a substitute. Our choice of methodology, factor analysis or spatial econometrics, is predetermined by our choice to investigate the dynamics of TFP measures. There is no universal measure of innovation, and all existing candidates have their pros and cons, depending on the investigated context. We advance a research agenda that aims at exploring the dynamics and spatial dependence of TFP, one of the existing measures, across countries and time to investigate how the dynamics of innovation has changed on a national level.
Our research project is also related to the endogenous growth literature and some recent advances in the study of innovation and automation. The task-based model of Zeira (1998) provides an early simple but elegant way to model automation.9 The specification model that we consider borrows heavily from Zeira’s framework. One important rationale for doing so is that the observed patterns by Kaldor (1961) of stable growth rates and capital shares do not appear to hold any longer in recent decades.10 Recent important contributions to this expanding literature include Peretto and Seater (2013), Hémous and Olsen (2016), and Aghion, Jones, and Jones (2017).11 The last two consider a constant elasticity of substitution rather than the Cobb-Douglas technology used by Zeira (1998).12 In addition to discussing the different ways automation can be introduced in endogenous growth models and the related characterization of the steady states of the economy, these papers also consider the implications of their framework for income inequality between high-skilled and low-skilled workers. Our theoretical and empirical work reexamines the issues highlighted by Baumol (1967), who observed that rapid productivity growth in some sectors relative to others could result in a “cost disease” in which the slow-growing sectors become increasingly important in the economy.13
One popular alternative general equilibrium framework posits that the economic institutions in the capital, labor, and product markets have significant effects on the functioning and the performance of the economy. The most important and influential contributions to this literature are Acemoglu, Johnson, and Robinson (2001) and the related subsequent works, including Acemoglu and Robinson (2012).14 Earlier, Kydland and Prescott (1990) provide a set of stylized facts suggesting a negative relation between taxation on employment and participation.15 Hoon and Phelps (1997) show that in a closed economy, a shift to increased payroll taxation raises the natural rate of unemployment under some specifications.16 Yet Hoon and Phelps point out that in a small open economy, in which the interest rate is given by the world rate, the tax shift is neutral for employment. This framework draws strength from plentiful evidence that the economies that have suffered low economic performance since the early 1990s (until 2008 at any rate) happened to be those that had adopted institutions understood to be “bad,” such as excessive regulation of labor markets, red tape, controls on capital and trade rows, and so on. For example, Prescott (2004) compares the tax system and government transfers in the US and the EU and relates these differences to the differences in their economic performance.17 Aghion and Howitt (1998, 2006) provide a more detailed overview of the related literature.18
Our approach is related to this strand in the literature and yet differs in two key aspects. First, we attempt to relate the characteristics of an economy to individual attitudes and beliefs. Second, we focus on the conditions for innovation and the proclivity to innovate rather than on protection of property rights, excessive regulation, and the like. The difference may appear subtle at first sight, but it is quite substantial, as will be seen later. The theory of dynamism employed here and introduced in Phelps (2013) builds on the insights of David Hume, Henri Bergson, Friedrich Hayek, and Michael Polanyi.19 Every individual, Hayek says, has some knowledge called “know-how,” which is practical, concrete.20 It is often inexplicable in formal scientific terms—that is, “personal knowledge.” Such knowledge develops on the borderline of the known and the unknown. Bergson (1911) argues that this knowledge is the driving force behind any action, the force of life itself.21 Thus, in a suitably structured economy, new commercial ideas may emerge as the actors combine their Hayekian know-how with their Humean imagination.
3. Data and Descriptive Analysis
We use data on GDP per capital, TFP, and labor productivity that are generously provided by Bergeaud, Cette, and Lecat (2016), who belong to the research division at Banque de France.22 Briefly, Bergeaud, Cette, and Lecat (2016) have tried to follow as closely as possible the methodology used to construct the Penn World Tables in order to extend the time series of GDP per capita and TFP as much as possible in the past.23 Their paper provides a detailed discussion of the related methodology. GDP per capita, labor productivity, and the TFP index are computed for 13 developed countries: Australia, Canada, Finland, France, Germany, Italy, Japan, the Netherlands, Norway, Spain, Sweden, the United Kingdom, and the United States. The data sources from which the productivity indexes are computed are historical and national accounts series, which allows for international comparisons (for example, Maddison 2003).24 The data are annual and most of them cover the period 1870–2014. The computation of the TFP index relies on three basic series: GDP, labor, and capital. Regarding labor, Bergeaud, Cette, and Lecat (2016) need data on total employment and working time.25 The capital indicator is constructed by the permanent inventory method applied to each of the two corresponding investment data sets (IE and IB). For this, as much as possible, very long-term information on investment is used. As in Cette, Kocoglu, and Mairesse (2009), the depreciation rates used to build the capital series are 10.0 percent for equipment and 2.5 percent for buildings.26
We start with an overview of the main trends in GDP per capita across major developed economies. Figure 1.1 plots the evolution of GDP per capita in the US, the UK, France, Germany, and Japan. It shows that by the beginning of WWI, the US managed to catch up with the UK and the two countries continued to have similar levels of GDP per capita during the interwar period. However, during and after WWII, the growth in US GDP per capita accelerated markedly, which led to a divergence in the paths of the US and the UK. The UK consistently had lower growth rates than the US during the 1960s and the 1970s, and started to converge back to the level of GDP per capita of the US only in the 1990s. Still, the UK achieved only partial convergence. Indeed, the most striking feature of Figure 1.1 is that despite periods of very rapid economic growth, no main economy managed to converge to the US level of GDP per capita during the whole period under investigation. Obviously, the two world wars must be held accountable for some of the differences, but the lack of full convergence even after 60 to 70 years of relative global peace is puzzling.

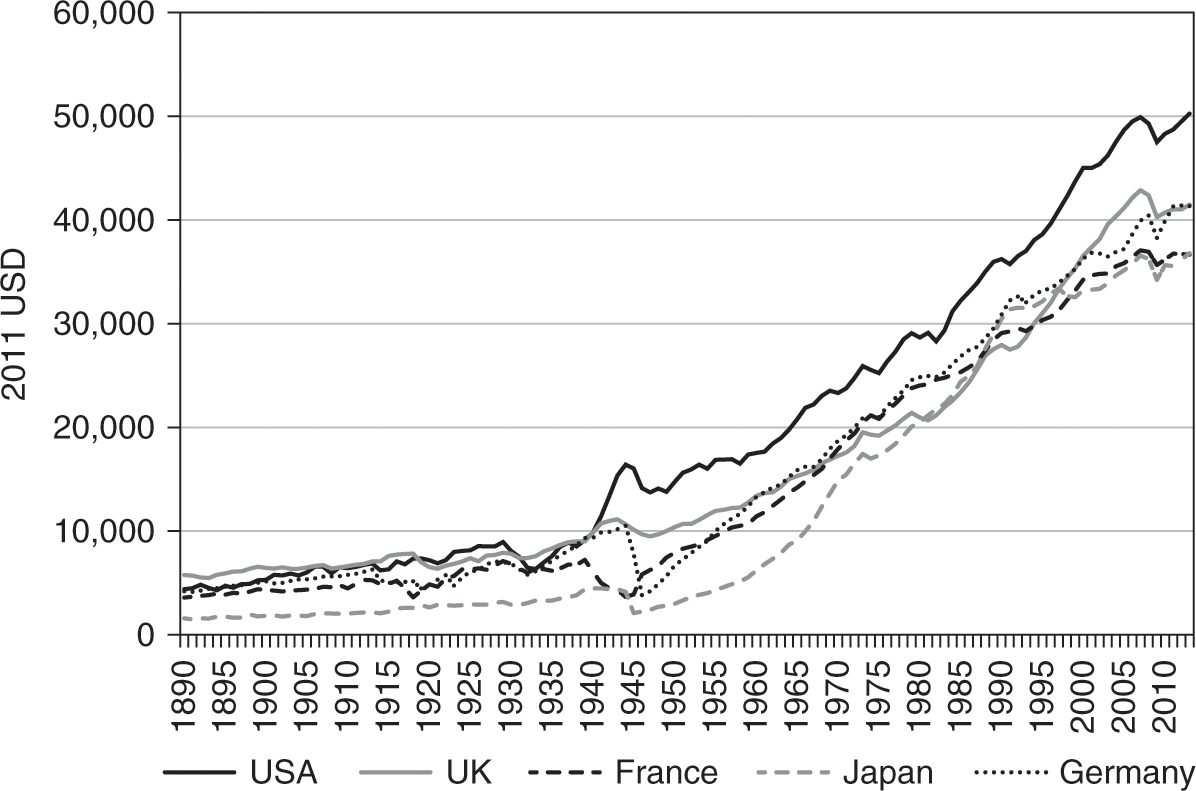
Figure 1.1. Comparison of GDP per capita in France, Germany, Japan, the UK, and the US. Data source: Banque de France.
Next, Figure 1.2 plots the evolution of the corresponding TFP index for the same set of countries. It shows that the US managed to catch up with the UK in terms of TFP only in the 1930s. Moreover, the figure reveals that the main continental European economies converged toward the US in terms of TFP during the whole postwar period, especially during the 1950s and the 1960s. However, the paths of the US and the UK, on one hand, and the paths of France and Germany, on the other, started diverging again after the mid-1990s. Interestingly, Figure 1.2 reveals that most of the spectacular growth in Japanese GDP per capita should be traced back to capital accumulation rather than increase in TFP and, thus, innovation.
Figure 1.3 presents the long-run relation between the cumulative growth of GDP per capita and the cumulative growth of TFP in the US. It reveals that until the mid-1960s the two growth rates shadowed each other closely and were of approximately the same magnitude. After that, GDP per capita grew at a much faster rate than TFP. In fact, we can notice that in the late 1960s and the 1970s, TFP growth actually slowed down. Nevertheless, after the mid-1980s, TFP growth picked up again, but interestingly it recovered only partially compared with its performance in the 1950s and the 1960s. The most surprising takeaway from Figure 1.3 is that the best US decades in terms of TFP growth were the 1930s and the 1940s.

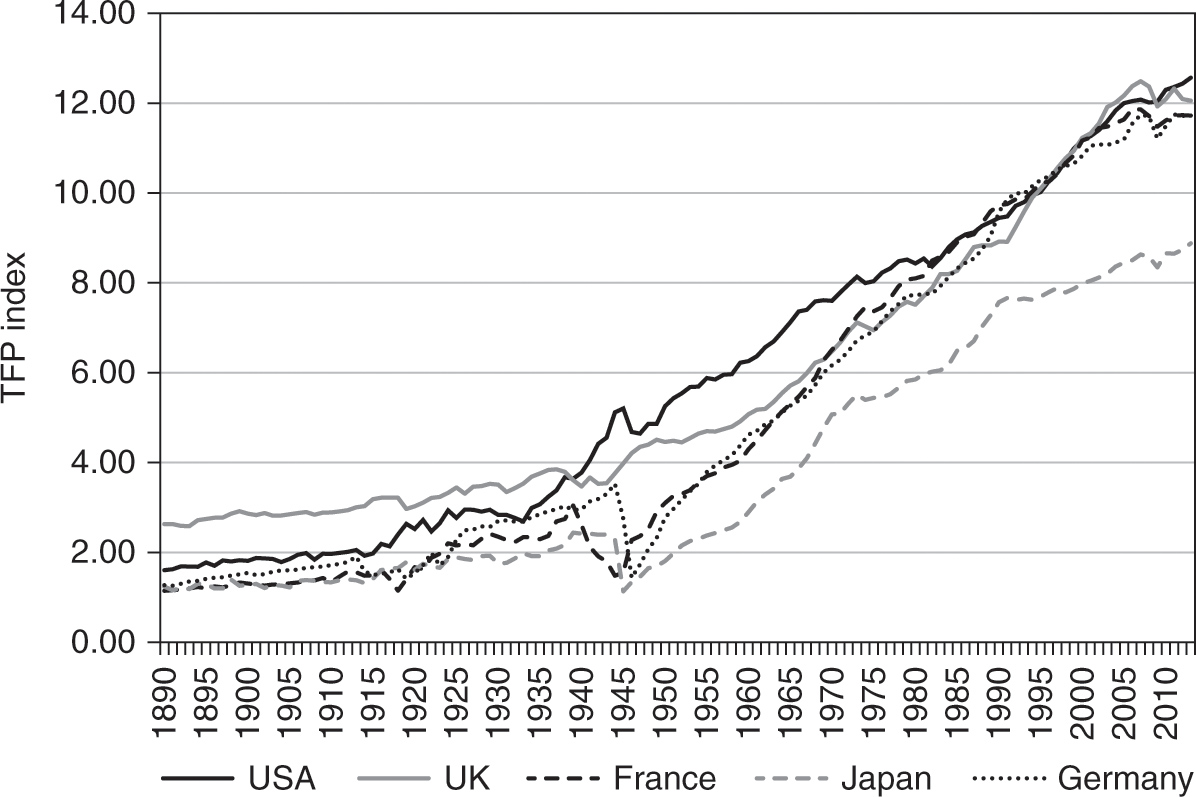
Figure 1.2. Comparison of the levels of the TFP index for France, Germany, Japan, the UK, and the US. Data source: Banque de France.

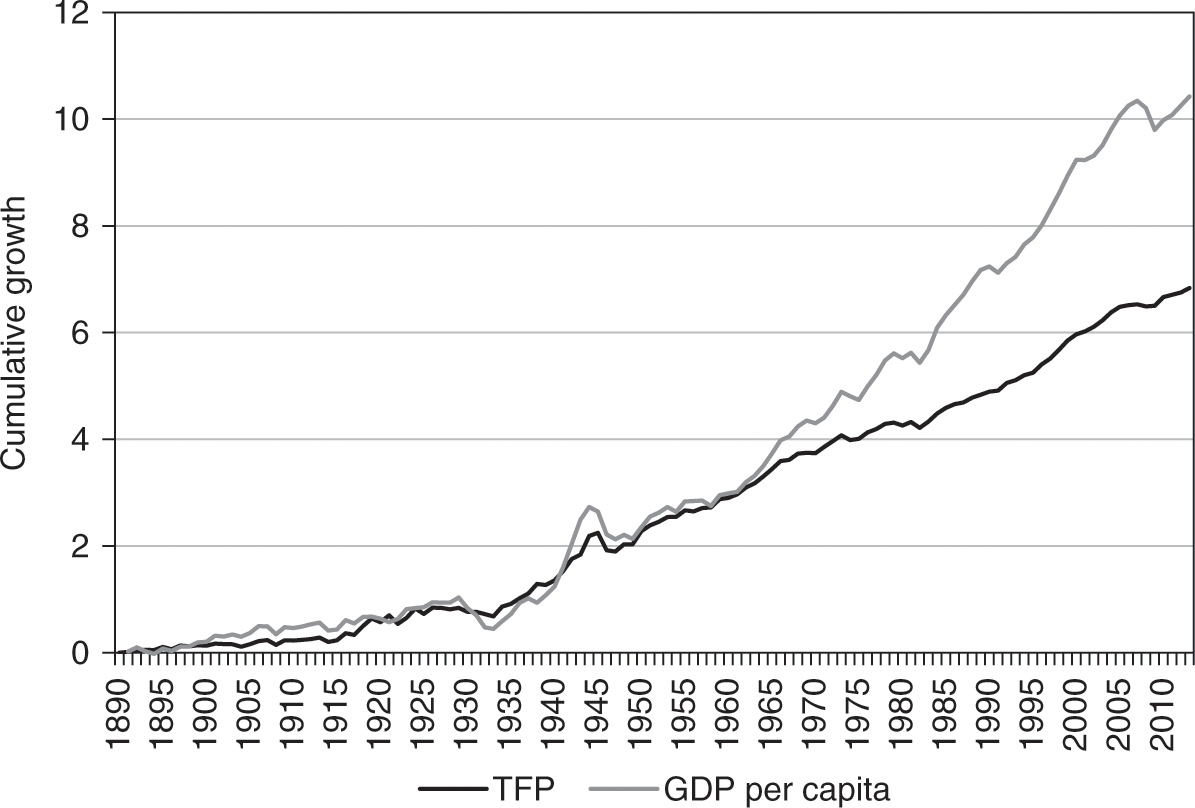
Figure 1.3. Comparison between growth in TFP and growth in GDP per capita for the US. Data source: Banque de France.
The fact that the growth of GDP per capita in the US was higher than the associated TFP growth may be partially accounted for by, for example, the increased contribution of human capital to economic growth. Still, Figure 1.3 captures a key troubling development that we investigate further in the subsequent chapters: TFP growth has slowed down in both absolute and relative terms. Since innovation is incorporated in TFP, the observed dynamics raises the troubling prospect that innovation has actually slowed down since the mid-1960s. Moreover, and somewhat surprisingly, there is no evidence that the IT revolution has caused an unprecedented acceleration in aggregate innovation since the late 1980s. Actually, we record only a moderate recovery to growth rates in TFP that are just below their counterparts for the 1950s and the 1960s and much below the record levels of the late 1930s and 1940s.

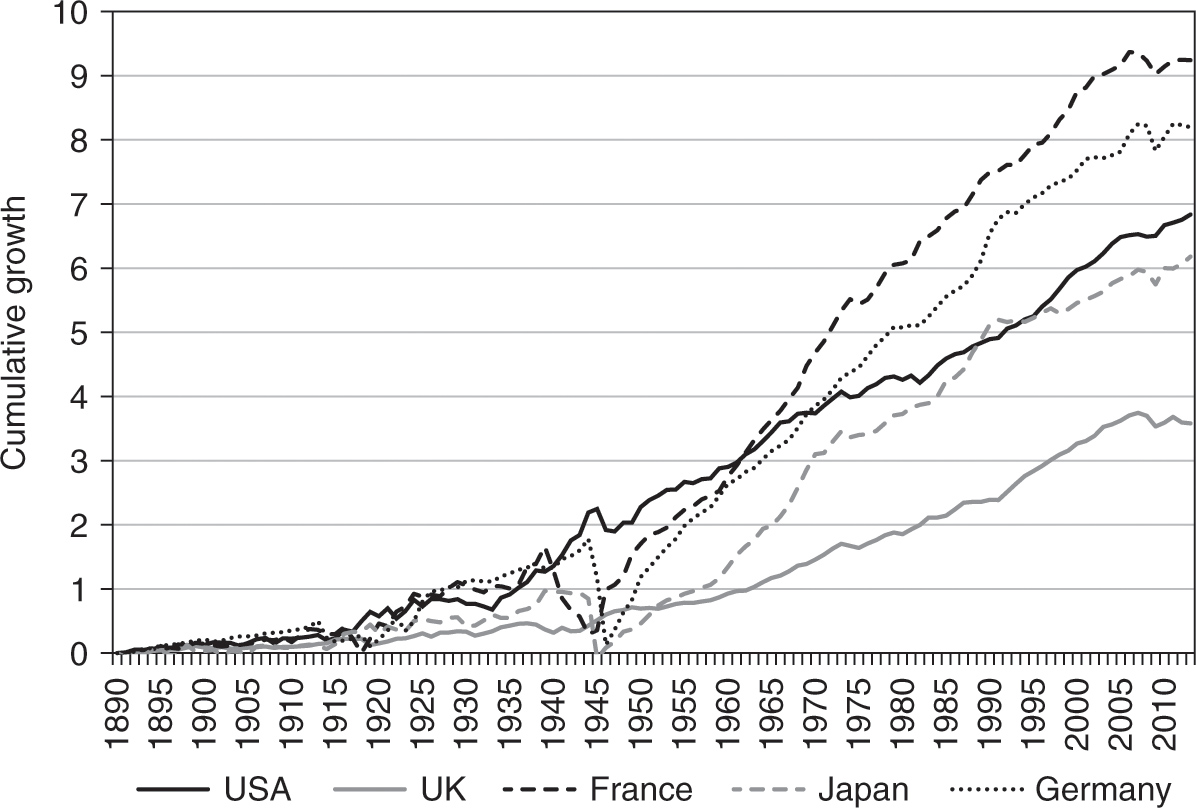
Figure 1.4. Cumulative growth in TFP in France, Germany, Japan, the UK, and the US since 1890. Data source: Banque de France.
Figure 1.4 shows that the slowdown in TFP growth is not a peculiar US phenomenon but rather a global trend in the last 40 to 50 years. It plots the cumulative TFP growth for the US, France, Germany, Japan, and the UK. All five economies experienced an overall slowdown in TFP growth after the early 1970s, with the possible exception of the UK. The UK in fact managed to accelerate its TFP growth for a brief period in the late 1980s and the 1990s to levels that were comparable to the growth rate in the US during the same period. Overall, it seems that the US and the UK fared better than the rest of the lot during the 1990s and the 2000s, as they managed to achieve TFP growth rates that are higher than those of the 1970s and yet a bit lower than those of the 1950s and the 1960s. Most strikingly, TFP growth almost completely vanished in all five economies after 2005–2006. The results for the last 10 years, even preceding the Great Recession, are particularly worrying, since they suggest the drying up of aggregate innovation within each of those developed economies.

|
Table 1.1. Cumulative growth in TFP before WWI, during the interwar years, during the recovery post-WWII, during the post–oil shock decades, and during the IT revolution |
||||||||||||
|
Country |
Before 1914 |
1919–1939 |
1950–1970 |
1970–1990 |
1990–2010 |
1970–2013 |
||||||
|
Canada |
0.313 |
0.228 |
0.388 |
0.137 |
0.160 |
0.164 |
||||||
|
Germany |
0.240 |
1.096 |
1.219 |
0.554 |
0.199 |
0.219 |
||||||
|
France |
0.291 |
1.166 |
1.102 |
0.494 |
0.194 |
0.206 |
||||||
|
Great Britain |
0.150 |
0.216 |
0.452 |
0.378 |
0.355 |
0.352 |
||||||
|
Italy |
0.200 |
0.299 |
1.188 |
0.382 |
0.031 |
0.007 |
||||||
|
Japan |
0.063 |
0.365 |
1.810 |
0.492 |
0.144 |
0.174 |
||||||
|
Sweden |
0.604 |
0.669 |
0.657 |
0.198 |
0.371 |
0.384 |
||||||
|
USA |
0.201 |
0.381 |
0.446 |
0.243 |
0.302 |
0.330 |
||||||
|
Data source: Banque de France. |
||||||||||||
Tables 1.1 and 1.2 cut the same data differently. They report the cumulative growth of TFP and GDP per capita, respectively, for a slightly larger set of countries over five well-defined historical periods: the 20 years just before WWI, the interwar years from 1919 to 1939, the post-WWII recovery covering the years from 1950 to 1970, the period of the oil shocks from 1970 to 1990, and the time of the IT revolution from 1990 to 2010. The fact that each period amounts to 20 years allows us to compare growth rates meaningfully.
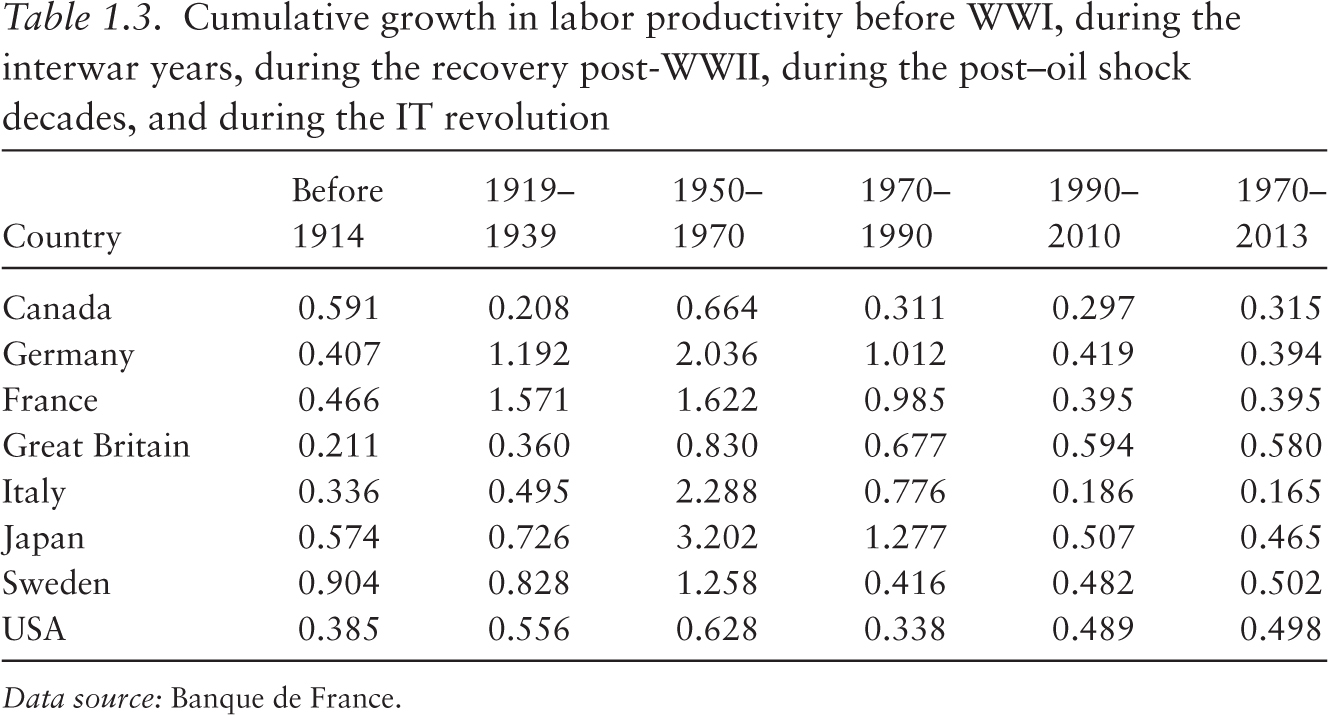
Tables 1.2 and 1.3 show that the US, as well as all other main economies, experienced its highest rates of growth in GDP per capita and labor productivity, correspondingly, during the “glorious” 30 or 40 years after the end of WWII. Table 1.1 confirms that much of the increase in GDP per capita can be traced back to rapid TFP growth. Furthermore, it highlights that after the end of WWII, all countries experienced their highest TFP growth rates during the 1950s and the 1960s. The table also reveals that most continental European countries actually witnessed higher TFP growth during the period 1970–1990 than during the subsequent decades. Interestingly, even the US, the UK, and Sweden recorded total TFP growth in the 1990s and the 2000s that was still substantially lower than the TFP growth for the period of post-WWII recovery. The other interesting aspect of the data is that most countries experienced much higher TFP growth rates during the postwar recovery than the US. Yet it seems that the smaller the gap with the US TFP level, the slower the TFP growth rate became.

|
Table 1.2. Cumulative growth in GDP per capita before WWI, during the interwar years, during the recovery post-WWII, during the post–oil shock decades, and during the IT revolution |
||||||||||||
|
Country |
Before 1914 |
1919–1939 |
1950– 1970 |
1970–1990 |
1990–2010 |
1970–2013 |
||||||
|
Canada |
0.692 |
0.186 |
0.653 |
0.507 |
0.308 |
0.346 |
||||||
|
Germany |
0.260 |
1.090 |
1.792 |
0.650 |
0.292 |
0.339 |
||||||
|
France |
0.362 |
0.705 |
1.268 |
0.623 |
0.244 |
0.259 |
||||||
|
Great Britain |
0.229 |
0.286 |
0.661 |
0.619 |
0.457 |
0.484 |
||||||
|
Italy |
0.284 |
0.411 |
1.958 |
0.745 |
0.152 |
0.096 |
||||||
|
Japan |
0.311 |
0.541 |
3.972 |
1.044 |
0.170 |
0.208 |
||||||
|
Sweden |
0.752 |
0.953 |
0.913 |
0.417 |
0.388 |
0.409 |
||||||
|
USA |
0.415 |
0.239 |
0.581 |
0.554 |
0.333 |
0.387 |
||||||
|
Data source: Banque de France. |
||||||||||||
|
Table 1.3. Cumulative growth in labor productivity before WWI, during the interwar years, during the recovery post-WWII, during the post–oil shock decades, and during the IT revolution |
||||||||||||
|
Country |
Before 1914 |
1919–1939 |
1950–1970 |
1970–1990 |
1990–2010 |
1970–2013 |
||||||
|
Canada |
0.591 |
0.208 |
0.664 |
0.311 |
0.297 |
0.315 |
||||||
|
Germany |
0.407 |
1.192 |
2.036 |
1.012 |
0.419 |
0.394 |
||||||
|
France |
0.466 |
1.571 |
1.622 |
0.985 |
0.395 |
0.395 |
||||||
|
Great Britain |
0.211 |
0.360 |
0.830 |
0.677 |
0.594 |
0.580 |
||||||
|
Italy |
0.336 |
0.495 |
2.288 |
0.776 |
0.186 |
0.165 |
||||||
|
Japan |
0.574 |
0.726 |
3.202 |
1.277 |
0.507 |
0.465 |
||||||
|
Sweden |
0.904 |
0.828 |
1.258 |
0.416 |
0.482 |
0.502 |
||||||
|
USA |
0.385 |
0.556 |
0.628 |
0.338 |
0.489 |
0.498 |
||||||
|
Data source: Banque de France. |
||||||||||||
We investigate this hypothesis further by plotting the average TFP growth rate for each period against the gap between the corresponding country and the country with the highest TFP level at the beginning of the period. The results are plotted on Figures 1.5–1.9. We add to each plot a simple regression line, along with the associated regression equation and the goodness of fit. The results show that during all investigated periods, there is a positive relation between the distance to TFP frontier and TFP growth. Thus, this simple regression analysis suggests strongly that catching up to the best world practices is a major reason for the robust growth in TFP and GDP per capita after WWII. Nevertheless, the plots also reveal curious differences across periods. In particular, we find that the catching-up hypothesis seems to account for observed data patterns extremely well from the early 1950s to the late 1980s. The fit to the data is particularly bad for the period after 1990 and before WWI, which suggests that there has not been much of a technological convergence across countries during those times.

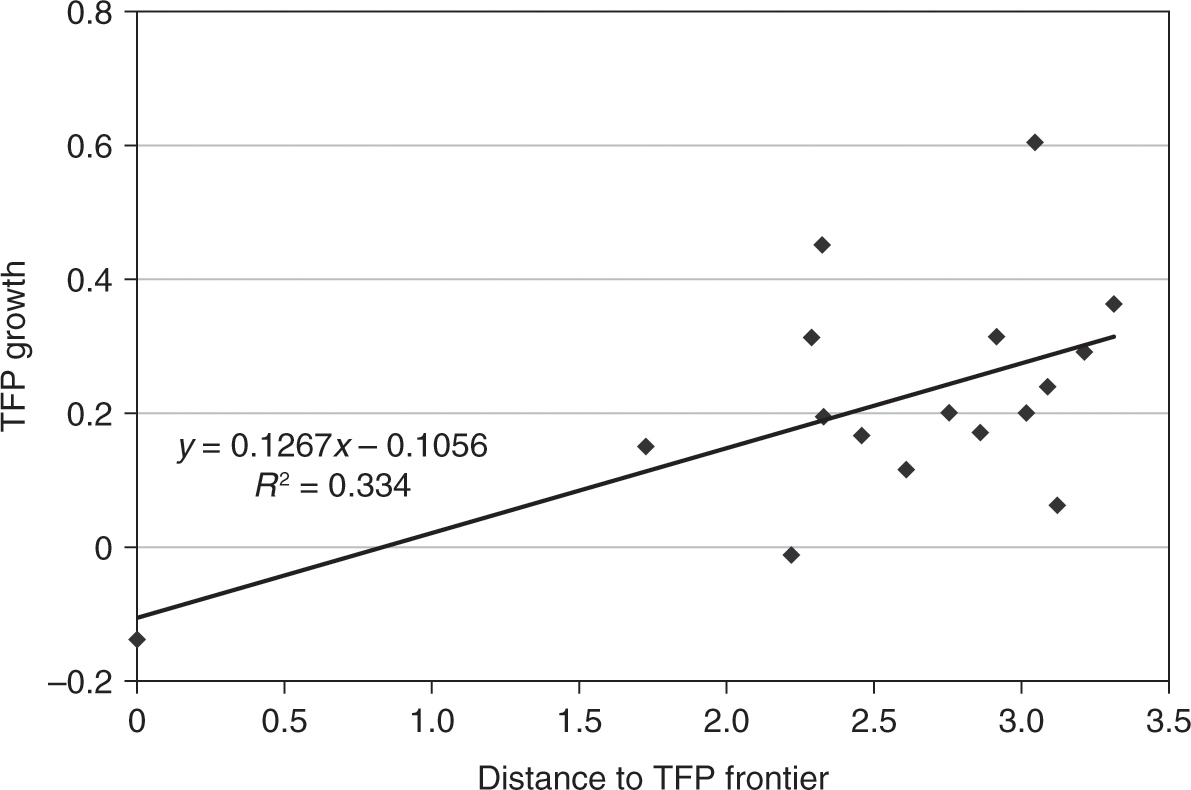
Figure 1.5. Relation between TFP growth and the distance to TFP frontier, pre-WWI period. Note: Distance to TFP frontier is defined as the difference between the highest TFP level in the world and the TFP level of each country. Data source: Banque de France.


Figure 1.6. Relation between TFP growth and the distance to TFP frontier, interwar period. Note: Distance to TFP frontier is defined as the difference between the highest TFP level in the world and the TFP level of each country. Data source: Banque de France.

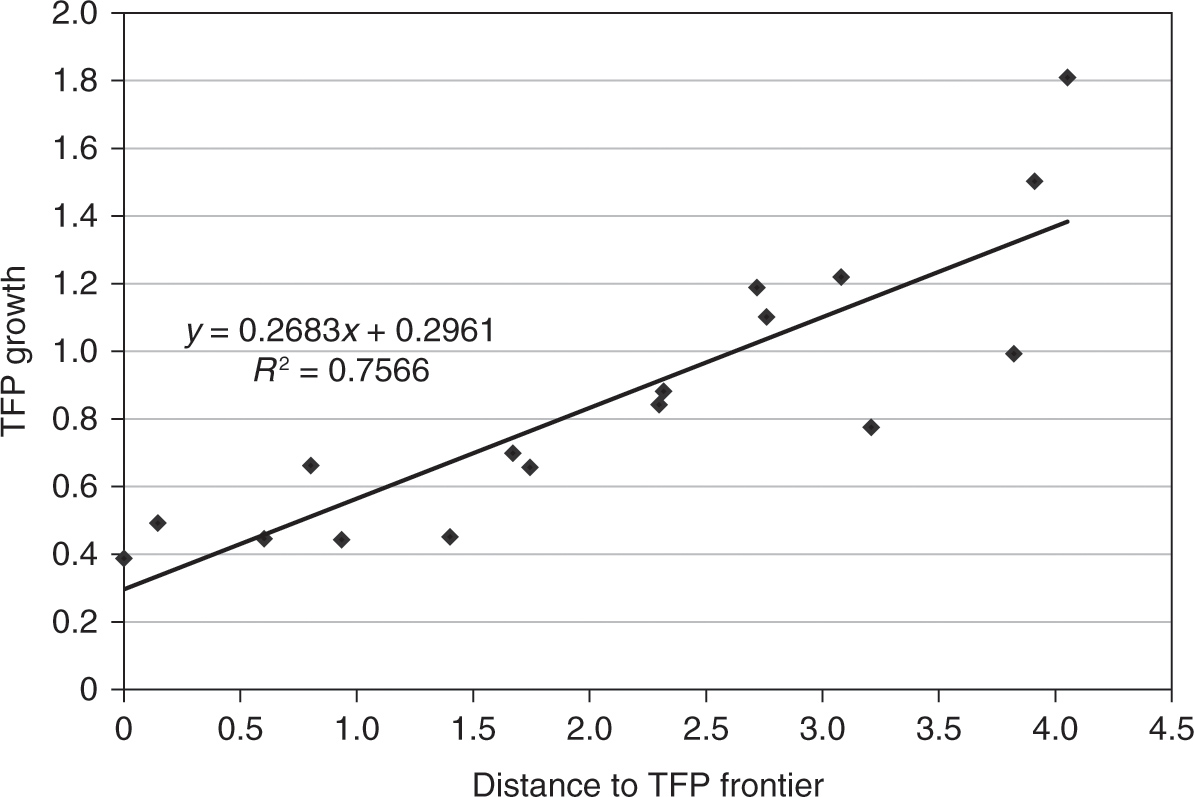
Figure 1.7. Relation between TFP growth and the distance to TFP frontier, post-WWII recovery period. Note: Distance to TFP frontier is defined as the difference between the highest TFP level in the world and the TFP level of each country. Data source: Banque de France.

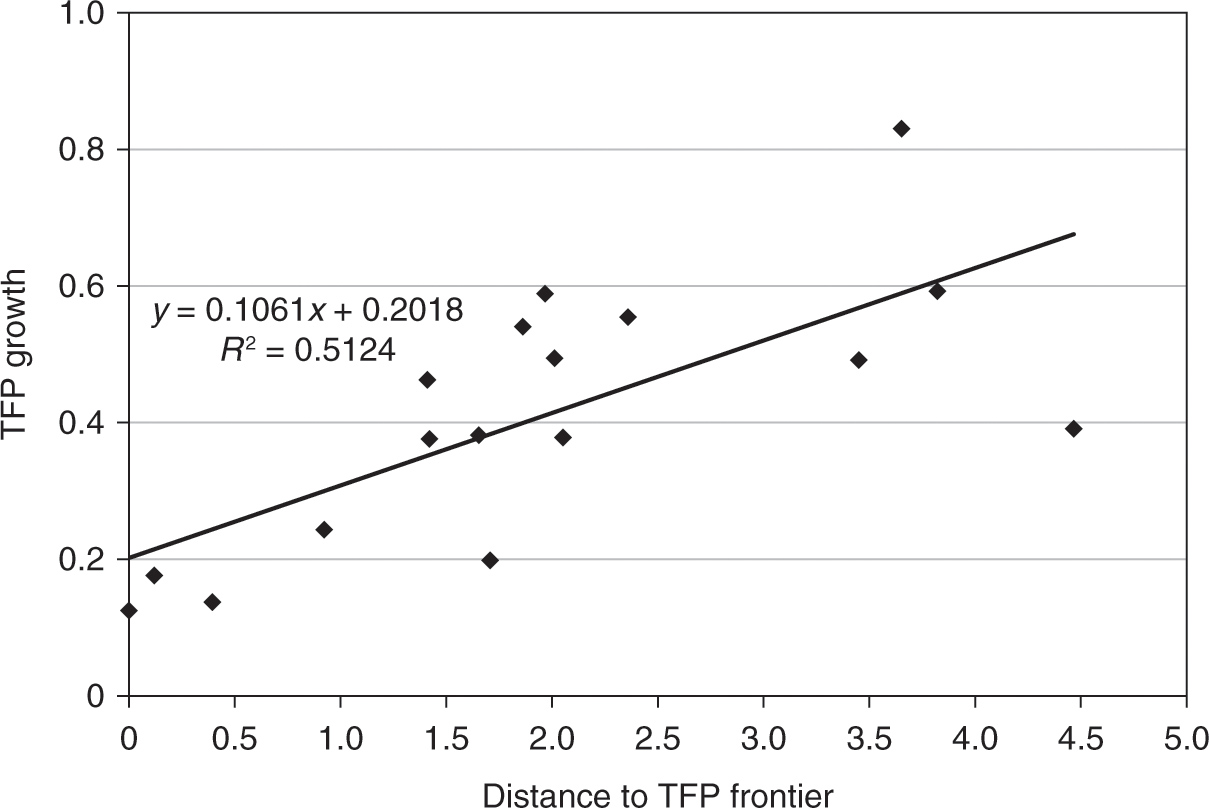
Figure 1.8. Relation between TFP growth and the distance to TFP frontier, post–oil shock period. Note: Distance to TFP frontier is defined as the difference between the highest TFP level in the world and the TFP level of each country. Data source: Banque de France.

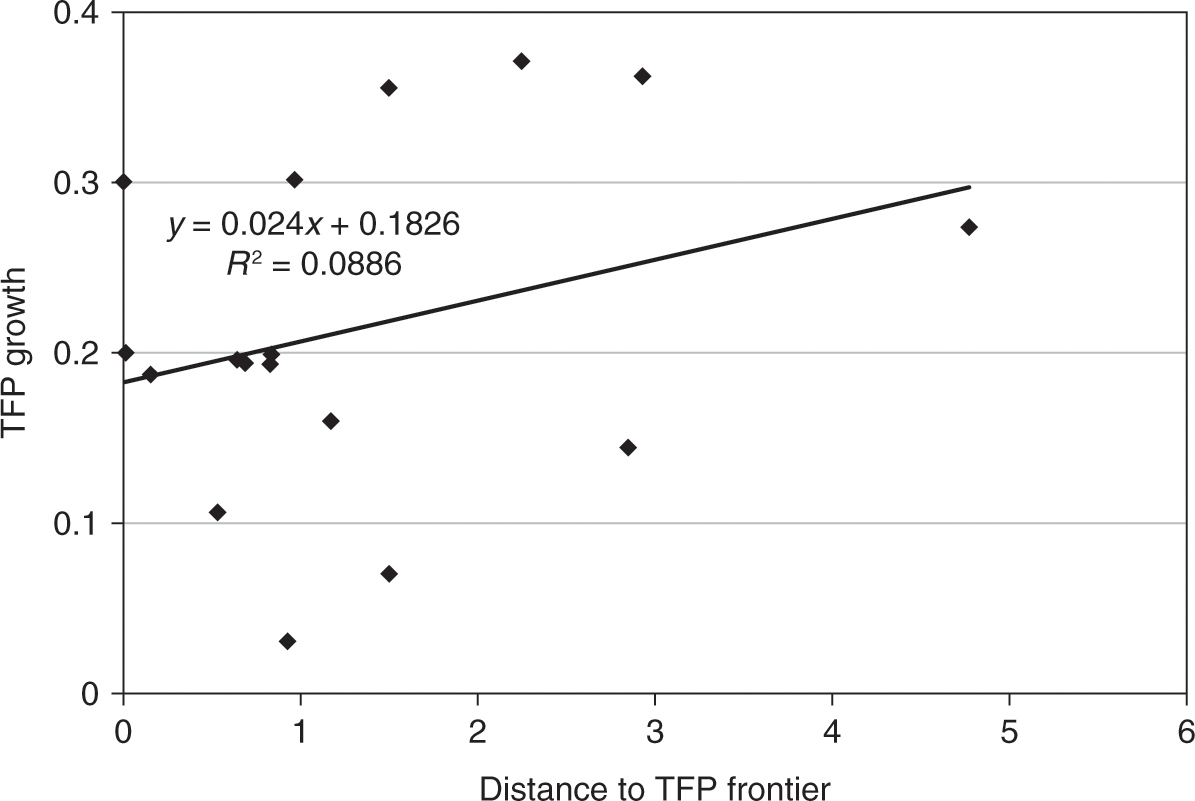
Figure 1.9. Relation between TFP growth and the distance to TFP frontier, IT revolution period. Note: Distance to TFP frontier is defined as the difference between the highest TFP level in the world and the TFP level of each country. Data source: Banque de France.
4. Stylized Facts
The foregoing descriptive analysis of the data leads to several conclusions that motivate our subsequent modeling and empirical work:
- There was a global slowdown in TFP growth after the early 1970s, with rates close to zero after 2005–2006. Thus, the empirical evidence points to a decline in innovation.
- The TFP growth rates of the US and the UK, in particular, recovered only partially during the 1990s and the 2000s, in comparison with their counterparts for the 1930s, 1950s, and 1960s. Thus, the innovations in the IT industry appear to have failed to lift the aggregate innovation and, in turn, TFP growth even in the US or the UK.
- A sizeable proportion of the growth in GDP per capita across countries can be accounted for by TFP growth and, therefore, innovation. This is especially the case for the period before WWI, the interwar years, and the post-WWII recovery period.
- Much of the TFP growth at the same time is due to catching up with the best practices in the world.
- Countries differ significantly in their ability to catch up with the best practices in the world.
- Early on, the UK was the global TFP leader, but the US managed to catch up and overtake the UK by the early 1930s. Since no country can become a leader only by following, any theoretical or empirical exercise on the data needs to allow for the existence of multiple centers of innovation in the world.