5
The Force of Values
Gylfi Zoega
ABSTRACT We study measures of values, institutions, and innovation for 20 OECD countries. Our choice of variables is partly based on the survey of Icelandic innovators in Chapter 4. We find a strong relationship between a latent variable that captures both values and institutions, on the one hand, and a latent variable measuring economic performance on the other hand. In particular, we find that trust, the willingness to take the initiative, the desire to achieve on the job, teaching children to be independent, and the acceptance of competition contribute positively to economic performance. Teaching children to be obedient may, in contrast, reduce economic performance. Economic performance is measured by indigenous total factor productivity (TFP) growth, imported TFP growth, job satisfaction, male labor force participation, and employment. Fertility is also included in this variable as a measure of optimism about the future.
Introduction
In Chapter 2 we found that indigenous innovation in the 1990s was higher in the US, the UK, and Scandinavia than in the continental European economies and Japan after 1990. The objective of this chapter is to establish a set of values and beliefs that can explain this pattern using aggregate data on values as well as describing the consequences when such values are lacking.
The performance of the economy, its growth rate, its employment rate, and its level of output determine our standards of living and our level of job satisfaction. The main driving force behind the performance of the economy is the rate of innovations made by talented individuals. The late William Baumol made the point that every nation has its share of talented individuals, but how they spend their time and which goals they have depends on the values of society and its institutions.1 This chapter is about innovation and values. We explore which values and resulting attitudes are most conducive to innovation. We ask whether differences in observed values and resulting attitudes help explain differences in the rate of indigenous innovation across countries. We try to answer whether some countries are endowed with values and resulting attitudes more conducive to innovation and which cultural attributes are most conducive to innovation.
1. Innovation and Economic Performance
The concept at the heart of our study is innovation, which is the driver of growth. We define an indigenous innovation to be an invention made in the home country that has been significantly adopted by businesses or consumers in the economy. In contrast, imported innovations are innovations made in other countries and adopted by businesses in the home country. An indigenous innovation consists, in our framework, of a genuinely new idea born in the mind of a businessperson that no one has thought of before, which is then put into practice. Examples include the foundation of the 24-hour news channel CNN, the smartphone, or the iPad.
Indigenous innovations are not adaptations to the changing business environment, such as that performed by the Hayekian entrepreneur, who acts to bring the economy toward its potential output level. According to Hayek, shifting conditions—for example, population increases or discoveries made by engineers and scientists—open the way for commercial applications by entrepreneurs, which brought the economy closer to the efficiency frontier.2 In his view, creativity is not found among the entrepreneurs; instead it is the scientists who come up with the new ideas. Examples include the commercial jet aircraft, which owes its existence to the work of engineers during WWII; automobiles, which owe their existence to the technological discovery of the internal combustion engine; and elevators, which owe their existence to the discovery by Elisha Otis in 1852 of the so-called safety brake that prevents elevators from falling down the elevator shaft. Neither are indigenous innovations the Schumpeterian entrepreneur’s commercial application of technological discoveries made by scientists.
Instead, in our framework, which is used in this chapter, indigenous innovations are new business ideas that expand the production frontier. An economy of indigenous innovation is one that continuously expands its production possibility through a stream of new ideas—about new products and new production methods—by businesspeople that are gradually diffused over the rest of the economy.
The source of new ideas is the creativity of businesspeople who use their imagination to conceive of new products or methods and who use their ingenuity in implementing those products or methods. The indigenous innovation in a country derives from the creativity of the nation and its ability to utilize these innovations, while the ability of an economy to innovate depends on the economic system in place. In particular, the capitalist system can enable innovation in several ways. First, it can provide support through helpful institutions—such as the patent system—and through the willingness of authorities to help new businesses prosper, accept the forces of creative destruction, and so on. It can also do so by discouraging attempts to protect vested interests, which characterize corporatist economies. The nation must also include a large number of talented individuals who have the interest and insightfulness to innovate. These people have some intuition about business that makes them capable of thinking about new products and new ways to produce them; they are also willing to take risks and accept the possibility of failure. Finally, values and beliefs matter, including the values and resulting attitudes instilled in children and the society’s attitudes toward innovators, which dictate whether they are admired or envied, and whether the creative individuals receive support from their communities or attempts are made at repressing them, to name a few examples.
Phelps (2017) describes how the origins of the prevailing values and resulting attitudes toward innovative activity may be found in a nation’s ethic, which Max Weber traced to the influence of religion.3 In the book Mass Flourishing (2013), Phelps describes how the spirit of dynamism varies between countries and changes over time. He describes how these attitudes grew more prevalent in parts of the West from the beginning of the 16th century well into the 1800s—in particular in Britain, the US, Germany, and France.4 While Weber traced the changed values and resulting attitudes to the Protestant Reformation, Phelps traces it to the emergence of what he calls the modern ethic in the late Renaissance and the baroque era.
This modern ethic values individualism and the desire to create the new. These values replaced the “traditional values” (or communitarian values) that oppose change and new entrants, as well as “family values” that prevent members of the family from breaking away and taking risks. According to Phelps, modern values gradually created the modern economy, which is capable of generating and sustaining dynamism (the continuous creation of new ideas, what we call indigenous innovations). This resulted in an explosion of innovation, which generated rapid productivity growth from the beginning of the 19th century to the end of the 1960s. Labor productivity growth was unprecedented at around 3 percent per annum, making productivity double every 20 years or so. As a result, wages and living standards rose at an unprecedented rate, and the workplace gradually became more rewarding.
Since the mid-1970s, low levels of productivity growth have been observed in the Western world, especially in Europe. The end of the golden age of growth in Europe coincided with the collapse of the Bretton Woods system and the beginning of the floating exchange rate regime. The increased volatility of exchange rates and the massive capital flows that were unleashed may have affected growth rates. Other factors that were unleashed include the rise of corporatism and its set of stifling regulations that make it more costly to operate businesses, consumer protections, licensing requirements, and the protection of long-lived patents.5 Some of these regulations serve special interests in addition to their stated goal of protecting one group, such as consumers, from the harmful effects of another, such as businesses and banks. There has also been a visible change in the business culture. Short-termism that aims at maximizing bonuses and seeking rent within companies reduces the incentive to innovate.
Underlying this corruption of government and corporations is a change of values in which protection of the vested interests is prioritized over innovation and risk-taking. The corporatists do not approve of uncertainty and disorder, something that is ingrained in a dynamic innovative economy. Instead, what is valued is a steady rise in consumption and leisure brought about by gradual gains in efficiency.
Here we will explore the relationship between innovations and cultural values. We also take institutions into account, since these may have impeded innovations and growth in recent decades.
2. Review of the Literature
We study values at the aggregate level using survey data, but these are only the sum of the values of individuals. The question is whether the prevailing attitudes include those conducive to innovation. While Joseph Schumpeter’s definition of the entrepreneur differs from our definition of the innovator, as discussed earlier, the personality traits may not be entirely dissimilar. Schumpeter (1911 / 12) describes the entrepreneur as having the dream and the will to found a private kingdom, usually, though not necessarily, also a dynasty; having the will to conquer and the impulse to fight, to prove oneself superior to others, and to succeed not for the fruits of success but for success itself. In other words, the financial result is a secondary consideration valued mainly as an index of success and as a symptom of victory.6 Moreover, according to Schumpeter, entrepreneurs enjoy building things, getting things done, or simply exercising their energy and ingenuity; they like to seek out difficulties and change in order to change.
In his seminal study, McClelland (1961) found that entrepreneurial behavior can be associated with personality characteristics, such as the desire for achievement, moderate risk aversion, a preference for novel activities, and the tendency to assume personal responsibility for successes or failure.7 Brockhaus (1982) associates three attributes with entrepreneurial behavior: the need for achievement, an internal locus of control, and risk-taking propensities.8 According to Sexton and Bowman (1985), entrepreneurs need autonomy, independence, and dominance.9 According to Licht and Siegel (2006), wealth attainment is less important for entrepreneurs than power, vision, leadership, and independence.10 Cromie (2000) summarizes the literature by writing that entrepreneurs have seven distinguishing characteristics: a need for achievement, a need for control over events, a propensity for risk-taking, creativity, autonomy, a tolerance for ambiguity, and self-confidence.11
The prevailing values in society also matter. There have been many studies relating economic performance to prevailing values and resulting attitudes, which may affect innovation. Lynn (1991) found that differences in attitudes toward competitiveness can help explain differences in economic growth in a sample of 41 countries.12 Countries where the population is more accepting of competition can be expected to grow more rapidly. Shane (1993) examined the effect of such cultural values as individualism, uncertainty avoidance, and masculinity on national rates of innovation in 33 countries in 1975 and 1980; he found that high rates of innovation were most closely related to cultural values that promote the acceptance of uncertainty, but he acknowledged that individualism is also an influence.13 These authors concluded that nations may differ in their rates of innovation because of the cultural values of their citizens.
A number of studies have documented the importance of trust. Economists have been aware of this aspect for some time. In an early contribution, Banfield (1958) studied the economy of a poor village in southern Italy and attributed poverty to a set of values that were detrimental to economic performance.14 People tended to trust other family members but put less trust in other members of the community. Those findings are related and similar to those of Putnam (1993), who argued that the northern regions of Italy were performing better than those in the South because the northerners, on average, belonged to more associations.15 Knack and Keefer (1997) stress the importance of trust in incomplete contracts because it decreases the level of uncertainty.16 Tabellini (2010) discusses the economic importance of trust from the angle of the prisoner’s dilemma.17 He found that trust increases the efficiency of anonymous market exchanges and reduces the need for external enforcement of contracts. Thus, trust helps an innovative economy by making it easier to enforce incomplete contracts with suppliers and buyers of new products and services, and by reducing principal agent problems within newly established firms, thus reducing the risk associated with new investments.18 Many studies have documented a relationship between trust among citizens as reported in surveys and national output and income per capita.19
Among those studies close to ours, there are also studies of how values and resulting attitudes in general in the workplace affect performance. Phelps (2006) explores the relationship between economic performance and values and resulting attitudes.20 He found that economies exhibited better performance where more people regard work as important to them, want to show initiative at work, find jobs that are interesting, accept competition in markets, and prefer new ideas to old ones.
Tabellini (2010) used cultural variables to explain the variation in output per capita and the growth of output in European regions.21 He used questions from the World Values Survey to describe the positive aspects of culture: one measured trust of other people, another measured tolerance and respect for other people, and the third measured the degree to which people feel they have control of their own lives. There was one negative cultural trait, the extent to which parents try to teach their children to be obedient. He found that these value variables could help explain differences in output and growth across European regions.
In another study, Phelps and Zoega (2009) found that the possession of a good work ethic, the ability to take initiative, and the ability to place trust in others raise job satisfaction and also affect the rate of unemployment and labor force participation.22 In related work by Bojilov and Phelps (2012), the authors found that job satisfaction is higher in nations where more people think it is fair to pay more to the more productive, agree that the direction of firms is best left to the owners, and feel that new ideas may be worth developing and testing.23 In particular, the study found that economic performance is worse in nations where “traditional” attitudes are strong.
In Mass Flourishing (2013), Phelps discusses the factors that make nations flourish on a wide scale and the possible reasons why such flourishing is under threat today.24 He traces the innovations and prosperity in many nations—from the 19th century to the 1960s—to modern values such as the desire to create, explore, and meet challenges. He argues that it was these values that fueled the dynamism that was necessary for the widespread, indigenous innovation that created “mass flourishing”—meaningful work, self-expression, and personal growth.
Arnorsson and Zoega (2016) measure values and beliefs by region in Europe and relate them to youth unemployment and youth labor force participation.25 Social capital is measured by the level of trust in fellow citizens, as well as by the set of shared values that have to do with behavior in the labor market. The results show a clear relationship between values and youth unemployment and participation, including when differences in institutions and the state of the business cycle between countries are taken into account. Thus, teaching children to be independent, imaginative, and tolerant contributes positively to values, as does a higher level of trust toward fellow citizens. The differences can account for differences in unemployment, male labor force participation, and the average hours of work across regions.
3. Exploring the Data and Empirical Relationships
We start by describing the data briefly, then explain the empirical method that we employ (the method of canonical correlations proposed by Harold Hotelling in the 1930s and widely used in other social sciences), and then show the results in table form and graphs.26
3.1. The Data
In our context, cultural values and institutional variables make up one latent variable and economic performance another. We use our statistical method to generate a single cultural variable based on answers to questions in the World Values Survey. In our choice of variables, we are guided by the values found in our interviews of the successful Icelandic innovators, described in Chapter 4. These include the extent to which people trust their fellow citizens; the extent to which they desire job security; the ability to take the initiative on the job or to achieve on the job; the values instilled in children, which include obedience and independence; and attitudes toward competition. The institutional variable measuring economic freedom is taken from the Heritage Foundation. The latent economic performance variable is calculated as a weighted average of the rate of indigenous innovation, the rate of imported (or adapted) innovation taken from Chapter 2, job satisfaction, the employment rate (1 − u), the fertility rate, and the rate of male labor force participation. We include the fertility rate as an indicator of the optimism parents have concerning the future. The numbers for each country are shown in Table 5.1.
We note several patterns in the data. Parents in southern Europe are keener to teach their children to be obedient than parents in northern Europe and the United States, while the latter value independence more. We also observe that the UK and the US are more accepting of competition than the rest of the countries (apart from Norway). Northern Europe and the US are also higher on the list when it comes to economic freedom. The US and Sweden have the highest rates of indigenous innovation.
3.2. Canonical Correlations
We employ the method of canonical correlations to map the relationship between values and innovation.27 The method makes sense of the cross-covariance matrices of two multidimensional variables. To perform the canonical correlation, we gather together some observed measures into two different variable sets, X and Y, which represent the two multidimensional components of the latent variables, henceforth known as the canonical variables X and Y. The variable X is our measure of values, and the variable Y is our measure of innovation. Next, we assign weights to the variables within X and Y—see Table 5.2—in order to create two linear combinations, X* and Y*, one for each variable set, which maximize the bivariate correlation between the canonical variables. The set of linear combinations, called canonical functions, are chosen to maximize the canonical correlation between the two latent canonical variables X* and Y*. Several uncorrelated components or functions can be determined, as in principal components analysis.
The first function creates the linear combination, so the two latent variables are as strongly correlated as possible. However, there will probably be some residual variance left over which cannot be explained by the first canonical function. That means we can find another linear combination that maximizes the correlation between X* and Y* given the residual variance subject to the constraint that the new function has to be perfectly uncorrelated with the previous one. This gives us another set of X* and Y*. The first function is the most important; the second has another linear combination that maximizes the correlation between X* and Y* given the residual variance subject to the constraint that the new function has to be perfectly uncorrelated with the previous one and so on. This process can be repeated as many times as there are variables in the smaller variable set, or until there is no residual variance left. The researcher may begin to interpret the results when all the canonical functions have been retrieved.28 Appendix I has the definitions of important concepts for the interpretation of the results following an example described by Sherry and Henson (2005).29
|
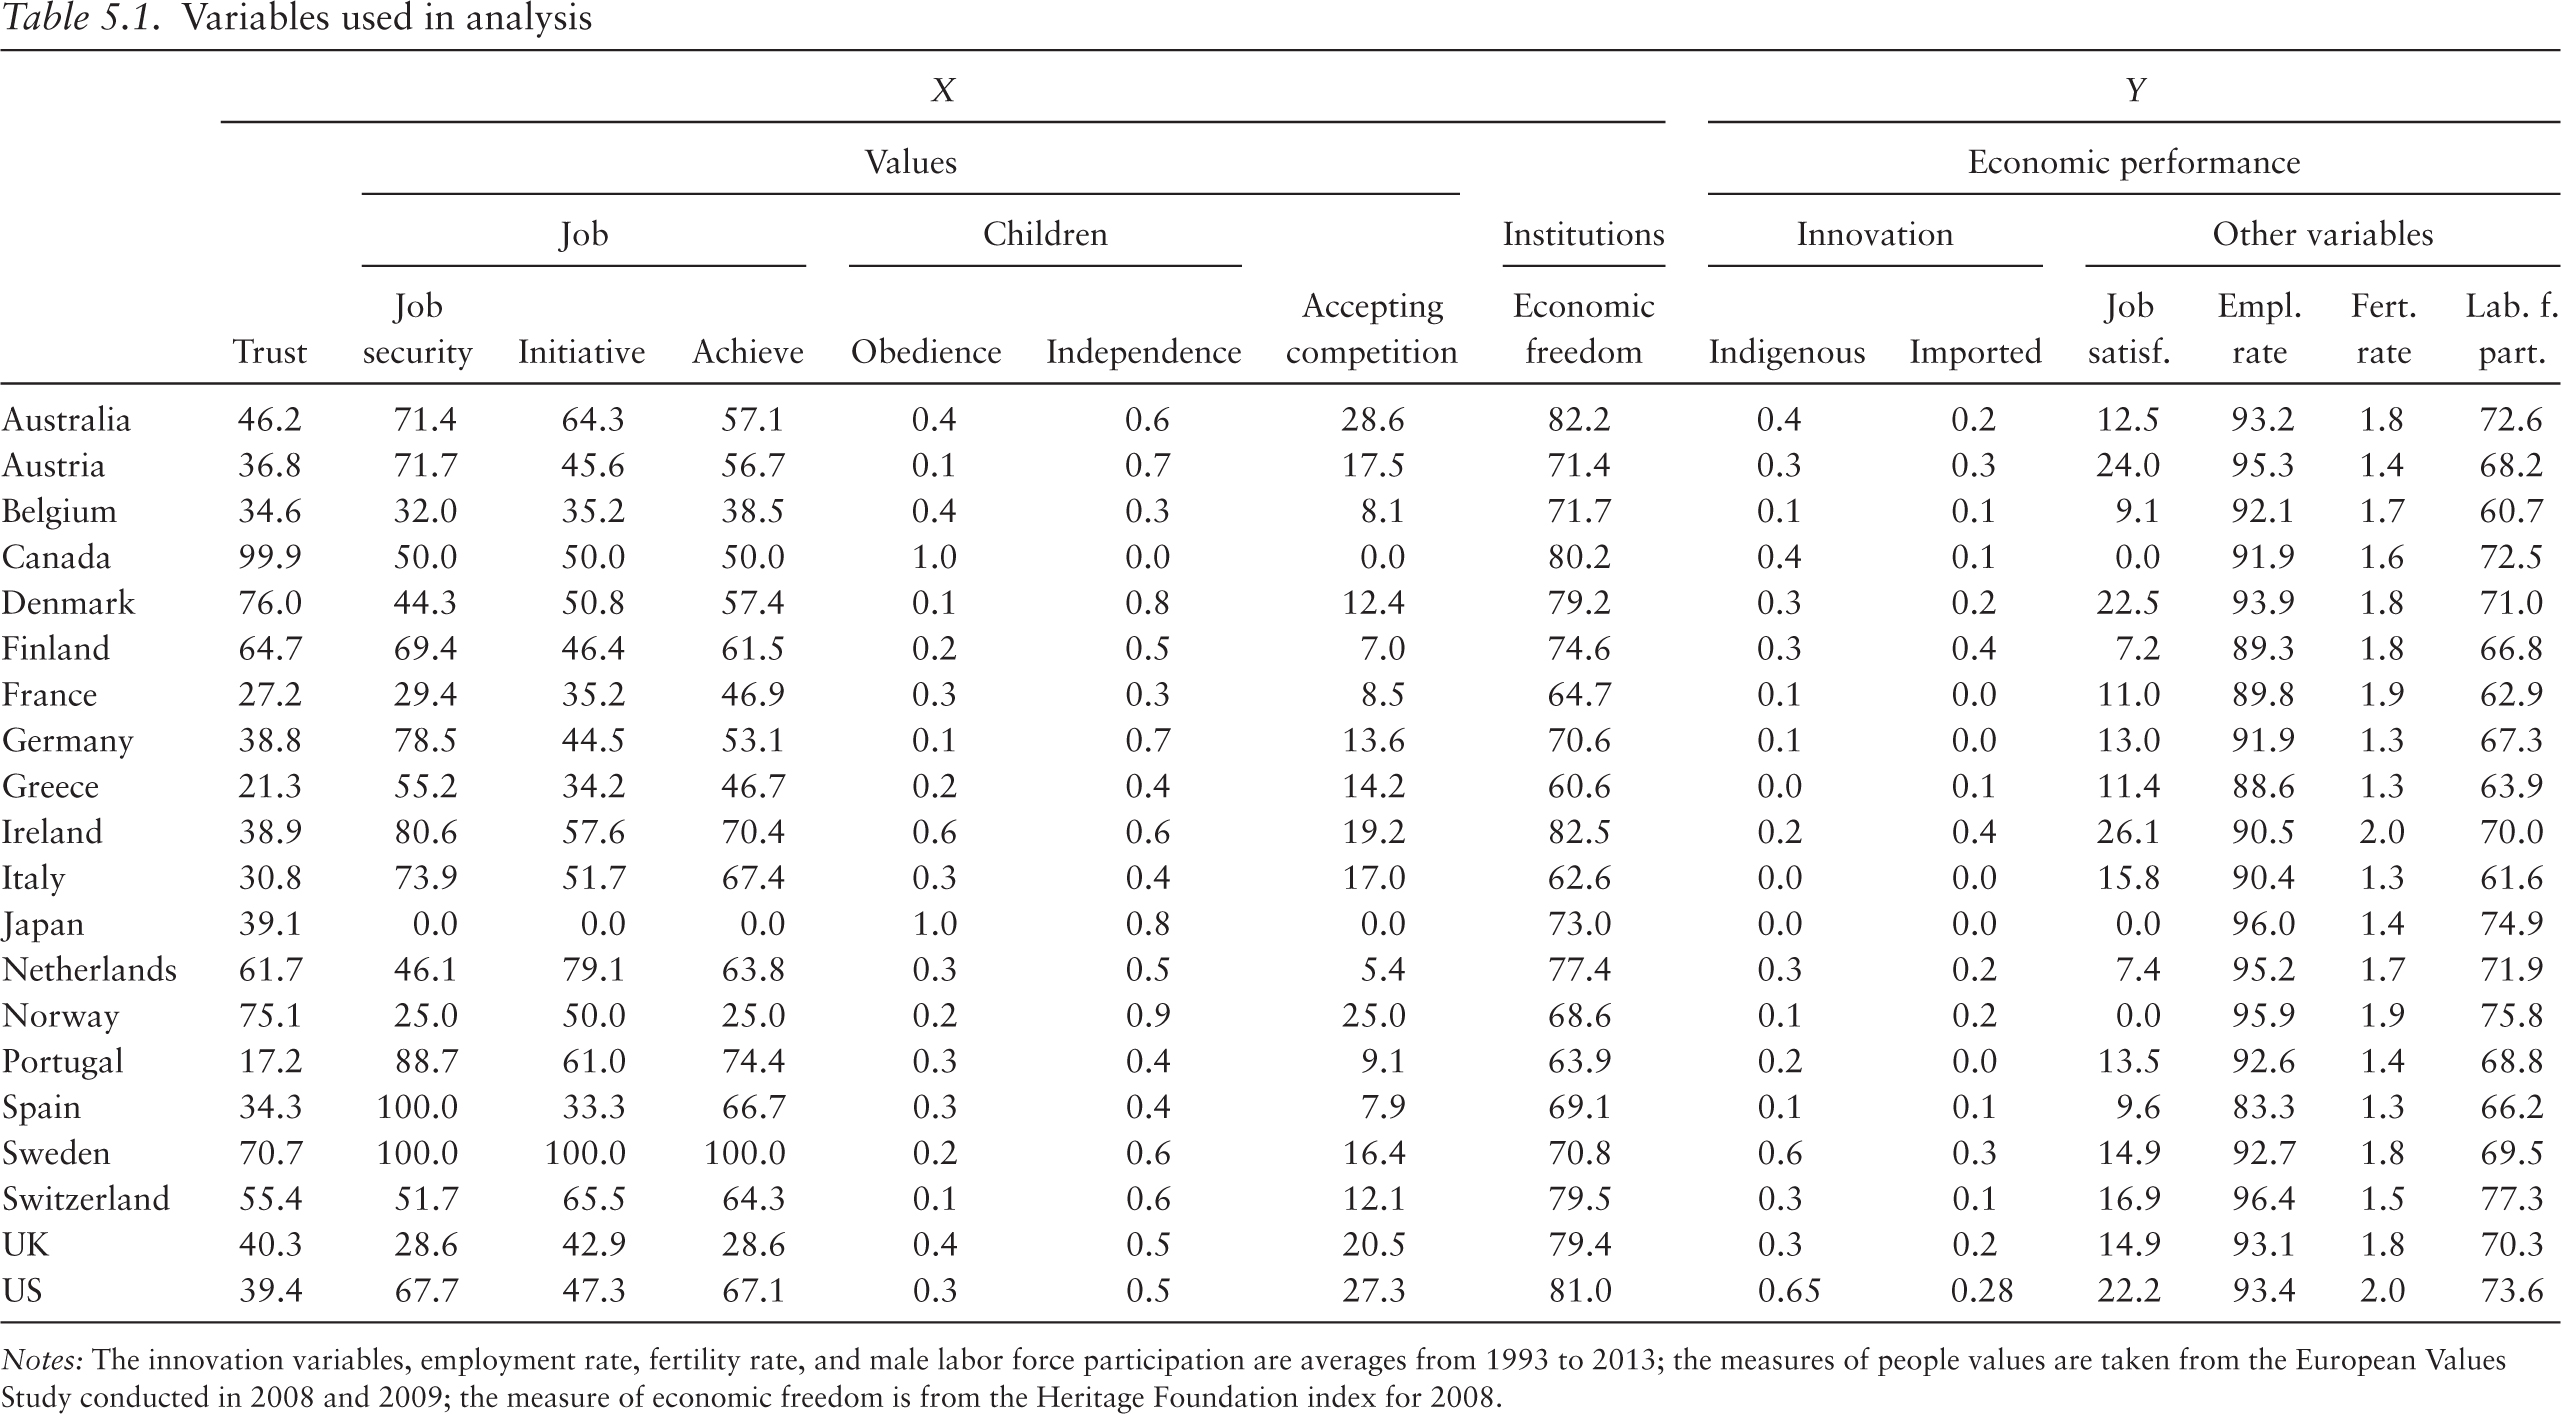
Table 5.1. Variables used in analysis |
||||||||||||||||||||||||||||
|
X |
Y |
|||||||||||||||||||||||||||
|
Values |
Economic performance |
|||||||||||||||||||||||||||
|
Trust |
Job |
Children |
Institutions |
Innovation |
Other variables |
|||||||||||||||||||||||
|
Job security |
Initiative |
Achieve |
Obedience |
Independence |
Accepting competition |
Economic freedom |
Indigenous |
Imported |
Job satisf. |
Empl. rate |
Fert. rate |
Lab. f. part. |
||||||||||||||||
|
Australia |
46.2 |
71.4 |
64.3 |
57.1 |
0.4 |
0.6 |
28.6 |
82.2 |
0.4 |
0.2 |
12.5 |
93.2 |
1.8 |
72.6 |
||||||||||||||
|
Austria |
36.8 |
71.7 |
45.6 |
56.7 |
0.1 |
0.7 |
17.5 |
71.4 |
0.3 |
0.3 |
24.0 |
95.3 |
1.4 |
68.2 |
||||||||||||||
|
Belgium |
34.6 |
32.0 |
35.2 |
38.5 |
0.4 |
0.3 |
8.1 |
71.7 |
0.1 |
0.1 |
9.1 |
92.1 |
1.7 |
60.7 |
||||||||||||||
|
Canada |
99.9 |
50.0 |
50.0 |
50.0 |
1.0 |
0.0 |
0.0 |
80.2 |
0.4 |
0.1 |
0.0 |
91.9 |
1.6 |
72.5 |
||||||||||||||
|
Denmark |
76.0 |
44.3 |
50.8 |
57.4 |
0.1 |
0.8 |
12.4 |
79.2 |
0.3 |
0.2 |
22.5 |
93.9 |
1.8 |
71.0 |
||||||||||||||
|
Finland |
64.7 |
69.4 |
46.4 |
61.5 |
0.2 |
0.5 |
7.0 |
74.6 |
0.3 |
0.4 |
7.2 |
89.3 |
1.8 |
66.8 |
||||||||||||||
|
France |
27.2 |
29.4 |
35.2 |
46.9 |
0.3 |
0.3 |
8.5 |
64.7 |
0.1 |
0.0 |
11.0 |
89.8 |
1.9 |
62.9 |
||||||||||||||
|
Germany |
38.8 |
78.5 |
44.5 |
53.1 |
0.1 |
0.7 |
13.6 |
70.6 |
0.1 |
0.0 |
13.0 |
91.9 |
1.3 |
67.3 |
||||||||||||||
|
Greece |
21.3 |
55.2 |
34.2 |
46.7 |
0.2 |
0.4 |
14.2 |
60.6 |
0.0 |
0.1 |
11.4 |
88.6 |
1.3 |
63.9 |
||||||||||||||
|
Ireland |
38.9 |
80.6 |
57.6 |
70.4 |
0.6 |
0.6 |
19.2 |
82.5 |
0.2 |
0.4 |
26.1 |
90.5 |
2.0 |
70.0 |
||||||||||||||
|
Italy |
30.8 |
73.9 |
51.7 |
67.4 |
0.3 |
0.4 |
17.0 |
62.6 |
0.0 |
0.0 |
15.8 |
90.4 |
1.3 |
61.6 |
||||||||||||||
|
Japan |
39.1 |
0.0 |
0.0 |
0.0 |
1.0 |
0.8 |
0.0 |
73.0 |
0.0 |
0.0 |
0.0 |
96.0 |
1.4 |
74.9 |
||||||||||||||
|
Netherlands |
61.7 |
46.1 |
79.1 |
63.8 |
0.3 |
0.5 |
5.4 |
77.4 |
0.3 |
0.2 |
7.4 |
95.2 |
1.7 |
71.9 |
||||||||||||||
|
Norway |
75.1 |
25.0 |
50.0 |
25.0 |
0.2 |
0.9 |
25.0 |
68.6 |
0.1 |
0.2 |
0.0 |
95.9 |
1.9 |
75.8 |
||||||||||||||
|
Portugal |
17.2 |
88.7 |
61.0 |
74.4 |
0.3 |
0.4 |
9.1 |
63.9 |
0.2 |
0.0 |
13.5 |
92.6 |
1.4 |
68.8 |
||||||||||||||
|
Spain |
34.3 |
100.0 |
33.3 |
66.7 |
0.3 |
0.4 |
7.9 |
69.1 |
0.1 |
0.1 |
9.6 |
83.3 |
1.3 |
66.2 |
||||||||||||||
|
Sweden |
70.7 |
100.0 |
100.0 |
100.0 |
0.2 |
0.6 |
16.4 |
70.8 |
0.6 |
0.3 |
14.9 |
92.7 |
1.8 |
69.5 |
||||||||||||||
|
Switzerland |
55.4 |
51.7 |
65.5 |
64.3 |
0.1 |
0.6 |
12.1 |
79.5 |
0.3 |
0.1 |
16.9 |
96.4 |
1.5 |
77.3 |
||||||||||||||
|
UK |
40.3 |
28.6 |
42.9 |
28.6 |
0.4 |
0.5 |
20.5 |
79.4 |
0.3 |
0.2 |
14.9 |
93.1 |
1.8 |
70.3 |
||||||||||||||
|
US |
39.4 |
67.7 |
47.3 |
67.1 |
0.3 |
0.5 |
27.3 |
81.0 |
0.65 |
0.28 |
22.2 |
93.4 |
2.0 |
73.6 |
||||||||||||||
|
Notes: The innovation variables, employment rate, fertility rate, and male labor force participation are averages from 1993 to 2013; the measures of people values are taken from the European Values Study conducted in 2008 and 2009; the measure of economic freedom is from the Heritage Foundation index for 2008. |
||||||||||||||||||||||||||||
In Table 5.2 we report the results of the canonical correlation analysis for a set of 20 countries.30 The results consist of a function generating a canonical correlation.31 The first column in the function has a standardized coefficient: the weight attached to the variables to generate the linear combination X* or Y* so as to maximize the correlation between the two.32 The second column has the structure coefficient: the bivariate correlation between each observed variable and the latent variable, X* or Y*. The higher the value of the structure coefficient, the more correlated the variable is with the relevant latent variable. The sign of the correlation is also important. In most cases the sign of the standardized and the structure coefficients are the same. In the few cases that they are not the same, we find that the sign of the structure coefficient is more informative.33 The third column lists the squared value of the structure coefficient: the proportion of the variance that an observed variable shares linearly with a latent variable. Finally, the last column is the communality coefficient: it sums up the squared value of the structure coefficients and hence gives an assessment of the importance of each observed variable for all the significant functions.
The first canonical correlation has a coefficient of 0.951, and the hypothesis that it is nonexistent can be rejected at the 5 percent level. The table shows that X*—the latent variable that measures innovation-inducing values—consists of trust, the willingness to take initiative, the desire to achieve on the job, teaching children to be independent, acceptance of competition, and economic freedom, all of which contribute positively to innovation, and teaching children to be obedient, which has a negative effect.34
The findings are that Y* consists positively of indigenous innovation, imported innovation job satisfaction—justified by assuming that innovative industries bring more job satisfaction—employment, and male labor force participation.35 We also included the fertility rate in the Y variable, which we justify by the fact that high fertility is indicative of optimism about the future. Of these, the employment rate is the least significant and the rate of indigenous innovation the most significant.
|
Table 5.2. Canonical correlation analysis, 1993–2013 |
||||||||
|
Variable |
Std. coef. |
Str. coef. |
Str. coef 2 |
Com. coef. (%) |
||||
|
Input—values conducive or detrimental to innovation |
||||||||
|
Trust |
−0.103 |
0.066 |
0.004 |
93 |
||||
|
Job security |
−0.727 |
0.426 |
0.181 |
90 |
||||
|
Job initiative |
−0.635 |
0.499 |
0.249 |
91 |
||||
|
Job achievement |
1.656 |
0.593 |
0.351 |
96 |
||||
|
Children obedience |
0.045 |
−0.292 |
0.085 |
99 |
||||
|
Children independence |
0.101 |
0.187 |
0.035 |
97 |
||||
|
Acceptance of competition |
0.513 |
0.593 |
0.352 |
61 |
||||
|
Economic freedom |
0.567 |
0.602 |
0.362 |
84 |
||||
|
Output—consequences—benefits |
||||||||
|
Indigenous innovation |
0.307 |
0.725 |
0.525 |
100 |
||||
|
Imported innovation |
−0.102 |
0.580 |
0.336 |
100 |
||||
|
Job satisfaction |
0.711 |
0.810 |
0.656 |
100 |
||||
|
Employment |
−0.245 |
0.103 |
0.011 |
100 |
||||
|
Fertility rate |
0.372 |
0.594 |
0.353 |
100 |
||||
|
Male labor participation |
0.267 |
0.245 |
0.060 |
100 |
||||
|
Canonical correlation coefficient |
Squared canonical coefficient |
|||||||
|
0.951 |
0.904 |
|||||||
|
F-statistics |
1.8219 |
|||||||
|
Prob. > F |
0.0351 |
|||||||
3.3. Graphs
Figure 5.1 shows the relationship between the estimated latent variable for values and institutions X* and the latent variable for innovation Y*. The fit of the relationship is quite striking from the least innovative economy, which is, surprisingly, Japan, to the most innovative one, which is the United States.
In the upper right-hand corner, we have countries that have the most innovation-inducing values, as well as the most innovative economies. These are the United States, Ireland, Denmark, Sweden, Australia, and Switzerland. In the bottom left-hand corner, we have the worst-performing economies both in terms of values and in terms of the level of innovation. These are Japan, Norway, Greece, Belgium, and Canada.
A similar pattern emerges in Figure 5.2, where we plot both indigenous and imported innovation against the latent values variable X*. The fit is now worse than in Figure 5.1, but the pattern of countries is similar. When it comes to imported innovation, we find that Ireland, Finland, and Sweden are at the top of the list, and Japan, Portugal, Italy, Germany, and France are at the bottom of the list. The most and the least innovative countries thus remain the same with a few exceptions. The United States is no longer at the top of the list when it comes to adopting innovation; instead it is Finland and Ireland. Finland does better than its values would lead us to predict, and Switzerland, Australia, and the United States do worse.
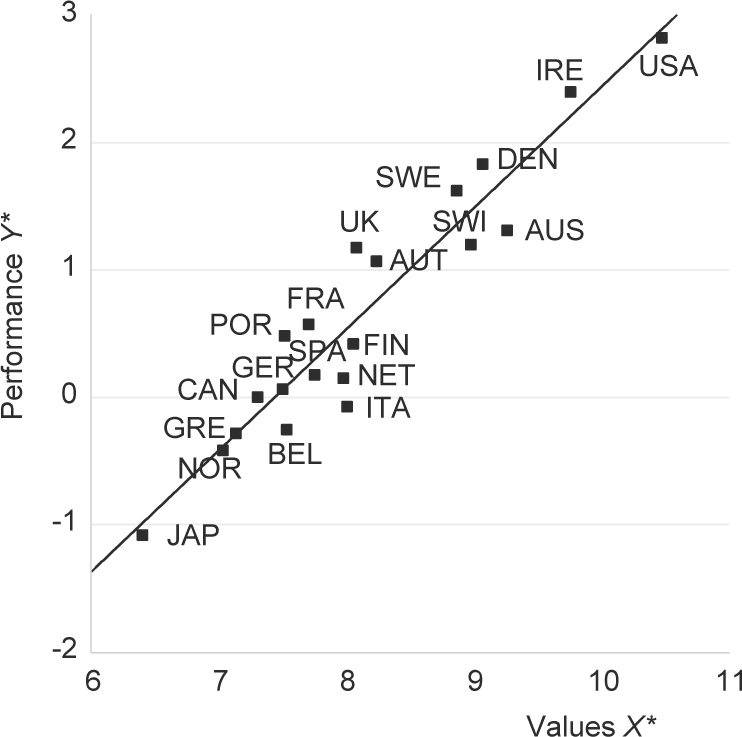
Figure 5.1. Values and innovation. Notes: The figure plots the canonical correlation from Table 5.2. Abbreviations: Australia (AUS), Austria (AUT), Belgium (BEL), Canada (CAN), Denmark (DEN), Finland (FIN), France (FRA), Germany (GER), Greece (GRE), Ireland (IRE), Italy (ITA), Japan (JAP), Netherlands (NET), Norway (NOR), Portugal (POR), Spain (SPA), Sweden (SWE), Switzerland (SWI), the United Kingdom (UK), and the United States (USA).
These results give support to the thesis in Phelps (2006) and Bojilov and Phelps (2012) that dynamism derives from modern values.36 The results are also consistent with the results of the study of the pattern of indigenous innovation in Chapter 2. There it is shown that the rate of indigenous innovation was higher in the US, the UK, and Scandinavia after 1990 than in the continental European countries and Japan. The country with the values most conducive to innovation is the US, followed by Ireland, Australia, Denmark, Sweden, and Switzerland. Thereafter, we have the UK, Finland, and Austria. Of these, Sweden seems to do better than its values would suggest and Ireland somewhat worse. In contrast, Germany, France, Italy, and Japan are lacking in such values and have lower rates of indigenous innovation. These finding thus help explain the pattern of indigenous innovation found in Chapter 2.
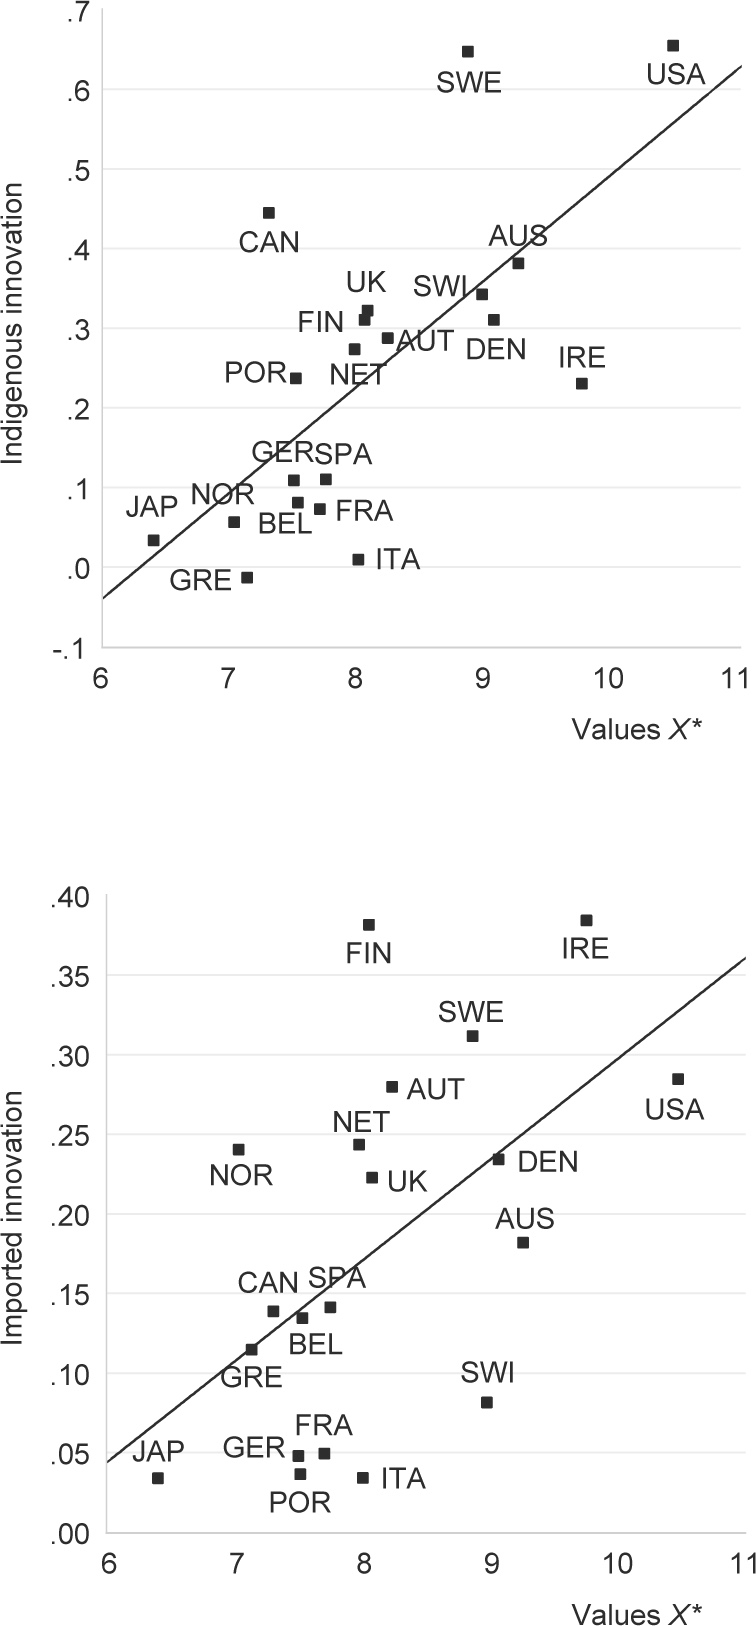
Figure 5.2. Values, indigenous innovation and imported innovation. Note: Abbreviations: Australia (AUS), Austria (AUT), Belgium (BEL), Canada (CAN), Denmark (DEN), Finland (FIN), France (FRA), Germany (GER), Greece (GRE), Ireland (IRE), Italy (ITA), Japan (JAP), Netherlands (NET), Norway (NOR), Portugal (POR), Spain (SPA), Sweden (SWE), Switzerland (SWI), the United Kingdom (UK), and the United States (USA).
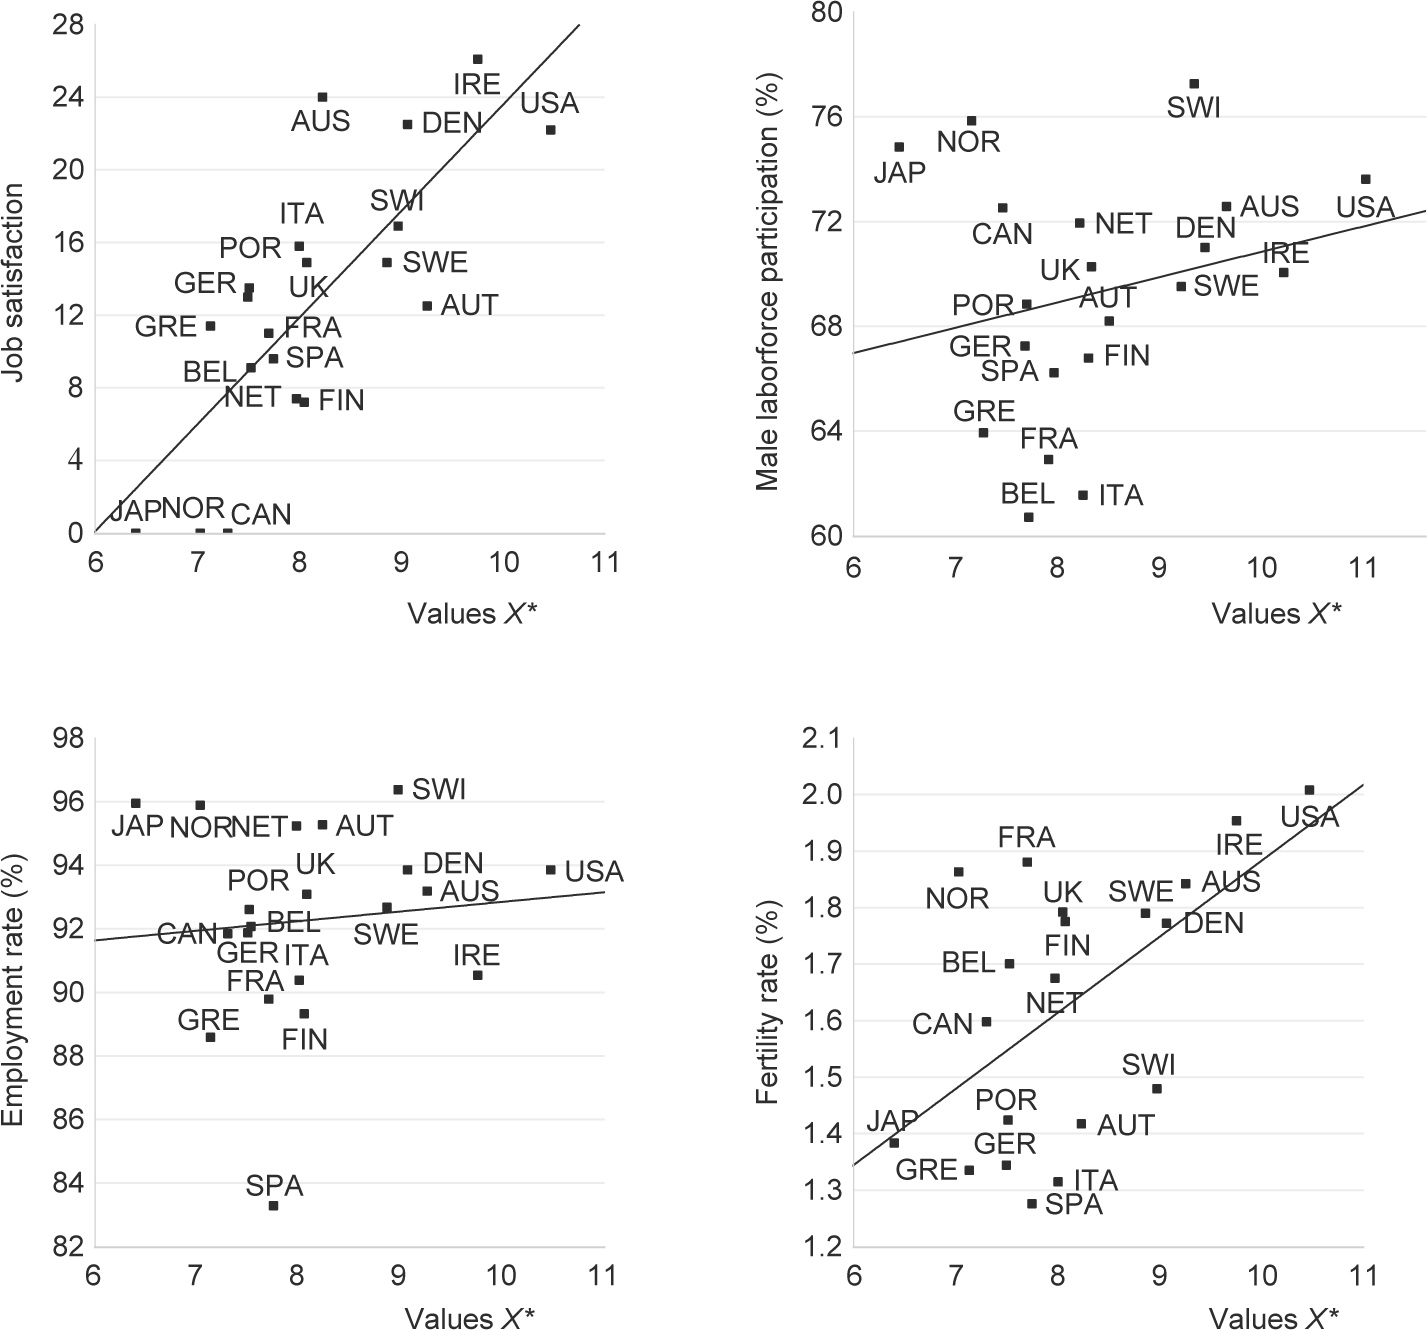
Figure 5.3. Job satisfaction, male labor force participation, employment rate, and fertility rate. Note: Abbreviations: Australia (AUS), Austria (AUT), Belgium (BEL), Canada (CAN), Denmark (DEN), Finland (FIN), France (FRA), Germany (GER), Greece (GRE), Ireland (IRE), Italy (ITA), Japan (JAP), Netherlands (NET), Norway (NOR), Portugal (POR), Spain (SPA), Sweden (SWE), Switzerland (SWI), the United Kingdom (UK), and the United States (USA).
We next plot the four remaining economic performance variables against the latent values variable in Figure 5.3
Again, there is a strong upward-sloping relationship, and the alignment of the countries is similar to before. The United States does well in all four graphs, as do the English-speaking and the Nordic countries, while the southern European countries and Japan do a lot worse. Japan has high employment and male labor force participation, while job satisfaction and fertility are very low.
4. Conclusions
We have studied measures of values and resulting attitudes and various measures of innovation for 20 OECD countries. Several variables contribute positively to the innovation-inducing values variable, such as trust, the willingness to take initiative, the desire to achieve on the job, teaching children to be independent, and the acceptance of competition. In addition, economic freedom is important. One variable—an emphasis on teaching children to be obedient—has a negative impact on the latent values variable; hence, it may reduce innovation. The economic performance variable depends positively on indigenous innovation, imported innovation, job satisfaction, employment, fertility, and male labor force participation.
APPENDIX I
Canonical Correlation: Main Concepts
• Canonical correlation coefficient: The correlation between the two latent variables X* and Y* in a given canonical function.
• Squared canonical correlation: Represents the proportion of variance shared by the two latent variables. It indicates the amount of shared variance between the variable sets.
• Canonical function: Set of standardized coefficients from the observed variable sets.
• Standardized coefficient: The weights attached to observed variables in the two variable sets to yield the linear combinations that maximize the correlation between the two latent variables—that is, the canonical correlation. They are standardized because of the constraint that the variance of the pair of canonical variables in a canonical function is equal, ![]() , where i represents the number of canonical functions. This is vital for obtaining unique values for the coefficients.
, where i represents the number of canonical functions. This is vital for obtaining unique values for the coefficients.
• Structure coefficient: The bivariate correlation between an observed variable and a latent variable, X or Y. They help to define the structure of the latent variable by estimating which observed variables contribute to the creation of the latent variable.
• Squared structure coefficient: The proportion of variance an observed variable linearly shares with a latent variable.
• Communality coefficient: The proportion of variance in each variable that is explained by all the canonical functions that are interpreted. It informs the researcher about the usefulness of the observed variable for the whole model.
APPENDIX II
Variable Descriptions
|
Variable |
Measure |
Details |
Identifier |
Source |
||||
|
Trust |
Row percentage |
Those who replied that most people can be trusted after being asked, “Generally speaking, would you say that most people can be trusted or that you can’t be too careful in dealing with people?” |
Q7 |
EVS (2011) |
||||
|
Job security |
Row percentage |
The percentage of people who mentioned job security as an important aspect of a job |
Q14 |
EVS (2011) |
||||
|
Job initiative |
Row percentage |
The percentage of people who mentioned the opportunity to use initiative as an important aspect of a job |
Q14 |
EVS (2011) |
||||
|
Job achieve |
Row percentage |
The percentage of people who mentioned the feeling that they can achieve something as an important aspect of a job |
Q14 |
EVS (2011) |
||||
|
Children obedience |
Row percentage |
Those who listed obedience as a quality to teach children at home |
Q52 |
EVS (2011) |
||||
|
Children independence |
Row percentage |
Those who listed independence as a quality to teach children at home |
Q52 |
EVS (2011) |
||||
|
Children imagination |
Row percentage |
Those who listed imagination as a quality to teach children at home |
Q52 |
EVS (2011) |
||||
|
Children tolerance |
Row percentage |
Those who listed tolerance and respect as qualities to teach children at home |
Q52 |
EVS (2011) |
||||
|
Acceptance of competition |
Row percentage |
Those who fully agreed that competition stimulates people to work hard and develop new ideas |
||||||
|
Economic freedom |
The 2008 value of the Heritage Foundation index for economic freedom |
|||||||
|
Indigenous innovation |
Percentage |
Taken from Chapter 2 |
||||||
|
Imported innovation |
Percentage |
Taken from Chapter 2 |
||||||
|
Job satisfaction |
Row percentage |
Those who said they were overall satisfied (10) with their job on the scale 1 (dissatisfied) to 10 (satisfied) |
EVS (2011) |
|||||
|
Male employment rate |
Average from 1991 to 2013 |
World Bank (2017) |
||||||
|
Fertility rate |
Average from 1991 to 2013 |
World Bank (2017) |
||||||
|
Male labor force participation rate |
Average from 1991 to 2013 |
World Bank (2017) |
||||||
|
Note: EVS = European Values Study. |
||||||||