6
Individual Values, Entrepreneurship, and Innovation
Raicho Bojilov
ABSTRACT This chapter investigates the causal link between economic culture and economic performance. Using data from the World Values Survey (WVS) for 1990–1993, we design an index of modernism and an index of traditionalism, which summarize in a simple way most of the beliefs, attitudes, and social norms about economic life in a society. Our results show that the index of modernism is positively correlated with total factor productivity (TFP) growth and indigenous and imported innovation, while the index of traditionalism is not. To address concerns about endogeneity and reversed causation, we consider a proxy for our index of modernism. Using data from the General Social Survey (GSS), we uncover the impact of the country of origin of one’s ancestors on the probability that a first-, second-, third-, or fourth-generation American becomes a successful entrepreneur. We treat the estimated country effects as our proxy for inherited modernism. The results show that the country effects are positively related to both the index of modernism and our measures of economic performance, TFP growth, indigenous innovation, and imported innovation.
Introduction
Recent research in economics has found a strong causal relation between aggregate levels of social trust and gross domestic product growth (see, for example, Algan and Cahuc, 2010).1 Butler, Giuliano, and Guiso (2016) also provide evidence that moderate levels of social trust on the individual level have a positive effect on individual economic performance.2 While there is a broad consensus that social trust is crucial to economic growth, it still remains an open question whether other beliefs, attitudes, and social norms about economic life have a causal impact on economic performance.3 This chapter investigates this issue on both individual and nation-wide levels.
Figure 6.1 plots the annual average growth rates of TFP for the period 1993–2013 for a set of developed economies against an index of modernism that we design in the course of our work. It shows that there is a strong positive correlation between our measure of modernism and economic performance, TFP. Naturally, Figure 6.1 hardly constitutes a proof of causality. This chapter investigates to what extent the observed patterns survive the implementation of our empirical strategy, which is designed to address some of the obvious concerns about endogeneity and reversed causality.
As a first step, we consider individual-level data from a set of developed economies on beliefs, attitudes, and social norms about economic life, which come from the second wave of the WVS. Using these data, we design in Section 2 a very simple index of modernism and an index of traditionalism. Next, we relate the indexes of modernism and traditionalism to the annual average TFP growth rates and indigenous and imported innovation for our set of developed economies. The results confirm the observed pattern in Figure 6.1: we document a strong positive association between our index of modernism and our measures of productivity growth and innovation.
To address some of the obvious econometric concerns, we study how the country of origin of one’s ancestors affects the individual economic performance of first-, second-, third-, and fourth-generation Americans. In particular, we study how the country of origin affects the probability of becoming a successful entrepreneur, where a successful entrepreneur is defined as someone who has created a business that employs more than 10 individuals. Then, we use the estimated country effects as proxies for the index of modernism. The results show a positive correlation between the country effects and the index of modernism, as well as a positive relationship between the country effects and TFP growth, indigenous innovation, and imported innovation. To the extent to which we have addressed the most acute issues of reversed causality and endogeneity, we believe that our results provide the first evidence for a causal relation between economic performance, in particular economic innovation, and a broader set of beliefs, attitudes, and norms that reflect the economic culture of a country.
1. Literature Review
This chapter contributes to the related literature in two aspects. First, we attempt to relate the characteristics of an economy to individual attitudes and beliefs. Second, we focus on the conditions for innovation and the proclivity to innovate at the individual level. The difference was previously discussed in Chapter 2.
In the analysis of individual-level data, our work also relates closely to recent methodological advances in establishing a causal relation between social trust and individual outcomes. Since the path-breaking work of Banfield (1958), Coleman (1974), and Putnam (2000), trust, broadly defined as a cooperative attitude outside the family circle, has been considered by social scientists to be a key element of many economic and social outcomes.4 Studies of how immigrants’ attitudes evolve as a function of their country of origin and country of arrival shed an interesting light on the malleability of trust. They show that the beliefs and behaviors of immigrants are influenced by their countries of origin (Miguel and Jean, 2011).5
Individual beliefs and attitudes are not set in stone. The environment can modify them. But they are systematically characterized by the kind of inertia that can leave its mark on at least one and perhaps more generations. One of the most common strategies for establishing a causal relation between trust and culture more generally, on one hand, and economic performance, on the other, is to search for historical events that cause exogenous variations in trust that could be used as instruments. To rationalize the use of historical events, the literature draws on the theory of the transmission of values. Studies by Bisin and Verdier (2001); Guiso, Sapienza, and Zingales (2016); and Tabellini (2010) stress the role of two main forces.6 A portion of current values is shaped by the contemporaneous environment (horizontal transmission of values), and another portion is shaped by beliefs inherited from earlier generations (vertical transmission of values).
Algan and Cahuc (2010) propose to use this time variation in inherited trust in a standard growth equation.7 Since it is already well established that the parents’ social capital is a good predictor of the social capital of children, they use the trust that US descendants have inherited from their forebears who immigrated from different countries at different dates to detect changes in inherited trust in the countries of origin. They can get time-varying measures of trust inherited from the origin country and the destination country by running the same exercise for forebears who immigrated in other periods—for instance, between 1920 and 1950. With time-varying measures of inherited trust, they can estimate the impact of changes in inherited trust on changes in income per capita in the countries of origin. By providing a time-varying measure of trust over long periods, they can control for both omitted time-invariant factors and other observed time-varying factors, such as changes in the economic, political, cultural, and social environments.
2. Indexes of Modernism and Traditionalism
In this section, we describe our indexes of traditionalism and modernism, which have been discussed at greater length in Bojilov and Phelps (2013).8 Then, we briefly review the levels of traditionalism and modernism in different countries according to our two indexes. We construct an index of traditionalism for a set of developed OECD countries based on the second wave of the WVS, conducted between 1990 and 1993.9 The index is simply equal to the average of the proportion of people who respond in the affirmative to a set of questions. We give equal weight to each question because the limited size of the data does not allow us to derive factors and because assigning equal weight appears to us as good as any other arbitrary assignment of relative importance.
The first question that we include in the index is, “Do you think that service and help to others is important in life?” (a007). With it, we hope to determine the presence of a sense of duty and commitment to the larger community in which one lives. It is consistent with the teachings of all major religions and traditional philosophical schools. It also reflects a key feature in classical conservatism: individuals and the meaning of life within the web of bonds that a society represents.
We also incorporate the questions, “Should children respect and love their parents?” (a025) and, “Should parents be responsible for their children?” (a026). These two questions reflect the degree to which one individual is defined in the context of her or his relation with the rest of society. We like these questions because they call attention to fundamental issues about what modernity is in an unexpected context. Since the time of the late Roman Empire, social relations have often been explained to laymen through an easy-to-appreciate analogy: the monarch relates to his subjects as the head of the family relates to his children. What makes the analogy very powerful is the combination of a logical fallacy with the universal cultural preeminence of the paterfamilias from the Iron Age until the birth of modernity. The arrival of modernity, with its industrialization, wars, and changes in family and society, put all of these traditional roles and perceptions in question. Doubts about traditional roles in society and the family, as well as relativism and the conditionality of one’s relation to others, even within the family, are captured, we believe, through the negative response to questions a025 and a026.
Another way to interpret these questions is to explore the extent to which changes in the understanding of social order have affected the understanding of family relations and roles. Within a social context, the US Declaration of Independence was the first document to provide a very powerful rationale for overthrowing the old order: a government that has violated its obligations to its people has also forfeited any claim to the respect and the obedience of its people. This principle has been evoked innumerable times since. But to what extent has the same concept of contractual relations also entered the private sphere, family relations in particular? We hope that the responses to questions a025 and a026 shed some light on this question.
Finally, we also consider the question, “Is unselfishness an important child quality?” (a041). This question reflects the same concerns expressed earlier but in a more abstract context. Consciously or not, the importance of one’s own good has been a central feature of modernity. Individualism is central to classical liberalism, to the understanding of society in terms of contractual relations, and, we believe, to the meaning of modernity. The question, as stated, is provocative and may be misunderstood by the respondents. Yet we believe that the respondents had to confront the question of whether they would, as parents, ultimately prefer that their children give precedence in their actions to their communal duties or to their self-interest.
Is traditionalism good or bad? We do not perceive traditional values and concerns as obsolete or degenerate. A sense of community, social trust, and consideration for others are not necessarily bad things, and in many contexts, they may be crucial to economic development and prosperity, as noted already by many. One hypothesis is that if they are very strong, that may hamper individual initiative, the implementation of new technologies, or the adoption of new products. Alternatively, traditional values may create a sense of shared destiny when people undertake an economic venture, or they may build social capital. For a currently relevant example, many people have suggested that the traditional values of Confucianism are responsible for the strong work ethic of modern Chinese. We take no stand on the role of traditionalism: We are simply interested in statistically controlling for the effect of traditional values on economic development.
We also construct an index of modernism. This index, like the index of traditionalism, is equal to the average of the proportion of people who have answered in the affirmative to some questions contained in the second wave of the WVS. As in the case of traditionalism, the sample size does not allow us to extract factors, so from all arbitrary rules, we assume that each question has the same contribution to the index. We include a set of questions intended to capture the attitude of the respondents to change and its consequences. We hope that the response to the question, “Are you worried about new things?” (e045) reflects attitudes toward the process that generates new products, technologies, techniques, morals, and so on. That is, we hope that it reflects the respondent’s degree of self-confidence when facing the rapidly changing world of modernity. The question, “Do you accept new ideas?” (e046) is supposed to shed light on another aspect of the same phenomenon: respondents may be worried about new things but regard them as necessary evils or as unpleasant phenomena that one must nevertheless accept as an inevitable part of modern life. Finally, the question, “Do you think that changes bring new opportunities?” (e047) reflects the extent to which respondents associate new developments with new opportunities to be explored and exploited. An individual may dislike the uncertainty associated with the lottery that modern life is, may accept it as inevitable but believe that the lottery itself provides an exciting set of opportunities, or may regard it as an inevitable evil.
In addition, we also include some questions that are designed to determine respondents’ views on the consequence of change in a modern world. We hope that attitudes toward inequality and fairness are central to respondents’ answers to the question, “Two secretaries differ in their productivity. Is it fair to pay more to the more productive one?” (c059). That is, the question is whether fairness is to be understood as identical titles implying identical pay or different productivities implying different pay. Phenomena associated with modernity have continuously challenged traditional institutions, and this has led to a corporatist reaction against some of the evils of modern life. The question of the governance of businesses has been central to the ensuing debate: Should owners have control over the management of their firms, or should they consult with other parties involved in the production process, such as workers and government regulators? We hope to capture at least some of these issues with the question, “Do you agree that the owners ought to manage their firms?” (c060). Finally, we also include in our index the question, “Do you agree that competition is good?” (e039), which exposes individual attitudes toward another defining feature of modern economic life. Respondents with a more corporatist or traditionalist view would exhibit skepticism about the virtues of competition. Indeed, related schools of thought point out that competition often may undercut social welfare as a result of the displacement of people and the destruction of long-standing social contexts and communities. There are alternative views as well: competition may destroy the old but simultaneously free people to achieve their true potential and ensure that they do good by doing well, through the action of the proverbial invisible hand.
|
Table 6.1. Indexes of modernism and traditionalism |
||||
|
Country |
Modernism |
Traditionalism |
||
|
Austria |
0.60 |
0.57 |
||
|
Belgium |
0.54 |
0.40 |
||
|
Canada |
0.66 |
0.50 |
||
|
Denmark |
0.62 |
0.50 |
||
|
Finland |
0.61 |
0.52 |
||
|
France |
0.52 |
0.51 |
||
|
Germany |
0.59 |
0.56 |
||
|
Ireland |
0.63 |
0.61 |
||
|
Italy |
0.58 |
0.53 |
||
|
Japan |
0.47 |
0.61 |
||
|
Netherlands |
0.62 |
0.57 |
||
|
Norway |
0.57 |
0.55 |
||
|
Portugal |
0.56 |
0.86 |
||
|
Spain |
0.52 |
0.70 |
||
|
Sweden |
0.58 |
0.65 |
||
|
UK |
0.58 |
0.47 |
||
|
US |
0.62 |
0.37 |
||
|
Data source: Bojilov and Phelps (2013). |
||||
We report the two indexes by country in Table 6.1. The average across countries on the index of modernism is 0.58. The countries with the highest values are the US, Denmark, Ireland, and Canada, at 0.62, 0.62, 0.63, and 0.66, respectively, while the countries with the lowest values are Japan, Spain, and France, at 0.47, 0.52, and 0.52, respectively. Eyeballing the numbers reported in the table, one notices that the Scandinavian and Anglo-Saxon, or more generally northern European countries, have high levels of modernism according to the index. The picture in the South of Europe is, however, much more complex. Their average level of modernism is low relative to the North, but Italy’s level is equal to that of the UK and almost the same as that in Germany and Denmark. How can one, then, possibly try to explain the divergence in the economic performance of Italy and the North? Perhaps, the index of traditionalism can suggest a possible explanation.
The average level of traditionalism according to the index is 0.51. The three countries with the highest levels of traditionalism are Portugal, Spain, and Sweden, at 0.86, 0.70, and 0.65, respectively. The three countries with the lowest levels of traditionalism are the US, Belgium, and the UK, at 0.37, 0.40, and 0.47, respectively. The level of the US is just below that of Denmark and Canada. As is the case for modernism, there seems to be a tentative division in Europe between a less traditionalist North and a more traditionalist South. Going back to the case of Italy, we see that traditionalism is relatively high at 0.53.
We find a strong negative correlation of 0.58 between the index of modernism and the index of traditionalism. This finding conforms to our expectation that an increase in modernism is associated with a decrease in traditionalism. However, we have not imposed such a relation on the data through some theoretical restriction when designing the indexes. Thus, the negative correlation is reassuring in the sense that it coincides with our preconceptions based on previous studies in economics and in other social sciences.
3. TFP, Indigenous Innovation, and Imported Innovation
To obtain our aggregate measures of innovation in this chapter, we reestimate our model from Chapter 2 but using only TFP data from the Penn World Tables covering the period from 1950 to 2013. The results that we obtain in this new specification are consistent with those reported in Chapter 2 on the post-WWII period. The reason why we do this exercise is that we can extend the set of countries that we study to the following 17 developed countries: Austria, Belgium, Canada, Denmark, Finland, France, Germany, Ireland, Italy, Japan, the Netherlands, Norway, Portugal, Spain, Sweden, the United Kingdom, and the United States.
The methodology that we use to decompose the TFP growth series into indigenous and imported innovation is discussed at length in Chapter 2. Here, we briefly review the average annual rates of the raw TFP series and indigenous and imported innovation for the period 1993–2013, the two decades after the second wave of the WVS.
Table 6.2 focuses on recent trends in indigenous and imported innovation. It reveals that the US, along with Sweden, is still the country with the highest rate of indigenous innovation, followed by Canada and the UK. Interestingly, while the rate of US indigenous innovation in the last two decades is higher than it was in the 1970s and the 1980s, it is still lower than its counterpart for the period before 1972. Similarly, the UK experienced a partial recovery in its rate of indigenous innovation. At the same time, the rates of indigenous and imported innovation in continental Europe ground to a complete halt in the years following 1990.
|
Table 6.2. Estimates of cumulative indigenous and cumulative imported innovation for 1993–2013 |
||||||||
|
Country |
Indigenous |
Imported |
|
ΔTFP |
||||
|
Austria |
0.29 |
0.28 |
0.57 |
0.42 |
||||
|
Belgium |
0.06 |
0.11 |
0.17 |
0.04 |
||||
|
Canada |
0.44 |
0.14 |
0.58 |
0.36 |
||||
|
Denmark |
0.31 |
0.23 |
0.54 |
0.61 |
||||
|
Finland |
0.31 |
0.38 |
0.69 |
0.86 |
||||
|
France |
0.07 |
0.05 |
0.12 |
0.03 |
||||
|
Germany |
0.11 |
0.05 |
0.16 |
0.03 |
||||
|
Ireland |
0.23 |
0.38 |
0.61 |
0.61 |
||||
|
Italy |
0.01 |
0.03 |
0.04 |
0.05 |
||||
|
Japan |
0.03 |
0.03 |
0.07 |
0.03 |
||||
|
Netherlands |
0.27 |
0.24 |
0.51 |
0.41 |
||||
|
Norway |
0.06 |
0.24 |
0.3 |
0.17 |
||||
|
Portugal |
0.26 |
0.03 |
0.29 |
0.2 |
||||
|
Spain |
0.11 |
0.14 |
0.25 |
0.08 |
||||
|
Sweden |
0.65 |
0.31 |
0.96 |
0.97 |
||||
|
UK |
0.32 |
0.22 |
0.55 |
0.63 |
||||
|
US |
0.65 |
0.28 |
0.94 |
0.97 |
||||
|
Notes: The first column reports predicted indigenous innovation, while the second reports the contribution of predicted imported innovation to TFP growth. The third column presents the sum of the first two, and the last one presents the actual TFP series. |
||||||||
4. Innovation and Inherited Beliefs
We postulate that indigenous innovation Yct in a country c for generation t (25 years) is a function of the index of modernism Mct , controls Xct , and fixed effects for time and country:

The index of modernism itself is a function of inherited modernism, controls, and fixed effects:

There are two major econometric concerns in this context. The first one is that Mct−1 is not observed before 1980s. Thus, we use as a proxy for inherited modernism the time-invariant effect of the country of origin of one’s ancestors that is obtained in a panel data probit model of the likelihood of becoming an entrepreneur in the US. The second concern is that inherited modernism and economic performance may be codetermined by a common factor. For this reason, we consider second-, third-, and fourth-generation Americans born between 1945 and 1970 and focus on economic performance after 1990. The ancestors of these Americans moved to the US in the interwar years, before WWI, or in the 19th century. Thus, it is less likely that there is a common factor that affects both innovation at the time of the IT revolution and the inherited beliefs that were formed more than 70 years ago.
|
Table 6.3. Estimated country effects on the probability of becoming an entrepreneur and on having high income |
||||||||
|
Country |
Entrepreneur, large |
High income |
||||||
|
Coef. |
z |
Coef. |
z |
|||||
|
Austria |
0.019 |
0.09 |
0.115 |
0.98 |
||||
|
Canada |
0.360 |
2.25 |
0.009 |
0.08 |
||||
|
China |
0.055 |
0.15 |
0.139 |
0.64 |
||||
|
Denmark |
0.633 |
2.37 |
0.044 |
0.46 |
||||
|
Finland |
0.190 |
3.73 |
0.087 |
0.72 |
||||
|
France |
0.187 |
1.92 |
0.014 |
0.22 |
||||
|
Germany |
0.153 |
2.31 |
0.042 |
1.61 |
||||
|
Ireland |
0.081 |
−1.41 |
0.097 |
3.32 |
||||
|
Italy |
0.050 |
0.64 |
0.046 |
1.11 |
||||
|
Japan |
0.490 |
1.91 |
0.512 |
2.86 |
||||
|
Mexico |
0.024 |
0.19 |
0.002 |
0.04 |
||||
|
Norway |
0.537 |
1.45 |
0.143 |
2.30 |
||||
|
Spain |
0.103 |
−3.49 |
0.057 |
0.58 |
||||
|
Sweden |
0.795 |
2.70 |
0.193 |
3.04 |
||||
|
UK |
0.312 |
2.60 |
0.158 |
5.51 |
||||
|
US (4th gen) |
0.682 |
2.01 |
0.274 |
15.34 |
||||
|
Note: The data come from the estimates reported in this chapter. |
||||||||
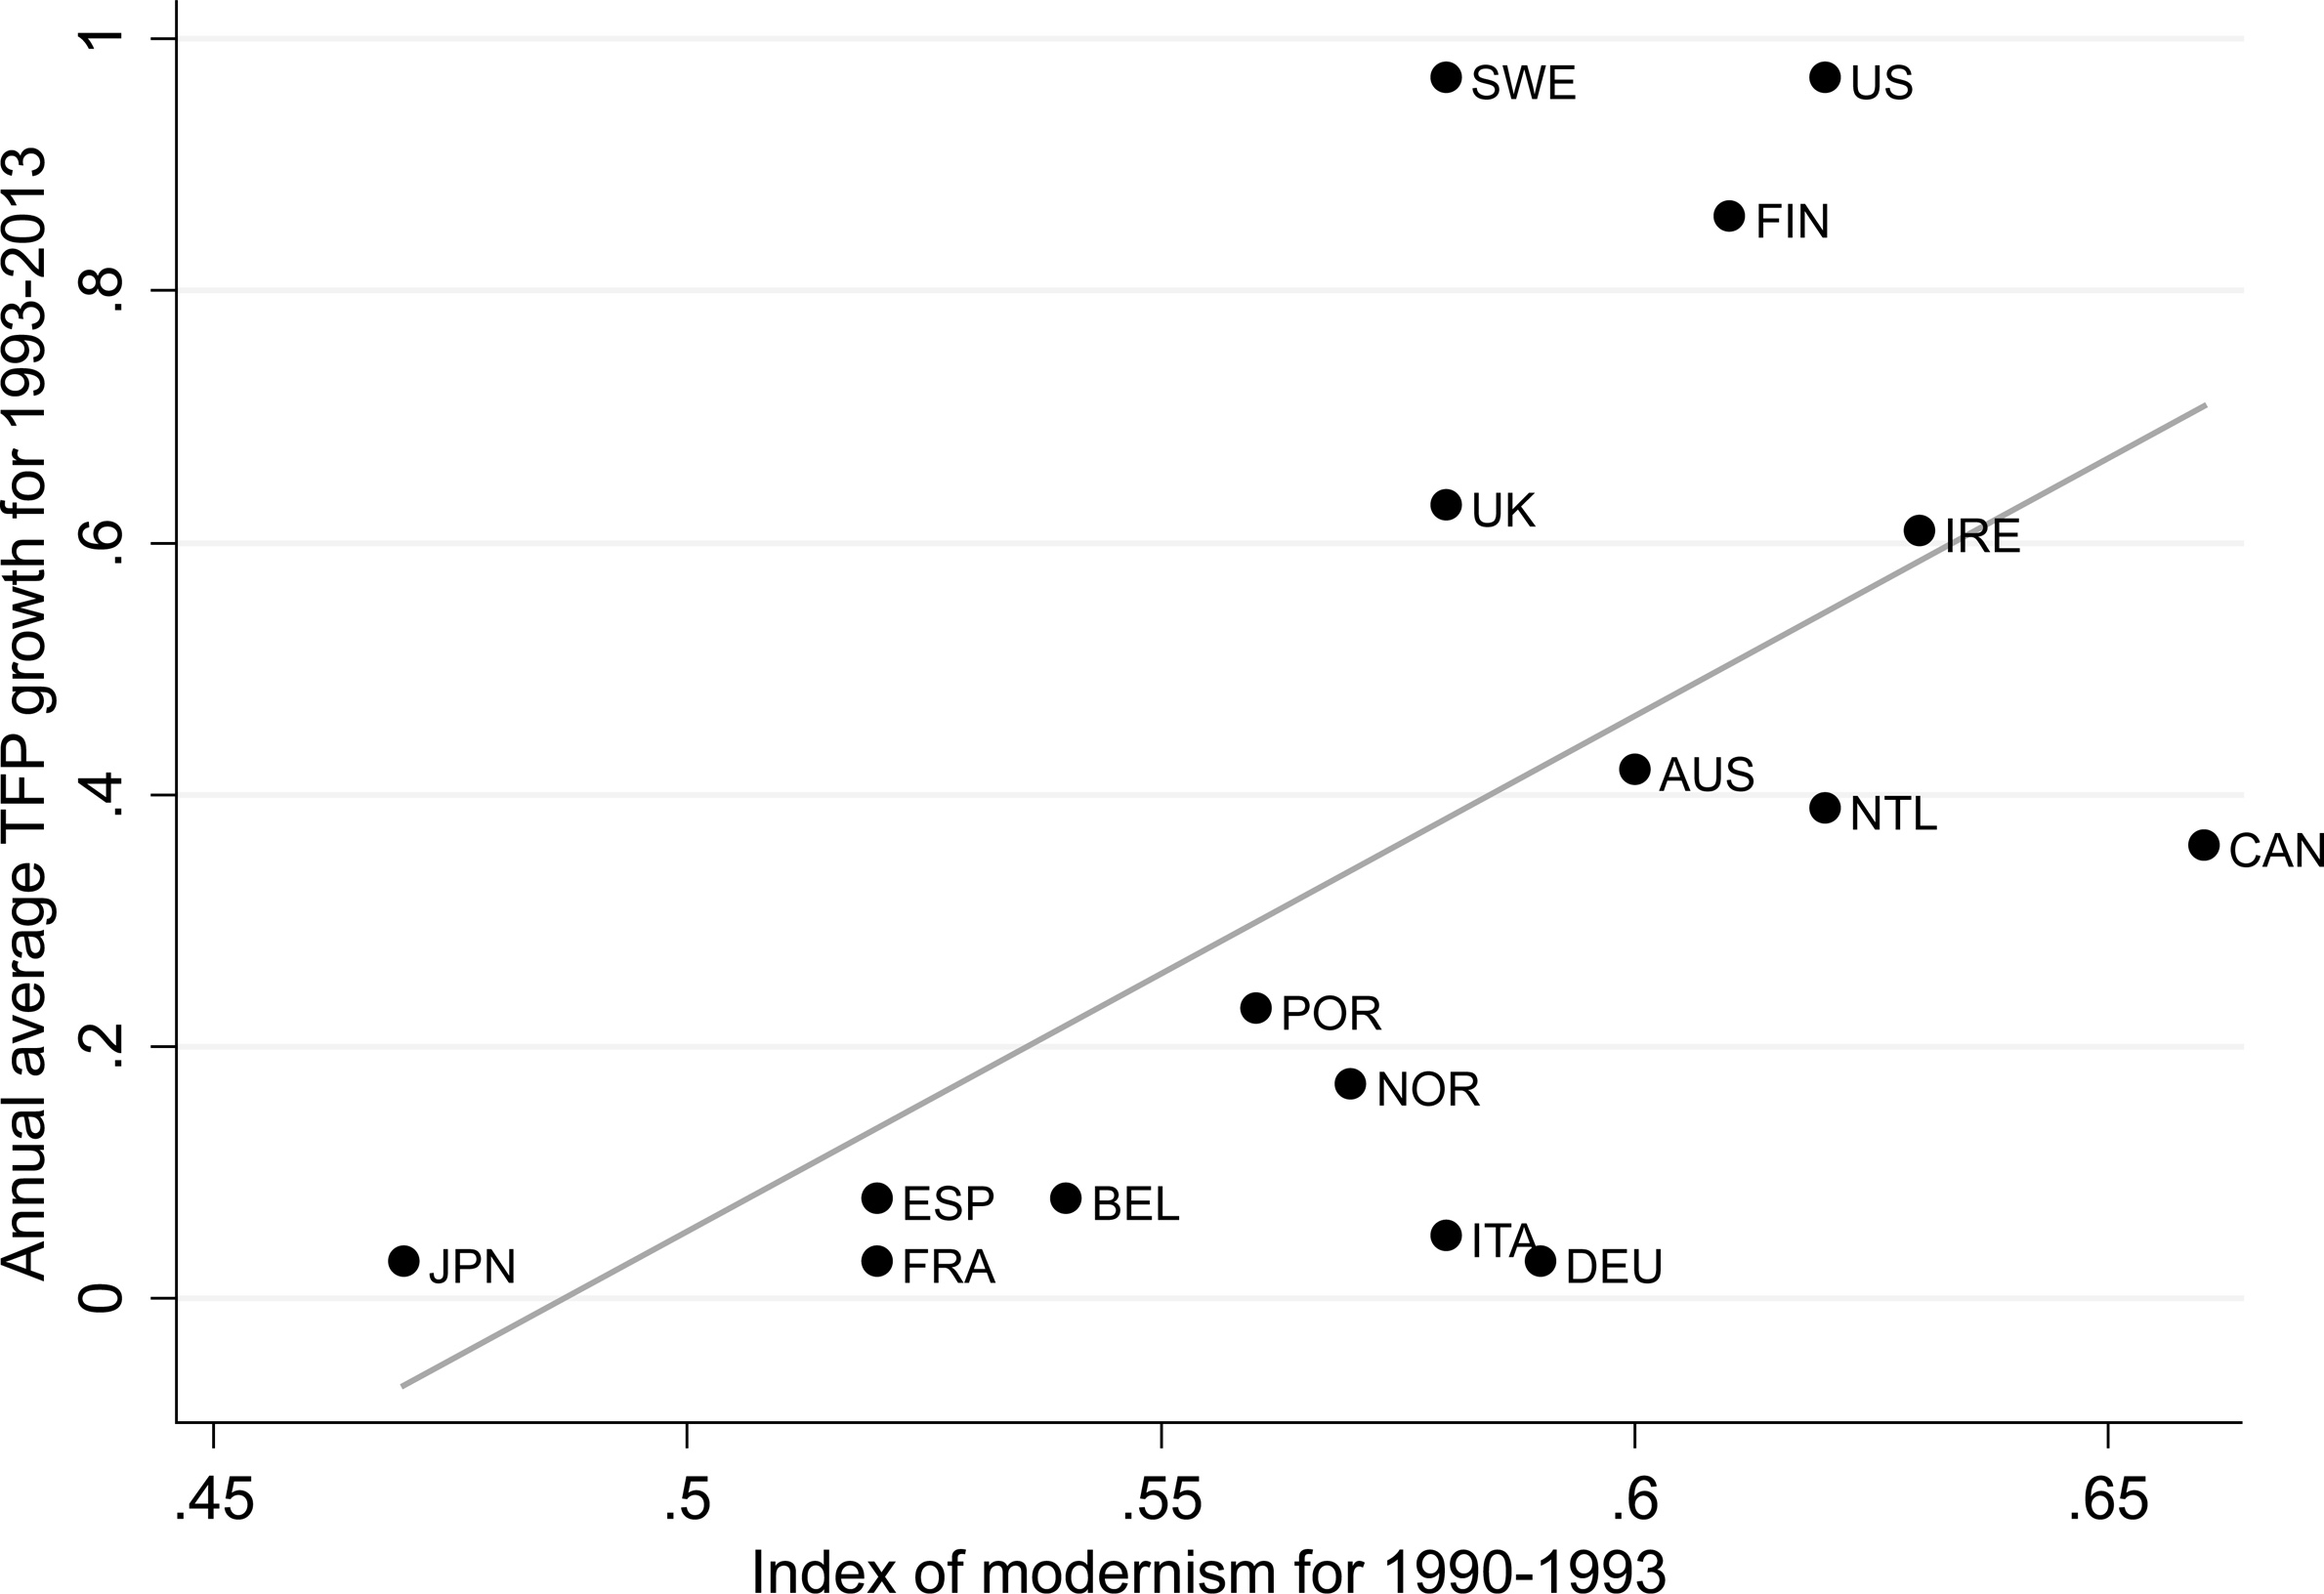
Figure 6.1. Relation between the index of modernism, 1990–1993, and the annual average TFP growth for 1993–2013. Notes: The data come from the estimates reported in this chapter. The sample includes the following countries: Austria (AUS), Belgium (BEL), Canada (CAN), Denmark (DEN), Finland (FIN), France (FRA), Germany (DEU), Ireland (IRE), Italy (ITA), Japan (JPN), the Netherlands (NTL), Norway (NOR), Portugal (POR), Spain (ESP), Sweden (SWE), the United Kingdom (UK), and the United States (US). The observations for Denmark and Ireland are very similar, so the observation for Denmark is omitted from the plot for presentational clarity.
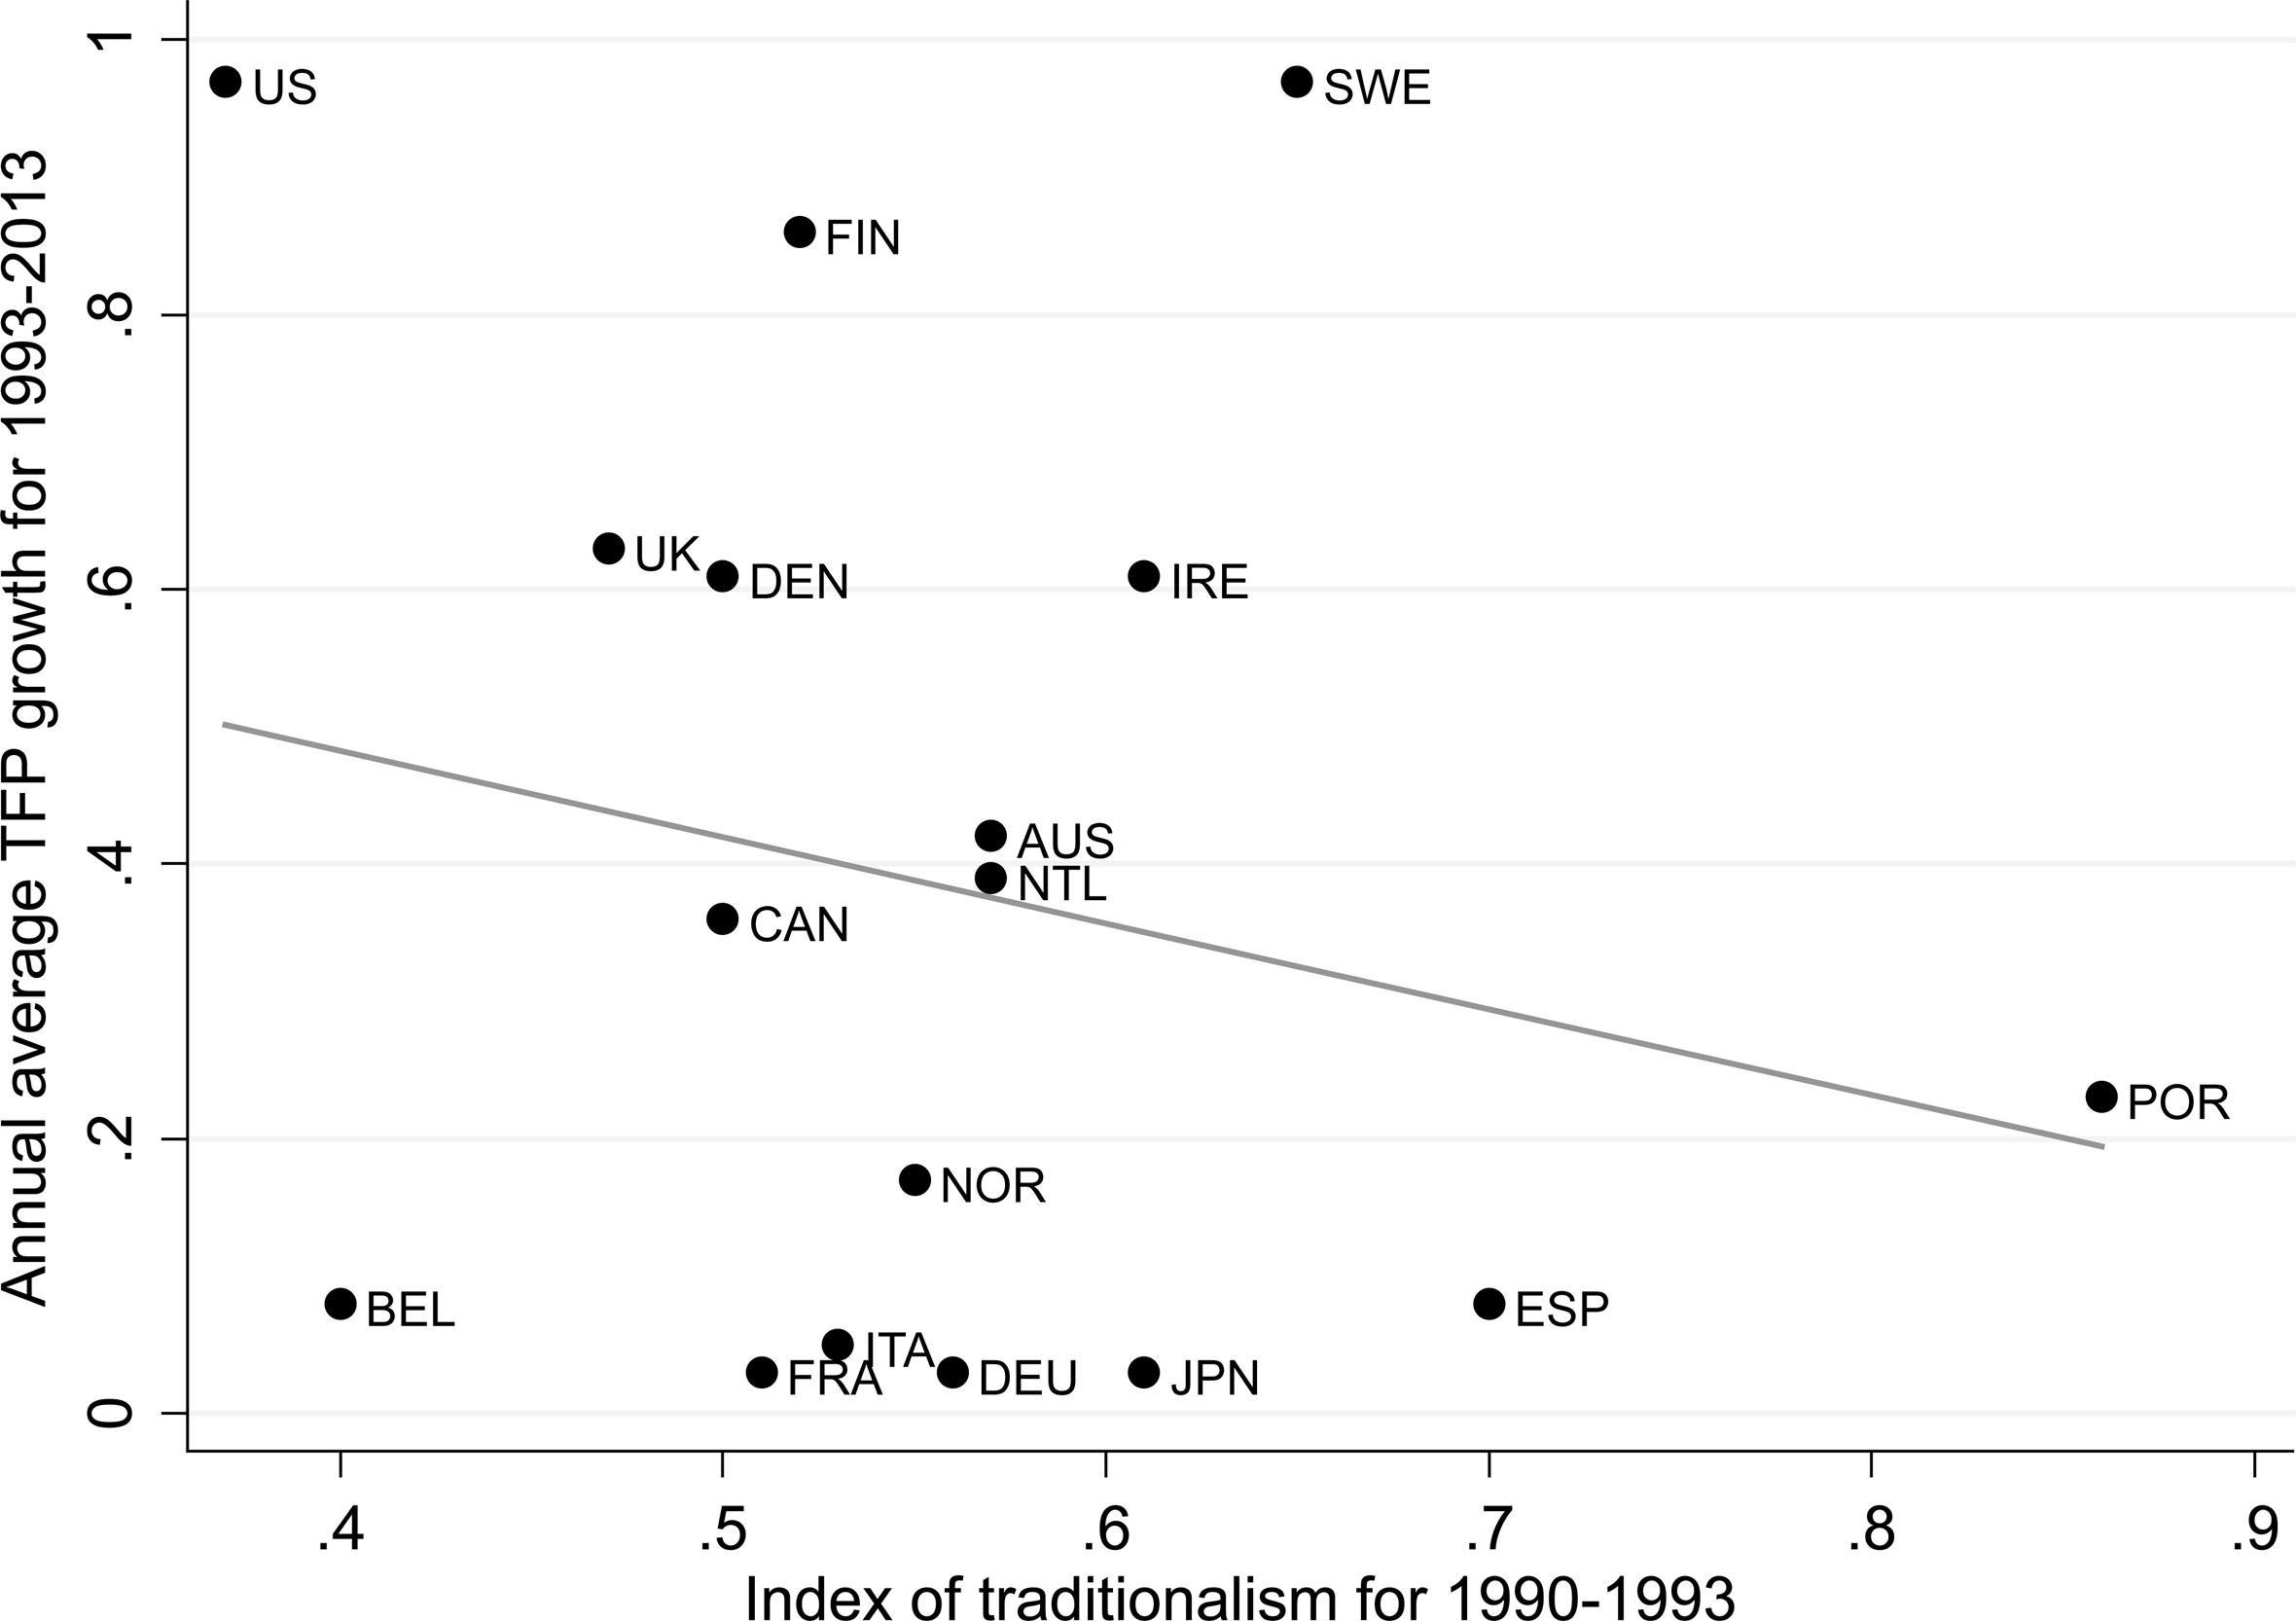
Figure 6.2. Relation between the index of traditionalism, 1990–1993, and the annual average TFP growth for 1993–2013. Notes: The data come from the estimates reported in this chapter. The sample includes the following countries: Austria (AUS), Belgium (BEL), Canada (CAN), Denmark (DEN), Finland (FIN), France (FRA), Germany (DEU), Ireland (IRE), Italy (ITA), Japan (JPN), the Netherlands (NTL), Norway (NOR), Portugal (POR), Spain (ESP), Sweden (SWE), the United Kingdom (UK), and the United States (US).
This strategy can address some of the identification issues discussed. First, by using the beliefs of US immigrants inherited from the home country instead of the average trust of the current residents of the country, we can exclude reverse causality. We believe that it is very plausible that beliefs in the country of origin of one’s ancestors have evolved according to what happened in that country rather than what happened in the US. Similarly, the evolution of beliefs and attitudes of the descendants of US immigrants is only affected by shocks to the US economy. Moreover, this framework implies that our direct measure of inherited beliefs may play the role of an instrument for culture.
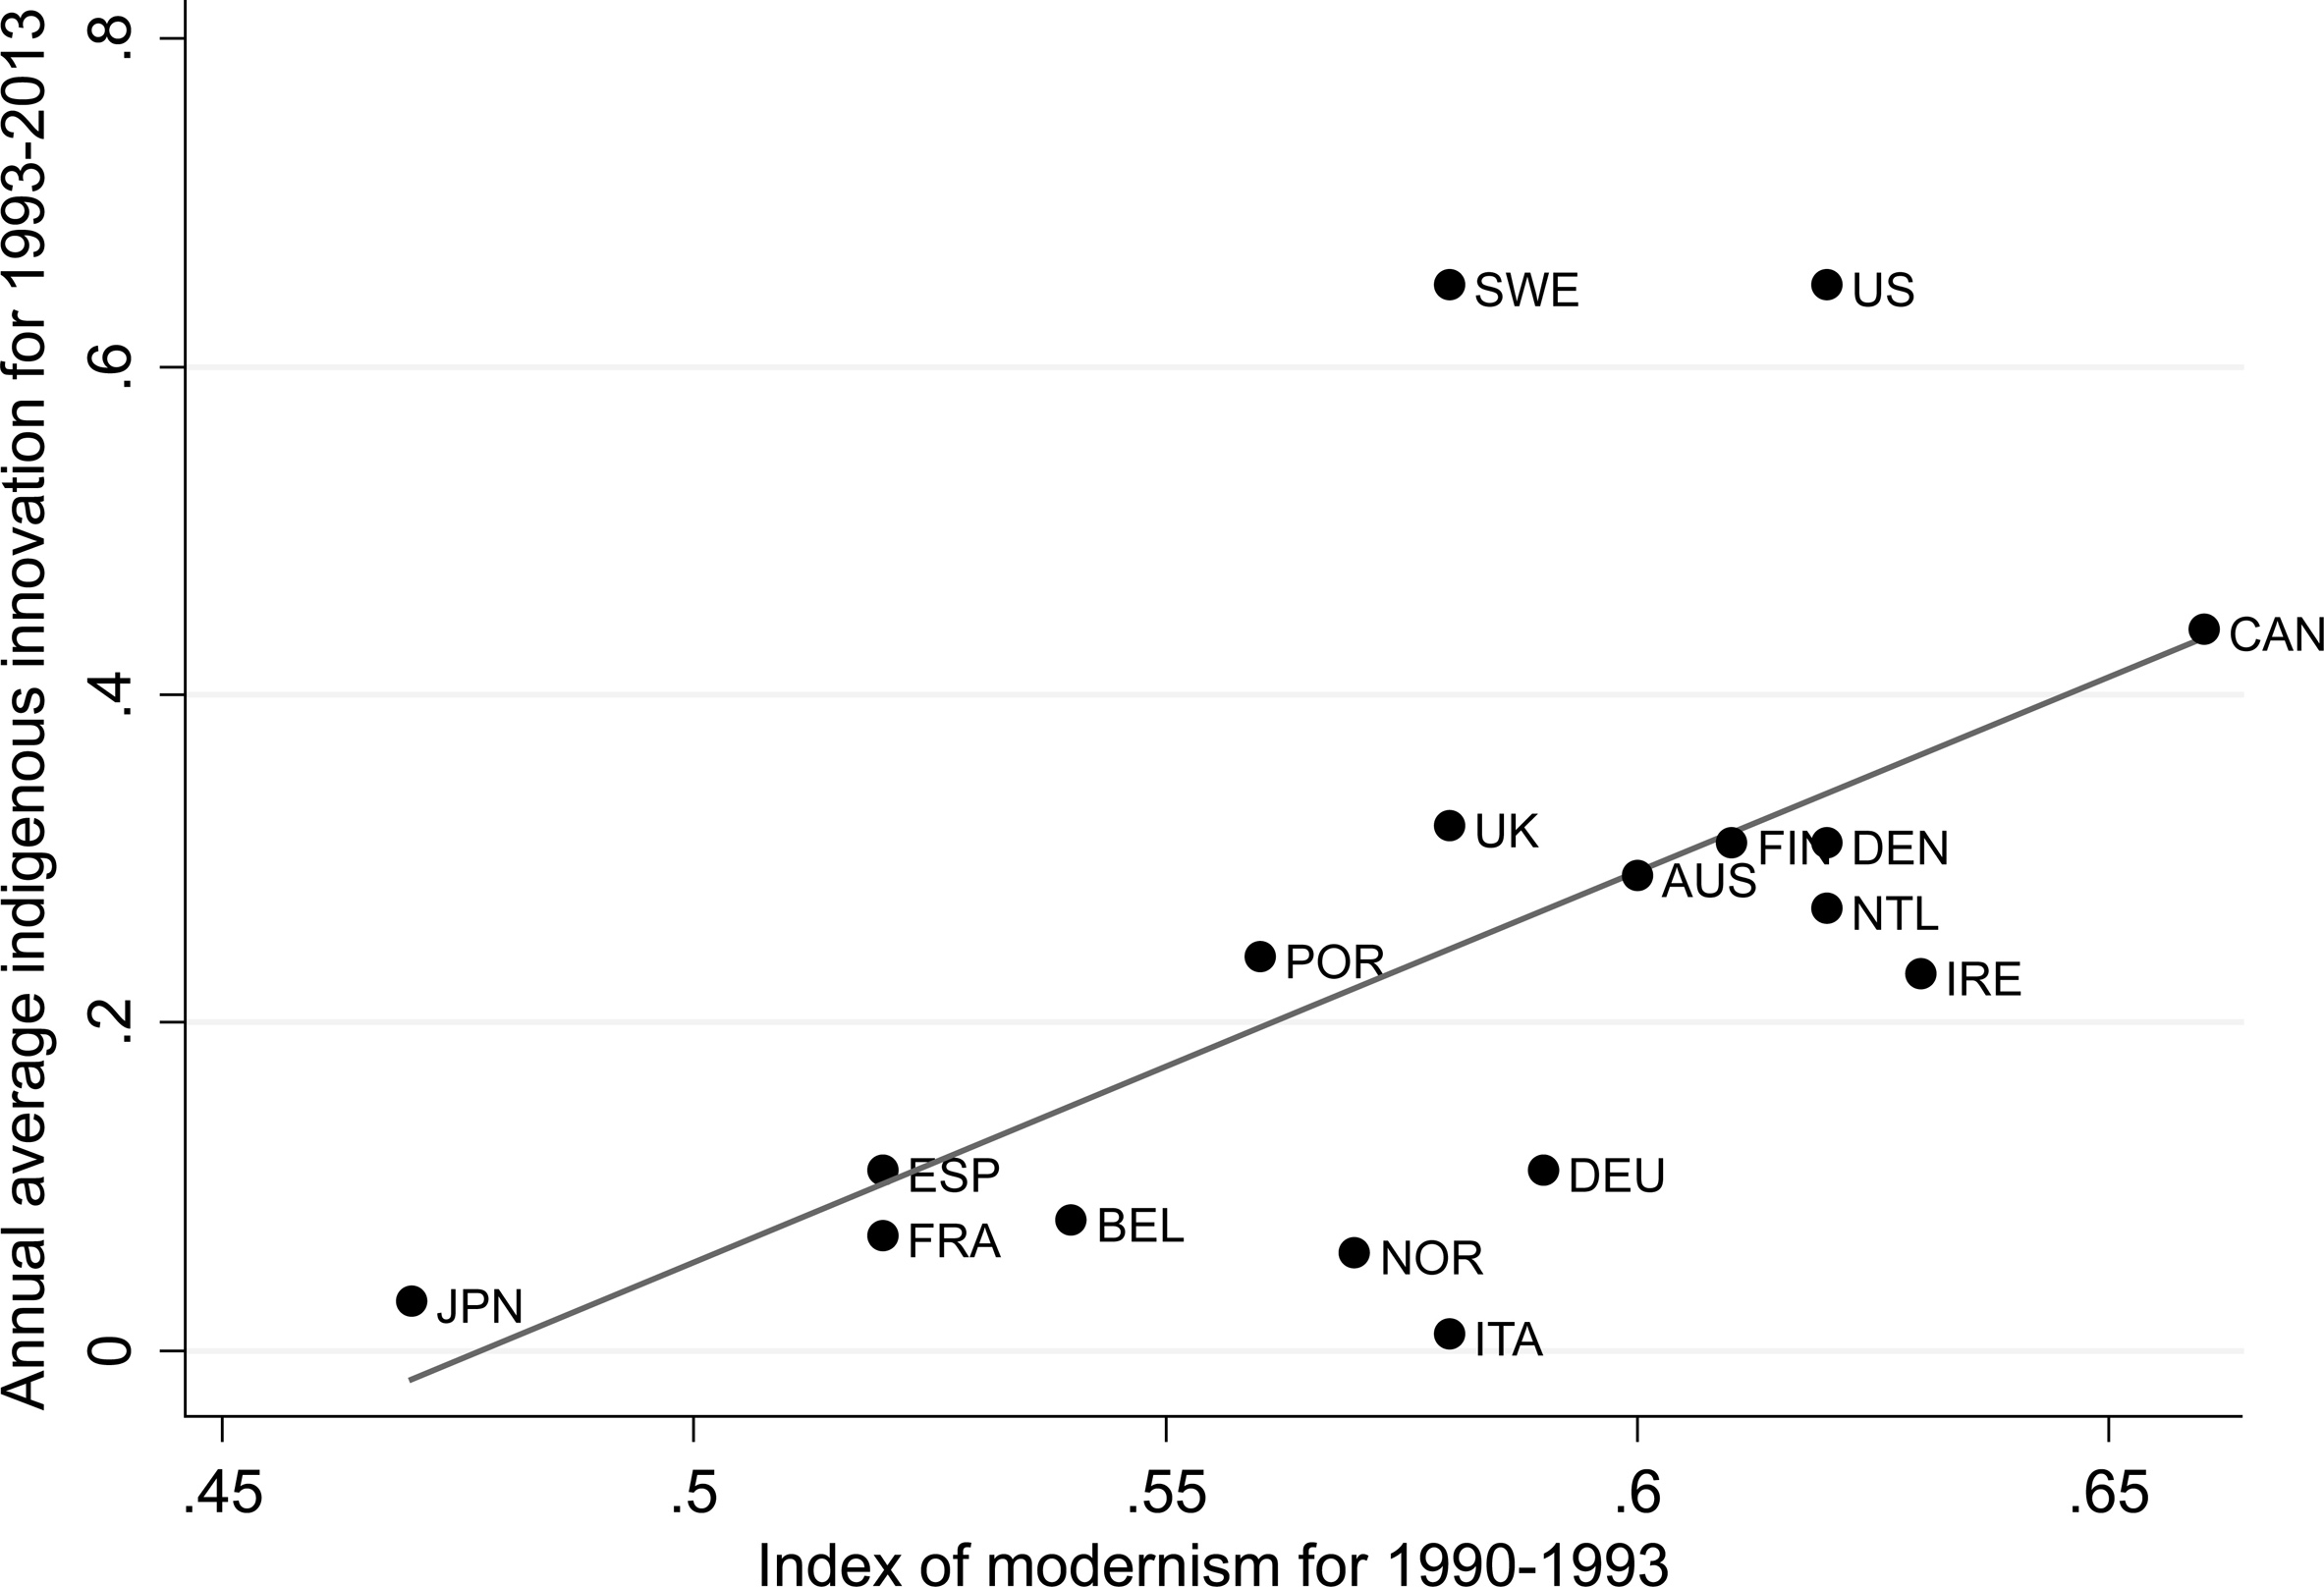
Figure 6.3. Relation between the index of modernism, 1990–1993, and the annual indigenous innovation for 1993–2013. Notes: The data come from the estimates reported in this chapter. The sample includes the following countries: Austria (AUS), Belgium (BEL), Canada (CAN), Denmark (DEN), Finland (FIN), France (FRA), Germany (DEU), Ireland (IRE), Italy (ITA), Japan (JPN), the Netherlands (NTL), Norway (NOR), Portugal (POR), Spain (ESP), Sweden (SWE), the United Kingdom (UK), and the United States (US).
We estimate the inherited beliefs by US immigrants from their home countries by using data from the GSS. Inherited beliefs are measured as the country of origin fixed effect in an individual-level probit regression for the likelihood of creating a company that employs more than 10 workers and the probability of having a high income at the time of the GSS interview, controlling for individual characteristics at the time of birth. We focus on inherited trust from before 1945 for the generation born between 1945 and 1970. Our analysis considers two individual outcomes at the time of the GSS interview: the probability of being a self-employed manager of a company that employs at least 10 individuals and the probability of having a high income. To limit any concerns about reversed causality or endogeneity, we include as explanatory variables only characteristics available at the time of birth of the interviewee, such as educational attainment of parents, their occupations, their religion, the number of siblings one has, and the country of origin of one’s ancestors.
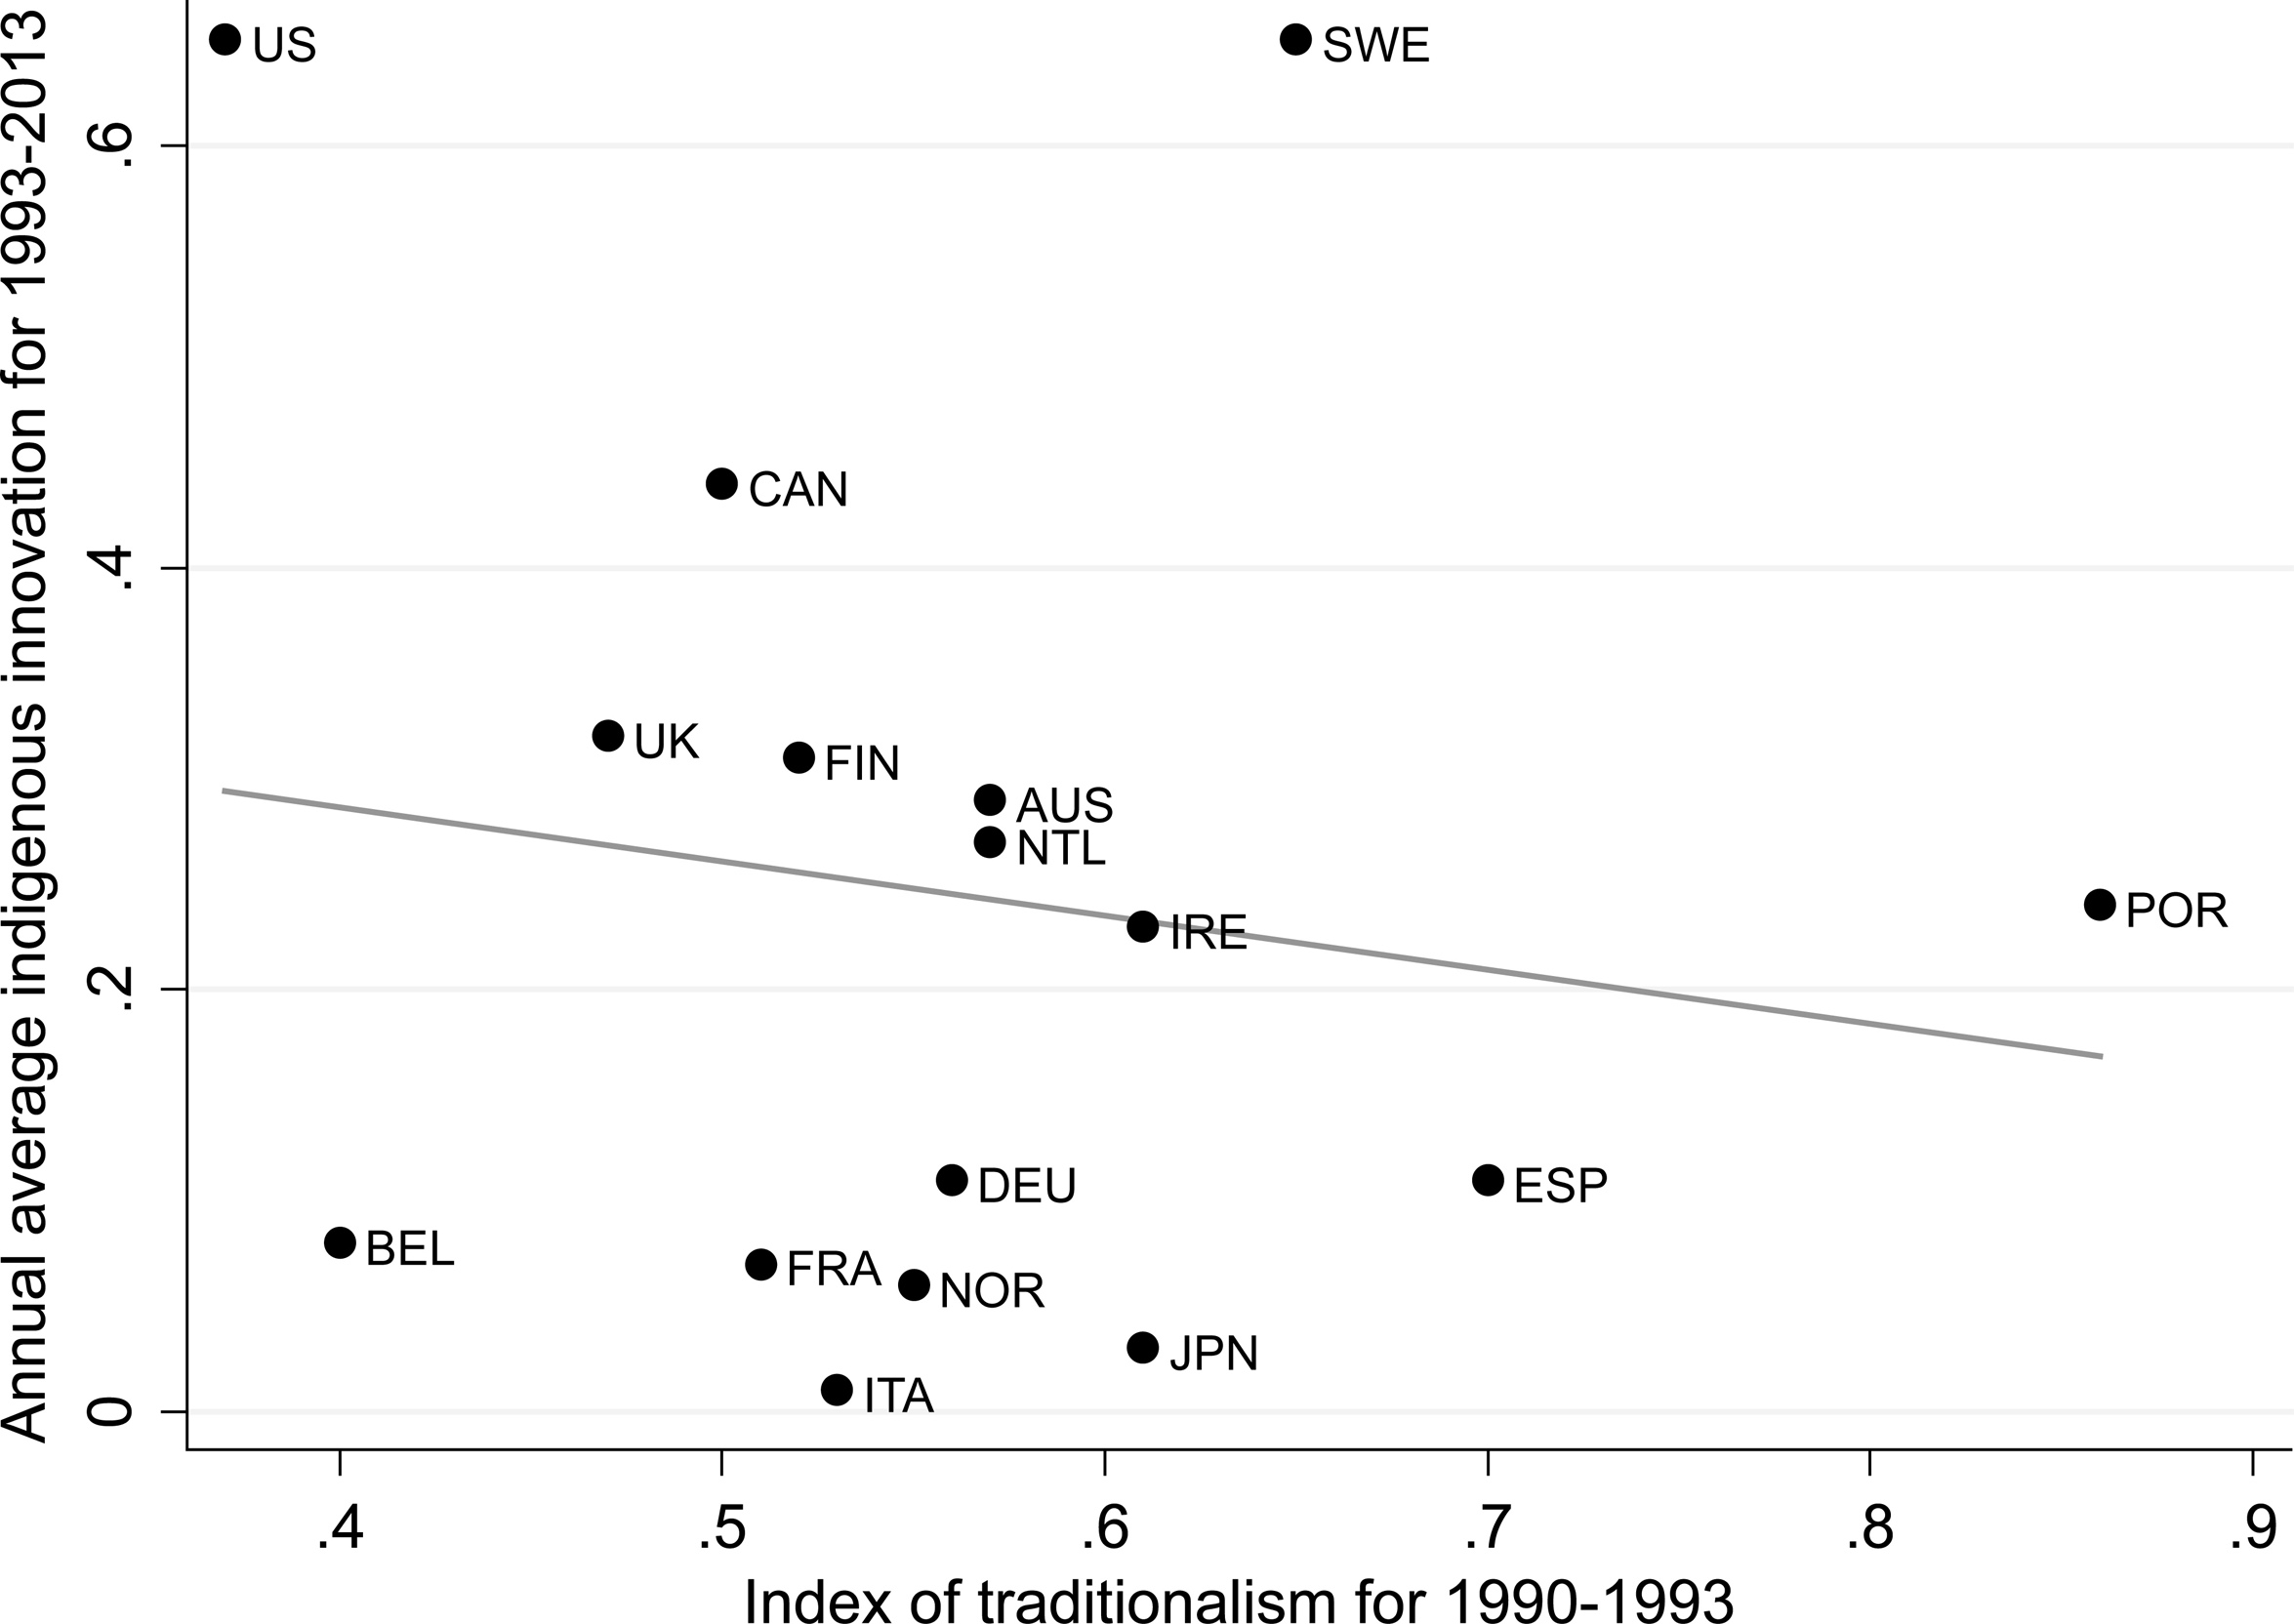
Figure 6.4. Relation between the index of traditionalism, 1990–1993, and the annual indigenous innovation for 1993–2013. Notes: The data come from the estimates reported in this chapter. The sample includes the following countries: Austria (AUS), Belgium (BEL), Canada (CAN), Denmark (DEN), Finland (FIN), France (FRA), Germany (DEU), Ireland (IRE), Italy (ITA), Japan (JPN), the Netherlands (NTL), Norway (NOR), Portugal (POR), Spain (ESP), Sweden (SWE), the United Kingdom (UK), and the United States (US). The observations for Denmark and Finland are very similar, so the observation for Denmark is omitted from the plot for presentational clarity.
The results are reported in Table 6.3. The following discussion of the empirical results focuses on the object of interest in our analysis: the country effects in the regression. The reference category in our regressions is country of origin in Eastern Europe or Poland. We find that relative to Eastern Europe and Poland, having ancestors from Austria, China, and Mexico has a very similar impact on the probability of being an entrepreneur who hires more than 10 workers. The only country of origin that has greater negative impact on the entrepreneurial activity of future generations of Americans is Spain. The three countries of origin with the highest positive impact on the entrepreneurial activity of future American generations are the UK, Denmark, and Sweden. The coefficients for Japan and Norway are also highly positive, but they are not estimated precisely, possibly because of the small number of descendants from these countries. In our regressions, we also include a US dummy that stands for individuals whose ancestors have lived for at least four generations in the US. It is positive and highly significant.

Figure 6.5. Relation between the index of modernism, 1990–1993, and the annual imported innovation for 1993–2013. Notes: The data come from the estimates reported in this chapter. The sample includes the following countries: Austria (AUS), Belgium (BEL), Canada (CAN), Denmark (DEN), Finland (FIN), France (FRA), Germany (DEU), Ireland (IRE), Italy (ITA), Japan (JPN), the Netherlands (NTL), Norway (NOR), Portugal (POR), Spain (ESP), Sweden (SWE), the United Kingdom (UK), and the United States (US).
Our second specification involves the estimation of the probability of having a high income at the time of GSS interview, conditional, again, on information available at the time of birth. As before, we consider a probit estimation framework. The results show that individuals with ancestors from Austria, Canada, China, Denmark, Finland, France, and Mexico are as likely to have a high income as individuals with Eastern European ancestors. The coefficients for Germany and Italy are positive, but not significant. The only countries that stand out as having a positive impact on the income prospects of future Americans are the US itself, the UK, Sweden, and Japan.
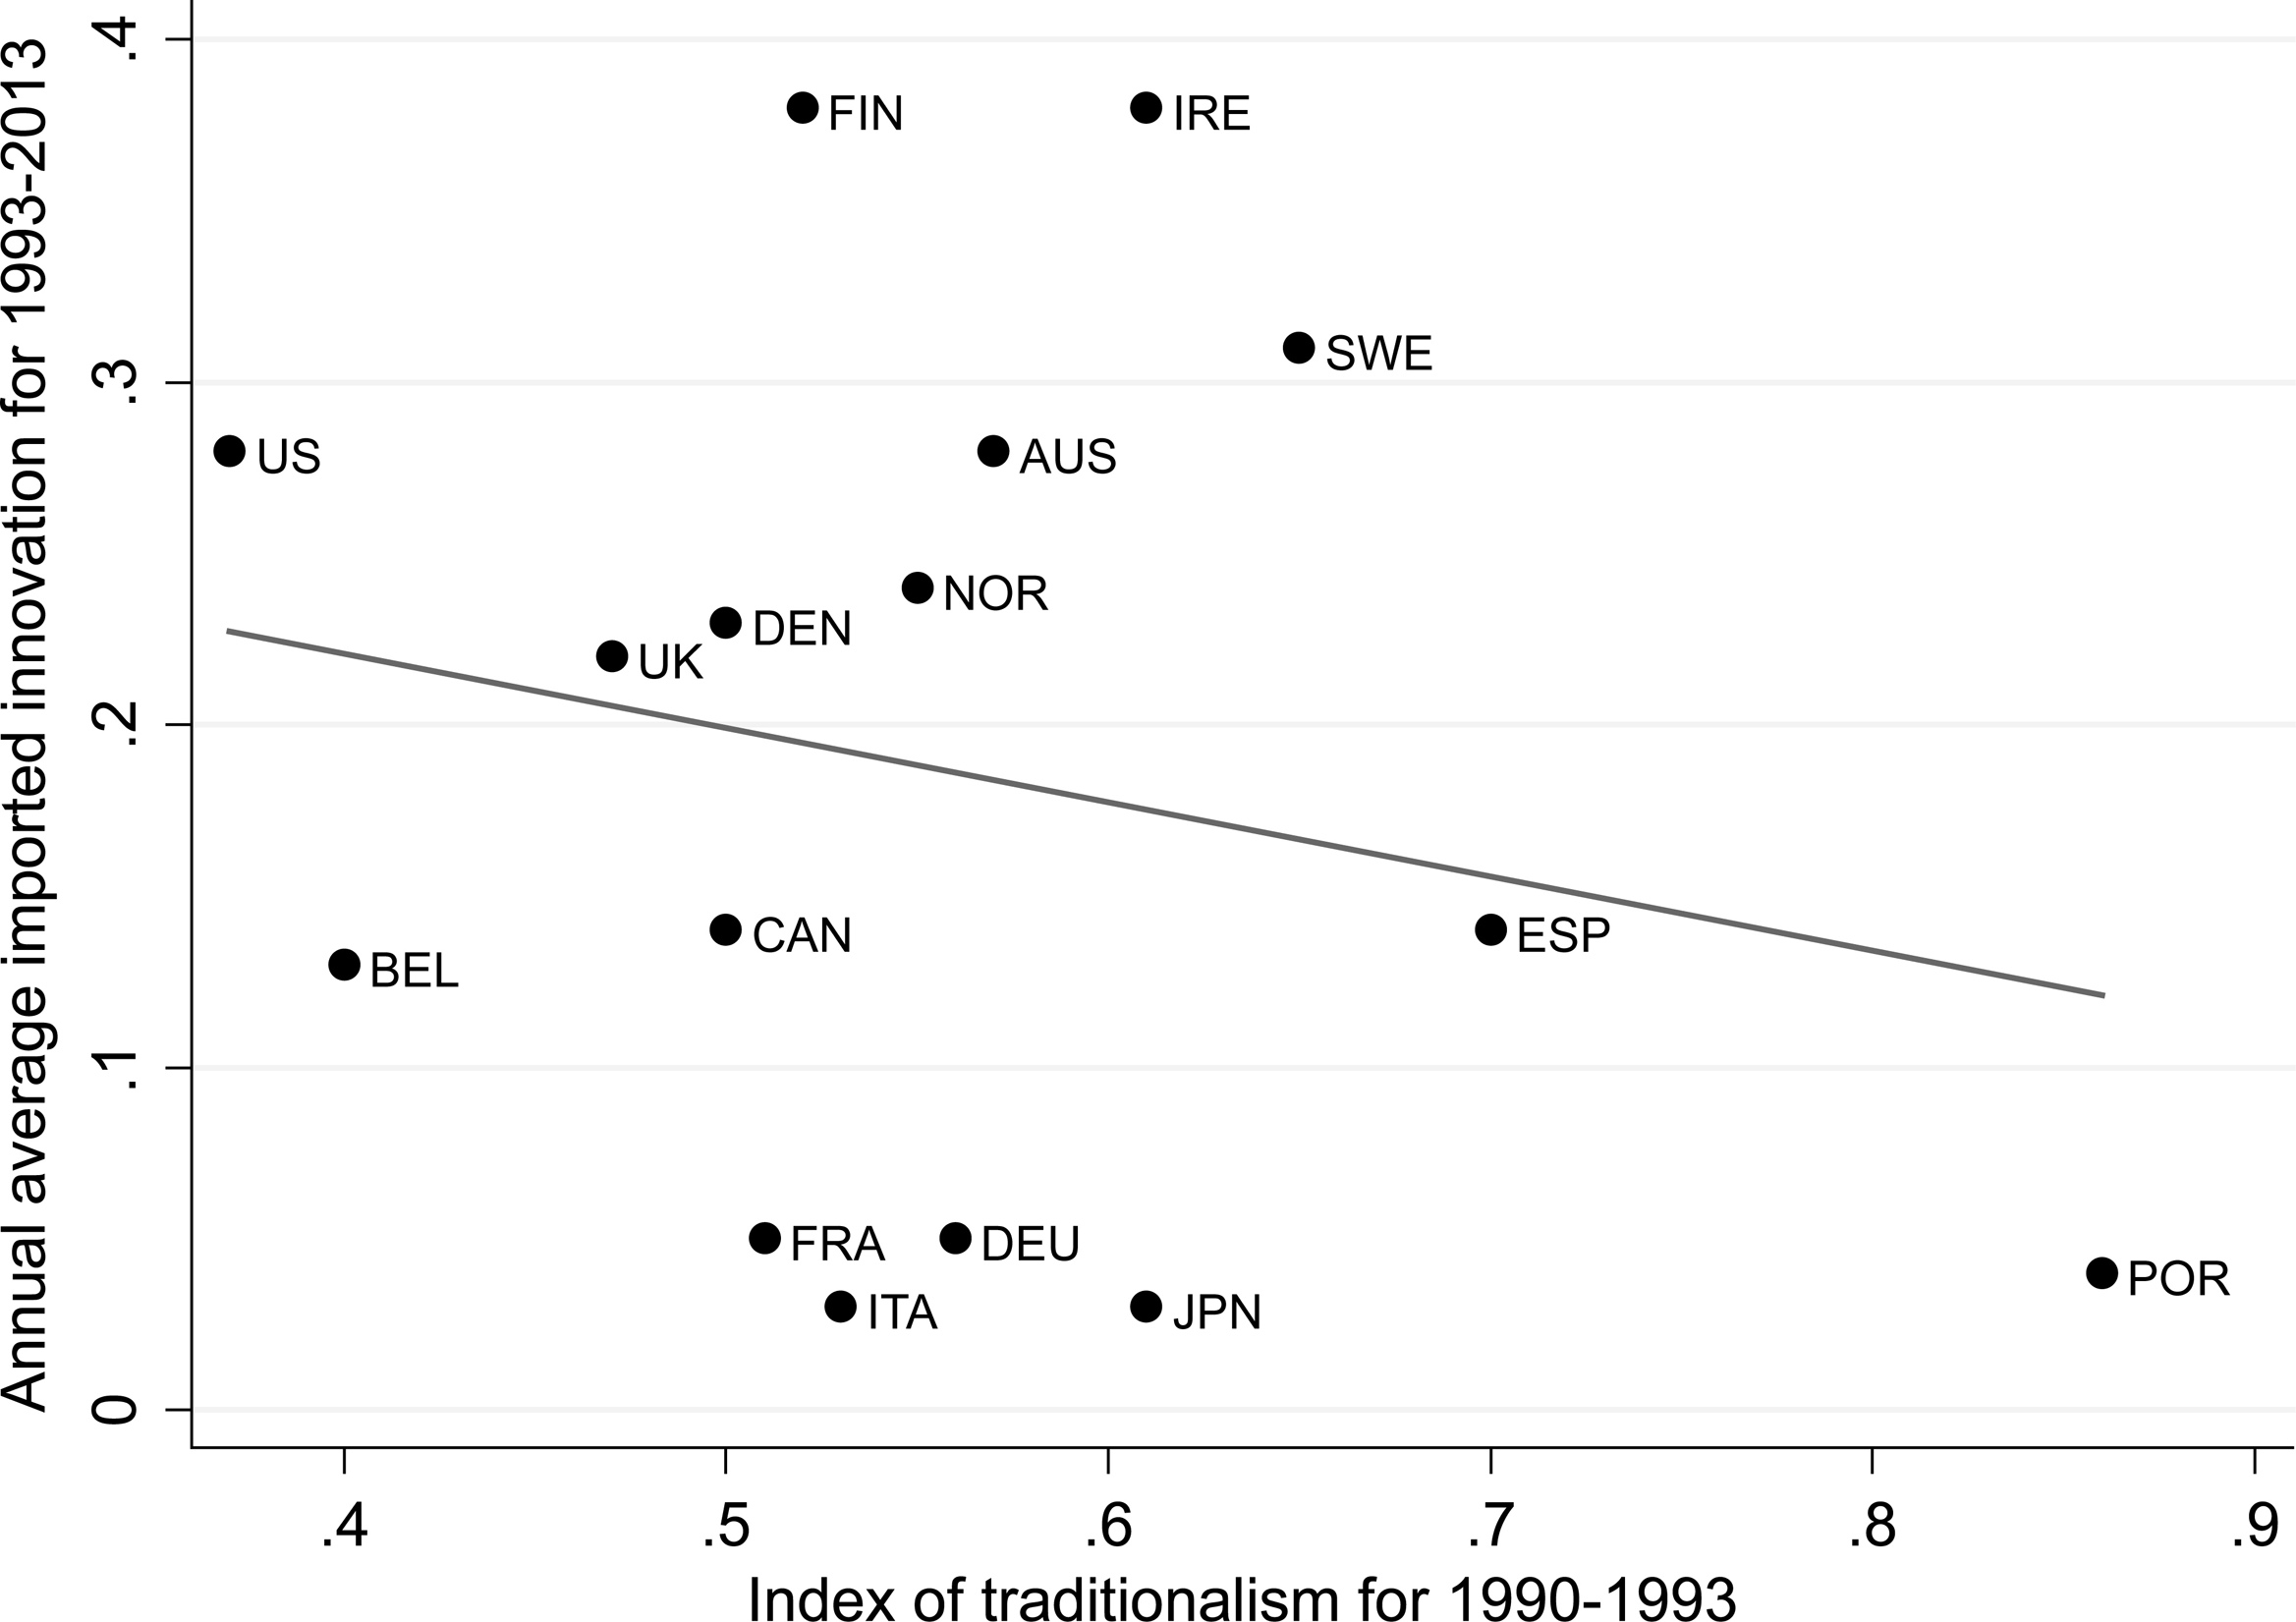
Figure 6.6. Relation between the index of traditionalism, 1990–1993, and the annual imported innovation for 1993–2013. Notes: The data come from the estimates reported in this chapter. The sample includes the following countries: Austria (AUS), Belgium (BEL), Canada (CAN), Denmark (DEN), Finland (FIN), France (FRA), Germany (DEU), Ireland (IRE), Italy (ITA), Japan (JPN), the Netherlands (NTL), Norway (NOR), Portugal (POR), Spain (ESP), Sweden (SWE), the United Kingdom (UK), and the United States (US). The observations for the Netherlands and Norway are very similar, so the observation for the Netherlands is omitted from the plot for presentational clarity.
5. Innovation and Modernism
We are finally ready to address the key question about the relation between innovation and modernism. Figure 6.1 plots our index of modernism, based on the second wave of the WVS, 1990–1993, against the average annual TFP growth for the period 1993–2013. As discussed in this chapter’s introduction, we find a strong positive relation with a goodness of t equal to 0.33.
Next, Figure 6.2 investigates the relation between the index of traditionalism, based on the same data from the second wave of the WVS, and the average annual TFP growth from 1993 to 2013. The slope of the linear prediction is negative, but not significant. Indeed, a casual examination of the scatter plot confirms the absence of any recognizable pattern in the data.

Figure 6.7. Relation between the index of modernism, 1990–1993, and the estimated country effects. Notes: The data come from the estimates reported in this chapter. The sample includes the following countries: Austria (AUS), Belgium (BEL), Canada (CAN), Denmark (DEN), Finland (FIN), France (FRA), Germany (DEU), Ireland (IRE), Italy (ITA), Japan (JPN), the Netherlands (NTL), Norway (NOR), Portugal (POR), Spain (ESP), Sweden (SWE), the United Kingdom (UK), and the United States (US).
To investigate the relation between innovation and the values of modernism, we plot in Figure 6.3 the index of modernism against our estimates of the average annual indigenous innovation for the period 1993–2013. The results reveal the existence of a tight positive relationship between indigenous innovation and the index of modernism. Figure 6.5 shows that a similar positive relation exists between the index of modernism and imported innovation. At the same time, Figures 6.4 and 6.6 indicate that the index of traditionalism is related neither to indigenous nor to imported innovation. Thus, the impact of modernism and traditionalism on indigenous innovation appears to be very similar to what we previously found to be the relation between modernism, traditionalism, and TFP growth.
We find again a positive relation between modernism and the adoption of innovation from abroad, but this time it is estimated a bit less precisely. As before, the results do not provide any evidence of a significant impact, positive or negative, of traditionalism. Together, the plots suggest that modernism is strongly related to both the ability to generate indigenous innovation and the ability to adopt existing innovation from abroad.
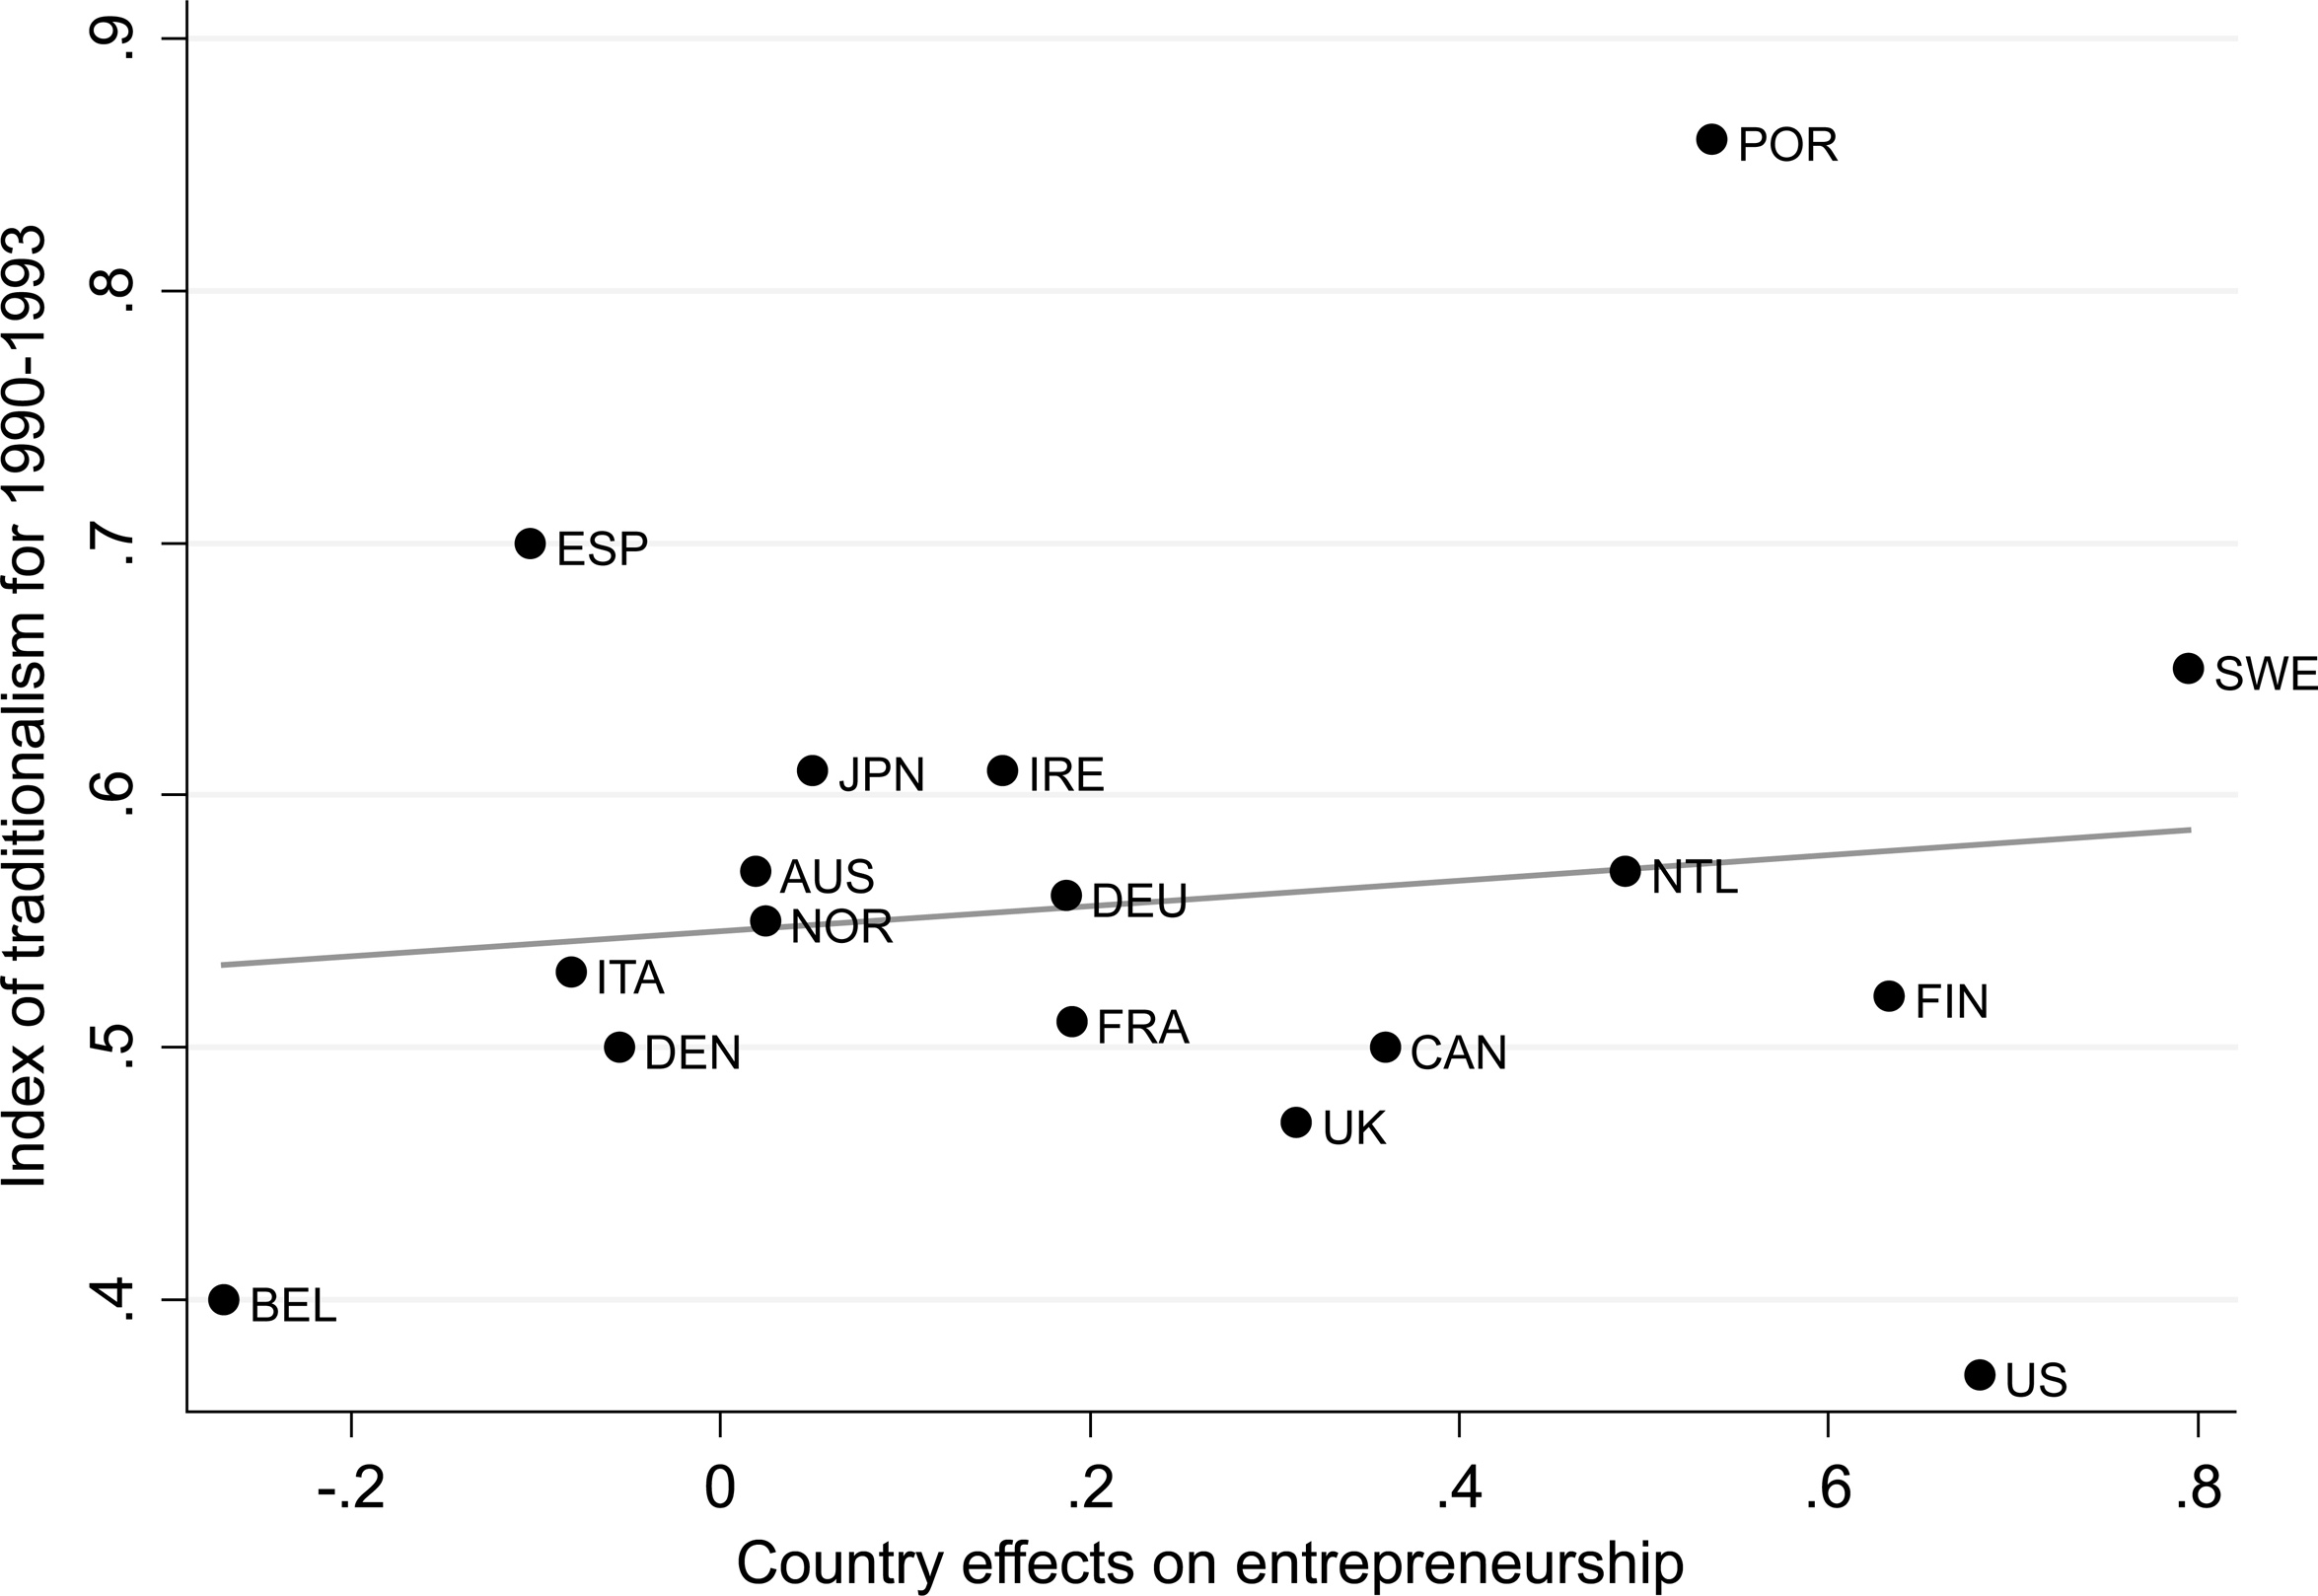
Figure 6.8. Relation between the index of traditionalism, 1990–1993, and the estimated country effects. Notes: The data come from the estimates reported in this chapter. The sample includes the following countries: Austria (AUS), Belgium (BEL), Canada (CAN), Denmark (DEN), Finland (FIN), France (FRA), Germany (DEU), Ireland (IRE), Italy (ITA), Japan (JPN), the Netherlands (NTL), Norway (NOR), Portugal (POR), Spain (ESP), Sweden (SWE), the United Kingdom (UK), and the United States (US).
Figure 6.3 revealed the presence of a strong positive correlation between aggregate outcomes, such as TFP and imported or indigenous innovation, on the one hand, and the spread and strength of values associated with modernism, on the other hand. However, such a correlation does not indicate causation because of the endogeneity and reverse causality concerns discussed at some length in the preceding section.
For this reason, we use the estimated effects from Table 6.3 as a proxy for the index of modernism. The identifying assumption here is that the country effects reflect the cumulative effect of the inherited beliefs from one’s ancestors on entrepreneurial activity. As such, they are at least partially correlated with the index of modernism in each of the countries from which the ancestors of the GSS interviewees came.
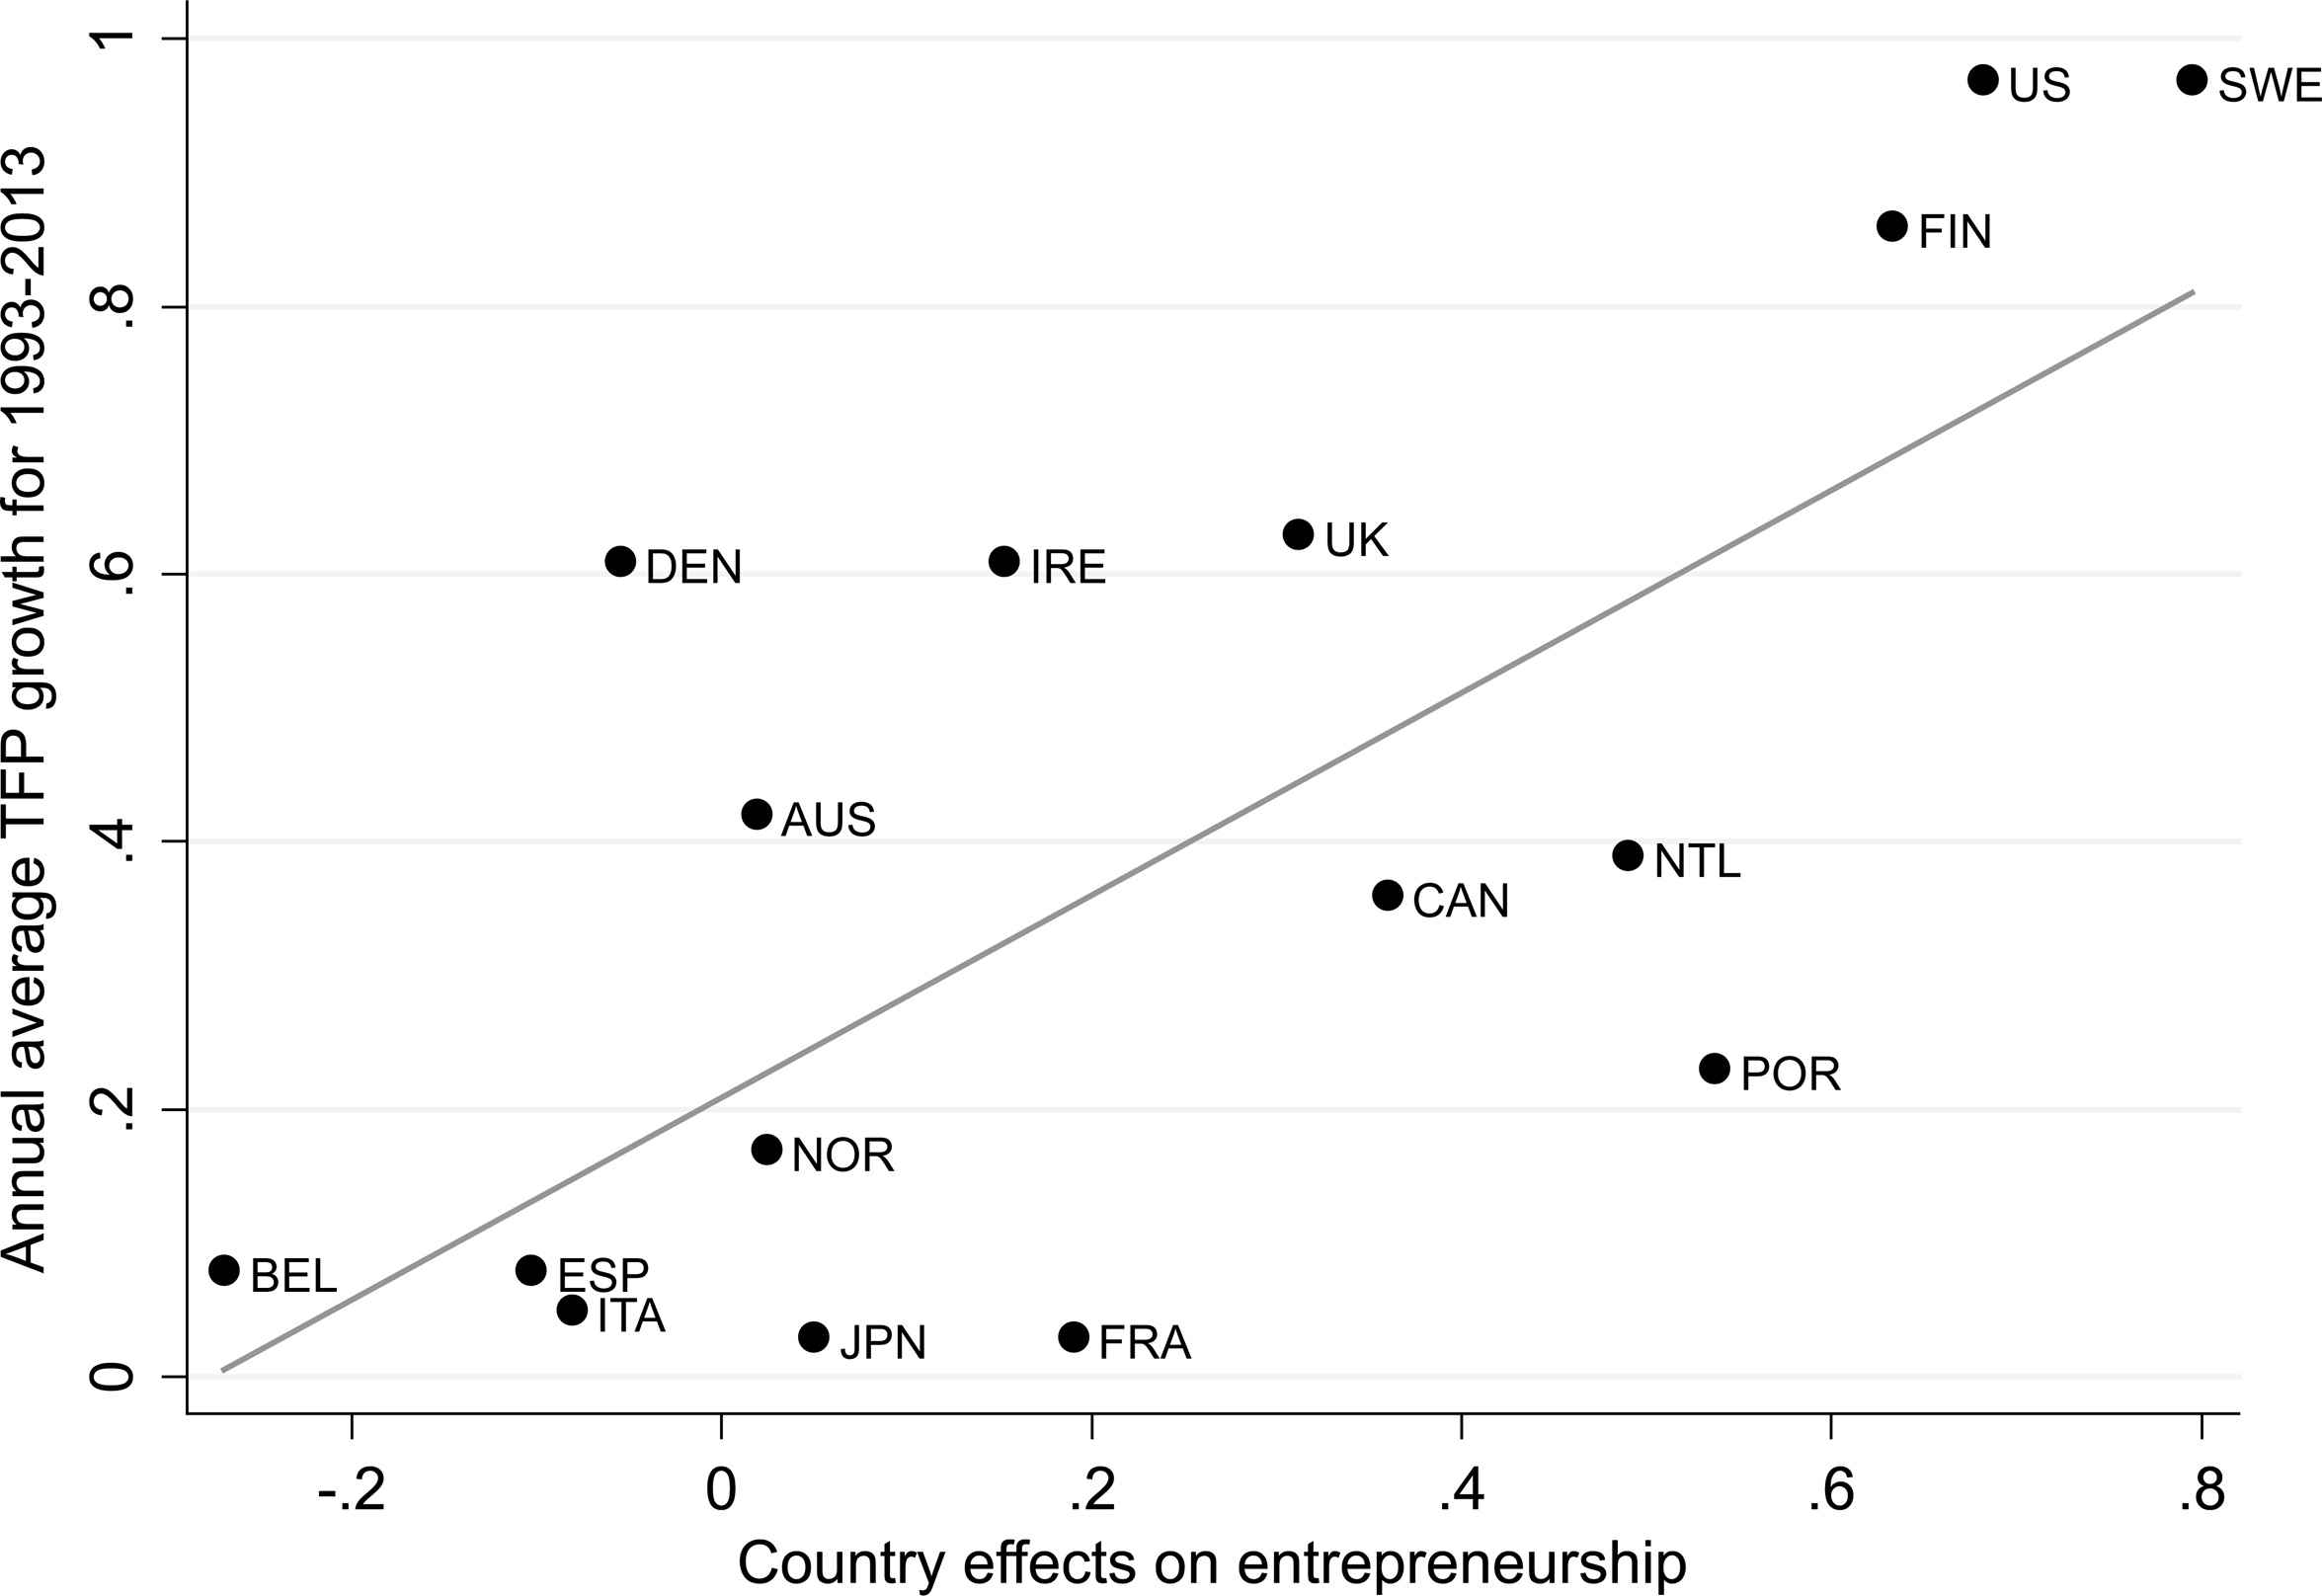
Figure 6.9. Relation between the average annual TFP growth for 1993–2013 and the estimated country effects. Notes: The data come from the estimates reported in this chapter. The sample includes the following countries: Austria (AUS), Belgium (BEL), Canada (CAN), Denmark (DEN), Finland (FIN), France (FRA), Germany (DEU), Ireland (IRE), Italy (ITA), Japan (JPN), the Netherlands (NTL), Norway (NOR), Portugal (POR), Spain (ESP), Sweden (SWE), the United Kingdom (UK), and the United States (US). The observations for France and Germany are very similar, so the observation for Germany is omitted from the plot for presentational clarity.
Figure 6.7 investigates the relationship between the index of modernism and the estimated country effects from the preceding section. It shows that there is a significant positive relation between the two.
At the same time, Figure 6.8 reveals that there is no significant correlation between the country effects and the index of traditionalism. In addition, we note that it is unlikely that the beliefs Americans have inherited from their ancestors have a direct impact on productivity or innovation in the country of origin of the ancestors. Thus, we conclude that the estimated country effects meet the basic requirements for being a proxy for the index of modernism.
Finally, we are ready to investigate the relationship between the estimated country effects as a proxy for modernism and the average annual TFP growth rate for the period 1993 to 2013. Figure 6.9 shows that there is a strong positive relation. The point estimate for the country effects in the linear regression is 0.76, and it is statistically significant at the 5 percent significance level with an overall goodness of fit of around 0.48. To the extent to which our empirical strategy addresses basic endogeneity concerns and issues of reverse causality, we conclude that these results lend support to the hypothesis of a causal impact of modernist cultural values, such as individualism, drive to achieve, and a desire to explore, on aggregate innovation, measured by TFP.
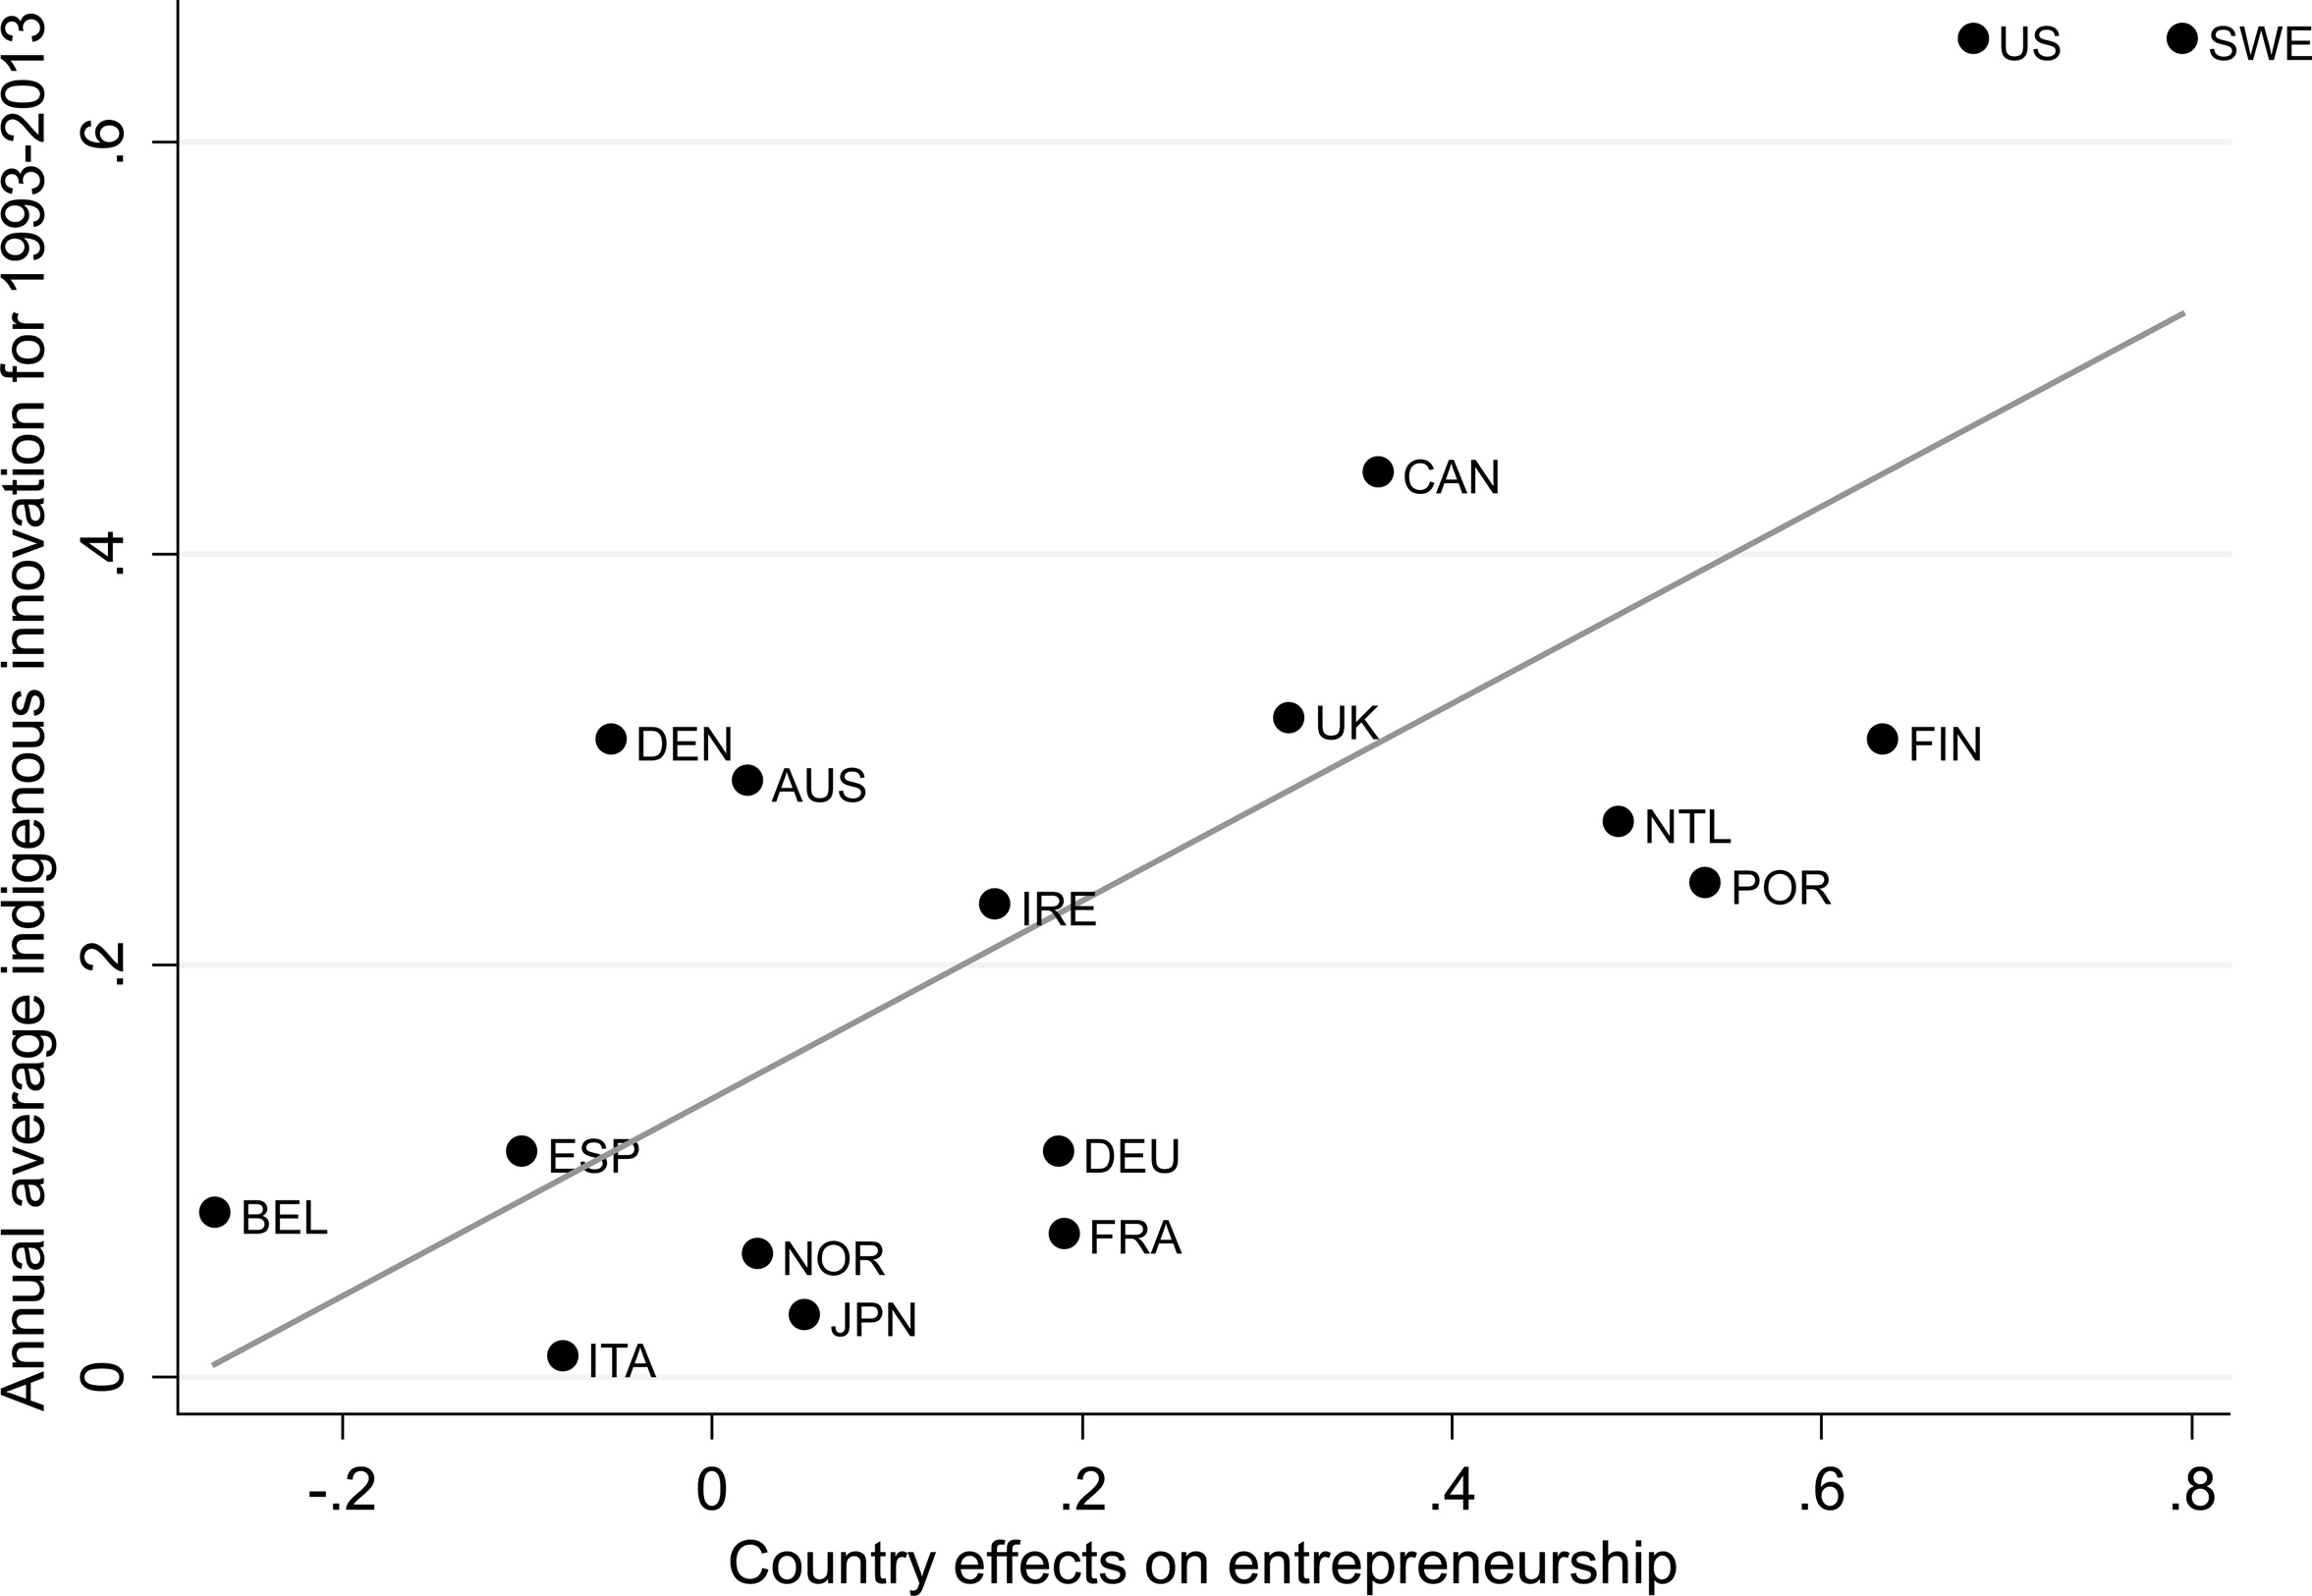
Figure 6.10. Relation between the average annual indigenous innovation for 1993–2013 and the estimated country effects. Notes: The data come from the estimates reported in this chapter. The sample includes the following countries: Austria (AUS), Belgium (BEL), Canada (CAN), Denmark (DEN), Finland (FIN), France (FRA), Germany (DEU), Ireland (IRE), Italy (ITA), Japan (JPN), the Netherlands (NTL), Norway (NOR), Portugal (POR), Spain (ESP), Sweden (SWE), the United Kingdom (UK), and the United States (US).
We conclude by investigating the relationship between the estimated country effects and our own measures of indigenous innovation and imported innovation. Figure 6.10 plots the country effects against the average annual indigenous innovation for the period 1993–2013. We find again a strong positive relation between the two. The slope coefficient in the linear regression of the average annual indigenous innovation on the country effects is estimated at 0.48. It is statistically significant at the 5 percent significance level and the overall goodness of fit is approximately 0.58. Figure 6.11 shows that there exists also a positive relationship between imported innovation and the estimated country effects. In fact, we can reject the hypothesis that the slope coefficient in the associated regression is zero at the 10 percent significance level but not at the 5 percent significance level.
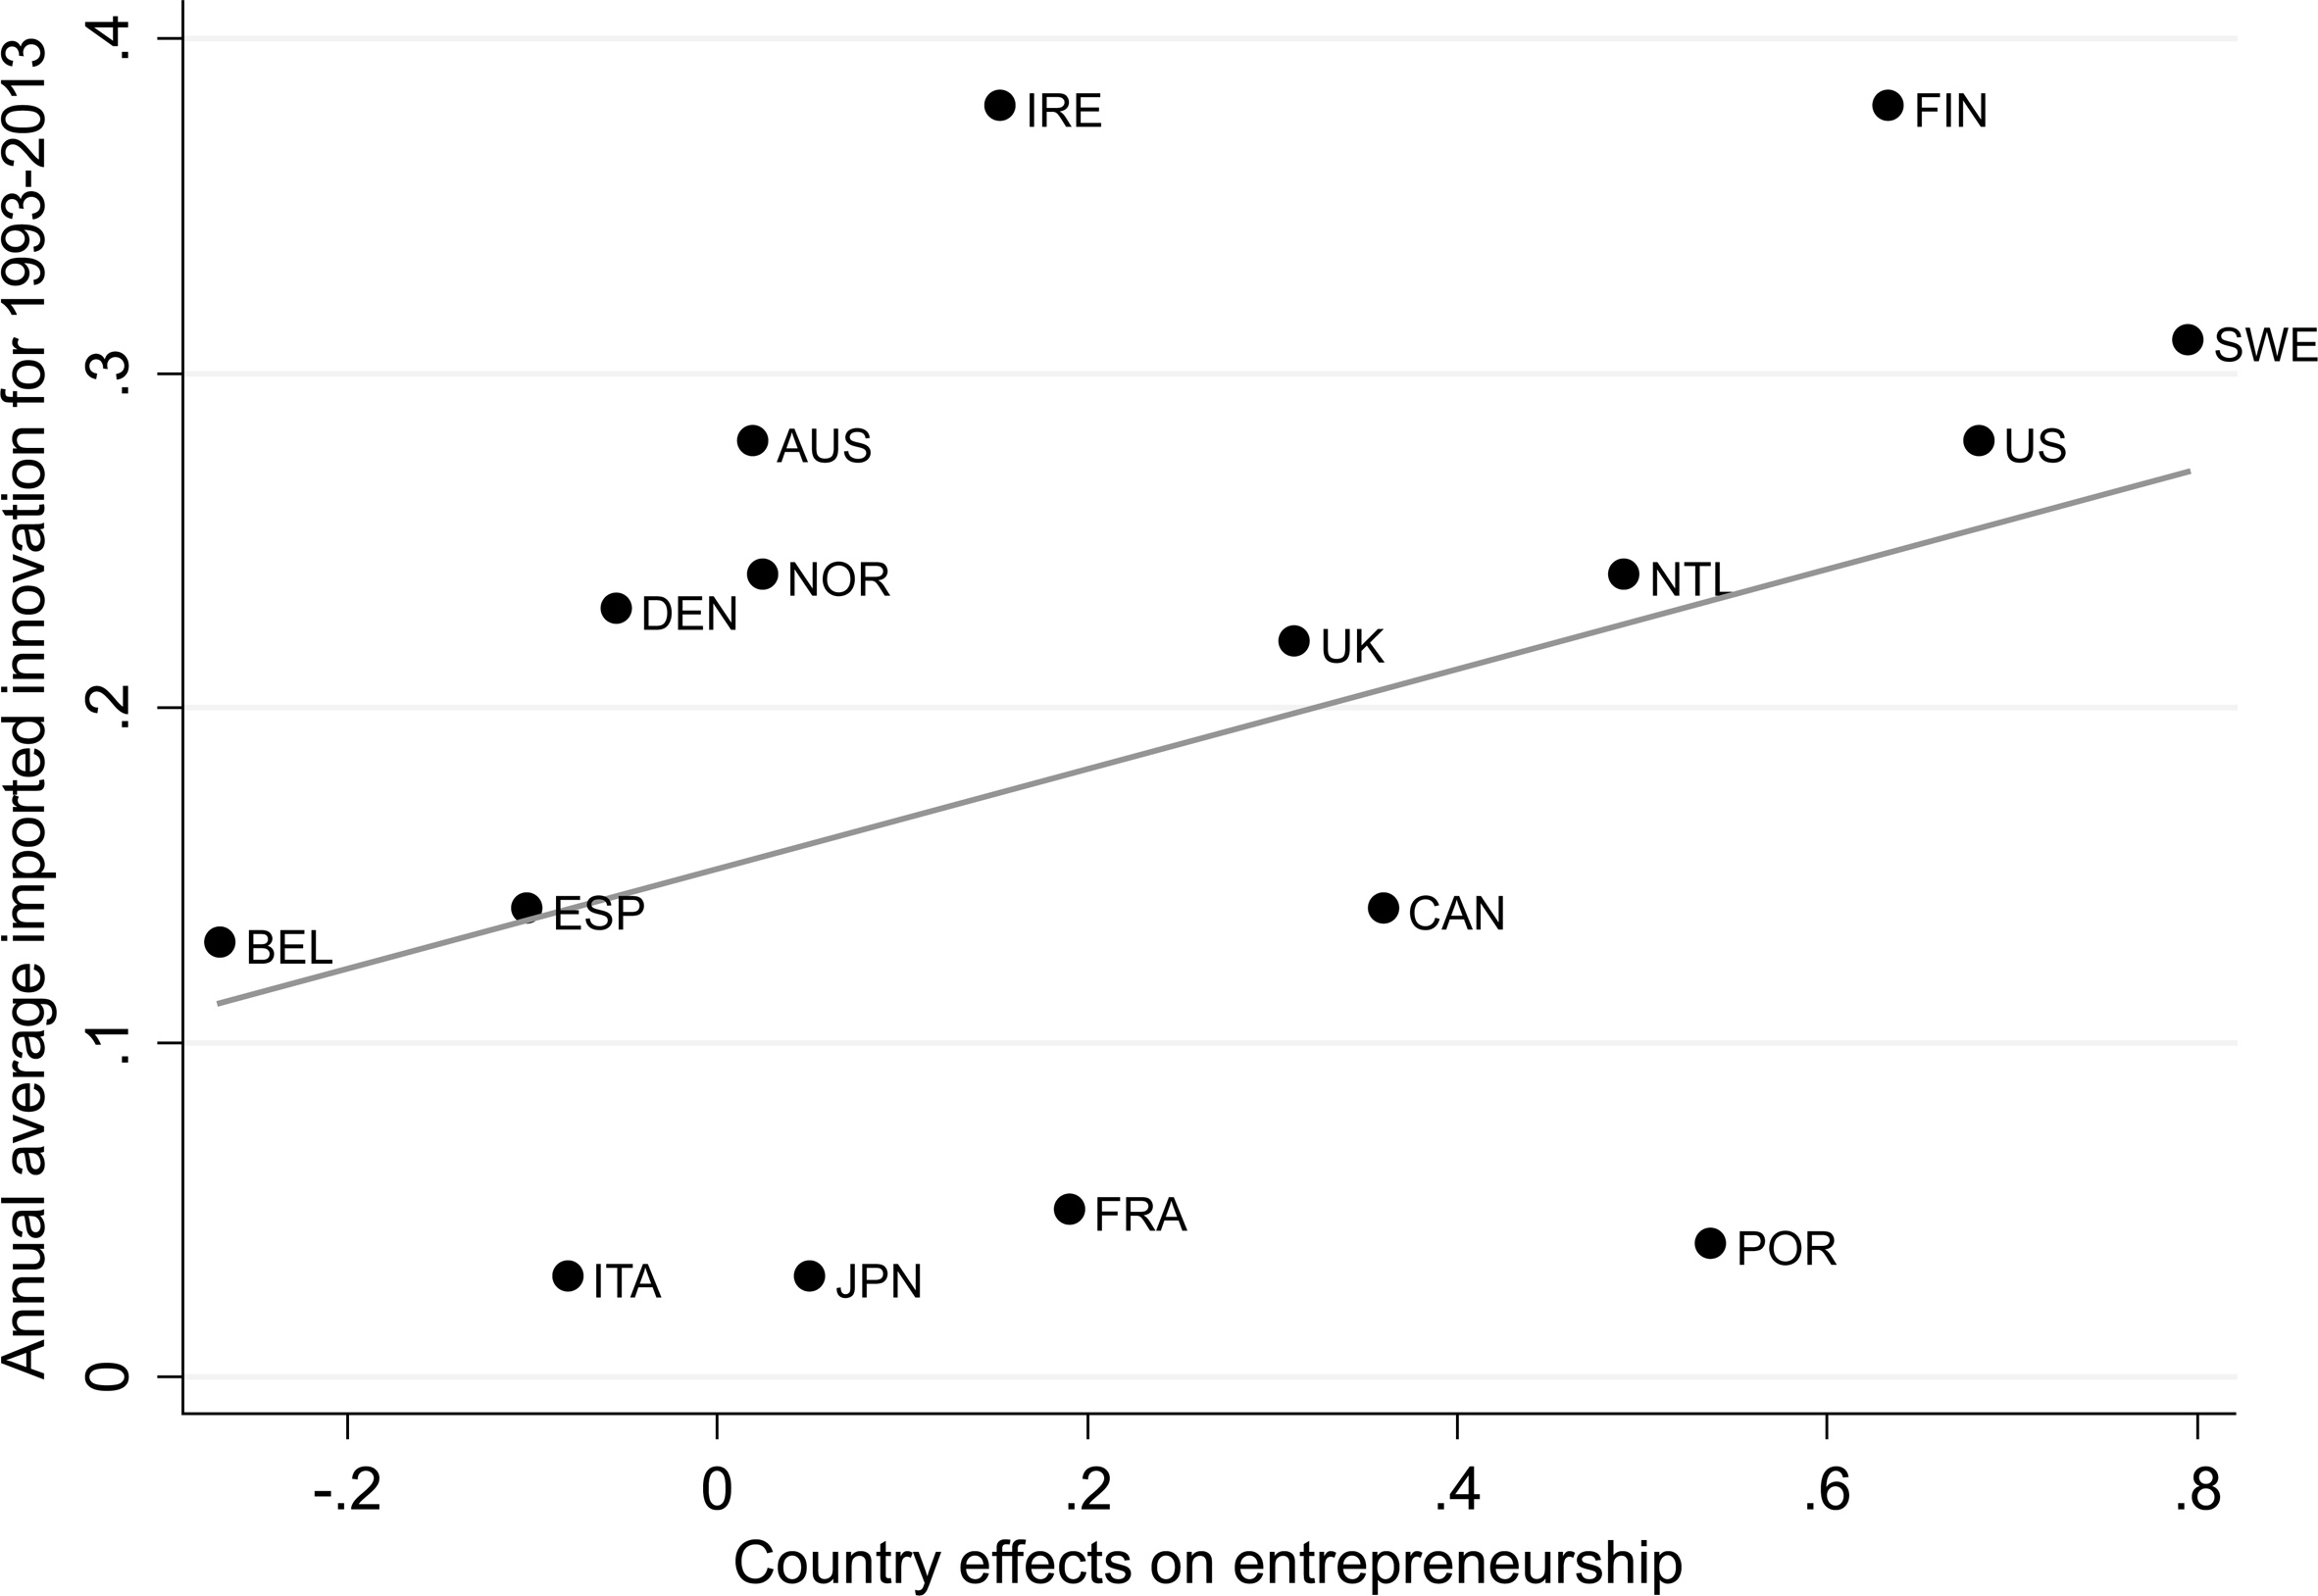
Figure 6.11. Relation between the average annual imported innovation for 1993–2013 and the estimated country effects. Notes: The data come from the estimates reported in this chapter. The sample includes the following countries: Austria (AUS), Belgium (BEL), Canada (CAN), Denmark (DEN), Finland (FIN), France (FRA), Germany (DEU), Ireland (IRE), Italy (ITA), Japan (JPN), the Netherlands (NTL), Norway (NOR), Portugal (POR), Spain (ESP), Sweden (SWE), the United Kingdom (UK), and the United States (US). The observations for France and Germany are very similar, so the observation for Germany is omitted from the plot for presentational clarity.
6. Conclusion
In this chapter, we investigated the relationship between beliefs and attitudes about economic life and economic performance on both aggregate and individual levels. In particular, we focused on the crucial issues of productivity growth and innovation. As preliminary steps in our work, we designed two simple indexes that summarized some basic beliefs and attitudes about economic life, which we called indexes of modernism and of traditionalism. Then, we established that there is a positive correlation between the index of modernism and the previously estimated indigenous and imported innovation, as well as the raw TFP data. To address obvious endogeneity concerns and possible reverse causality, we apply an empirical strategy similar to the one in Algan and Cahuc (2010).10 Our results show that the country of origin of one’s ancestors continues to have a significant effect on the likelihood of becoming an entrepreneur and having a high income long after the time of the immigration of one’s ancestors. We show that this effect of the country of origin is positively correlated with the current values of the index of modernism in the respective countries.
Moreover, the associated country effects are related positively to TFP and to both our measure of indigenous innovation and our measure of imported innovation. Thus, we conclude that our results lend some support to the hypothesis that there is a positive causal effect of broad economic culture on economic performance, in particular innovation.