6
“Morning in America”
Because the Reagan administration was unable to push all of its spending cuts through Congress, the passage of the Economic Recovery Tax Act of 1981 signaled that fiscal policy would be highly stimulative. To measure the stimulation of fiscal policy, economists break down the budget deficit into that part created by policy and that part created by the economy. Between fiscal 1980 and 1983, the budget deficit of the federal government went from 2.7 percent of gross domestic product to 6.1 percent.1 However, much of that increase was due to the 1981–82 recession. When a recession occurs, tax revenues fall because people lose their jobs and businesses don’t earn as much profit. Because our tax system is progressive, tax revenues take a smaller percentage of personal income when incomes decline. Meanwhile, unemployment compensation payments increase as more and more people are unemployed. These changes, which occur without any explicit action by Congress or the administration, are called automatic stabilizers because they automatically raise the deficit in recession, thus increasing the government stimulus to aggregate demand, and lower the deficit in periods of prosperity, thus moderating the increase in aggregate demand by decreasing the government stimulus.
In order to measure the direction of policy, we need to identify what the budget deficit would have been if there had been no recession and therefore no automatic decline in tax revenues or automatic increase in government payments for programs like unemployment compensation. This measure is called the high-employment budget. This tells us what the budget deficit would have been at some fixed level of unemployment. By fixing the level of unemployment, we in effect screen out the impact of the business cycle on the deficit and are left with only the impact of policy decisions.
When this is done for the years 1980–83, we can see that the policy changes instituted by the Reagan administration—the tax cuts, the attempts to cut civilian government spending, the rise in military spending—added up to a significant increase in the high-employment deficit. The Bureau of Economic Analysis of the Department of Commerce calculated the deficit that would have existed if the economy had been at 6 percent unemployment. As a percentage of the gross national product2 that would have existed if unemployment were at that level, the high-employment or structural deficit went from a low of 0.53 percent in the second quarter of 1981 to a high of 2.93 percent in the fourth quarter of 1983.3 Thus, if we ignore for a moment incentive effects predicted by the supply-siders, there definitely was a strong aggregate-demand stimulation to production as a result of the Reagan fiscal policy. However, the timing of the tax cuts and spending increases were such that in 1981, the fiscal stimulus actually was lower than in the previous year. It is true the Economic Recovery Tax Act mandated three across-the-board income tax cuts, but the first one of 5 percent only took effect in October, meaning it cut taxation as a percentage of 1981 income only 1.25 percent. On top of that, bracket creep was still going strong, as 1981 inflation measured 10 percent. With people moved into higher tax brackets, the ratio of income tax paid to real income increased. If we then add in the previously scheduled increases in the Social Security tax rates, it is clear that the policy regime provided a net fiscal drag rather than stimulus in that first year. Even adding in the automatic stabilizers, the total (actual) deficit as a percentage of gross domestic product was a bit lower in 1981 than it had been in 1980.4
Meanwhile, the Federal Reserve was attempting to adhere to its monetary targets. From the fourth quarter of 1980 to the first quarter of 1981, the rate of growth of M1 was 4.6 percent. From the first to the second quarter it rose to 9.6 percent. From the second to the third quarter of 1981, the rate fell to 2.0 percent. Then the rate rose back to 5.1 percent for the fourth quarter.5 In short, a contractionary monetary policy combined with a not-yet-expansionary fiscal policy. Thus, after a very short recovery from the 1980 recession, the economy fell into recession in the third quarter of 1981.6
The Volcker Recession: Alternative Explanations
That recession lasted until the fourth quarter of 1982 and proved to be the deepest one of the post–World War II period. Since the purpose of our investigation is to discuss the impact of the Reagan-Volcker policy on the economy over the long run, it is not particularly important to dwell on what happened during the recession.7 If the economy had come out of the recession and experienced a higher rate of growth, higher rate of productivity growth, more productive investment, and a more rapid expansion in the standard of living than in the previous period, one would have to concede that the pain and suffering of the recession had been worth it in some sense. Similarly, if the recession had not occurred but the economy had continued to perform at an unacceptable level, this would be an indictment of the economic policies adopted despite the fact that the economy would have been spared the recession.
It is instructive, however, to note the ways the three alternative points of view explain the recession of 1981–82. For those who supported the Reagan administration policies, the recession was an unavoidable consequence of the Carter administration’s mismanagement of the economy and the Federal Reserve’s acquiescence in inflation before 1979. For the mainstream critics of Reaganomics, the recession was the result of the Federal Reserve’s rigid commitment to monetarism. Throughout 1981 and 82, the rate of growth of money remained positive, but the higher interest rates killed the economy. According to this perspective, a slower approach to the battle against inflation would have reduced inflation without such a serious decline in output as occurred in the recession.8
Finally, the radical approach emphasizes that as painful as recessions are, they are the only way the United States economy can reestablish patterns of profitability high enough to encourage the private-sector investment that is the key to economic growth. The 1974 recession, despite its severity, did not reestablish profitability at a sufficiently high level. The costs of labor and imported raw materials as well as the tax burden on business (in part exacerbated by inflation) were having a bad effect on the business climate. Only a dramatic shifting of the balance of power in the struggle for income shares would reestablish profitability at a level high enough and predictable enough so that new investment would be forthcoming.9
Thus, in a strange way, the radicals were agreeing with the conservatives—business had been burdened by taxation, regulation, and other high costs. However, whereas conservatives see this situation as one that damages incentives, producing inevitable consequences, radicals see the behavior of business as more purposeful. Business has the power to hold the rest of the economy hostage. In the face of a bad business climate, they can engage in a “capital strike.”10
The radicals saw this situation of stalemate as reason to consider alternative kinds of economic organization where the power of capitalists to hold the economy hostage would be gone.11 According to this point of view, the vast majority of citizens who are not wealthy and have very little chance of becoming wealthy are doomed to experience disruptions in their lives and a shrinking share of the economic pie because the only way to preserve prosperity is to bribe the tiny minority of wealthy people to invest some of their wealth productively. Conservatives, on the other hand, saw the burdens on business as obstacles to prosperity. Remove those burdens and business incentives would flourish, benefiting that vast majority of the population. Conservatives also denied that periodic recessions were always necessary for the long-term health of a capitalist market economy. Instead, they felt virtually all recessions, especially severe ones, were the result of mistaken government activities that destabilized the market.12 Absent these governmental mistakes the business cycle would self-correct quickly.
Interestingly, in this part of the argument, it is the conservatives and the mainstream economists who are in agreement. Both groups believe that periodic recessions, especially severe ones, are not inevitable. Mainstream economists, however, disagree with conservatives because they believe that judicious application of the correct policies can smooth the business cycle and promote more rapid growth. Left alone, some recessions, they fear, might fail to self-correct, leading to long depressions. They also feel it is unconscionable to let the economy suffer through the slow process of self-correction when the right kind of policies applied at the right time can speed up the process.
No matter which position one takes about the cause of the recession of 1981–82, the success or failure of the Reagan-Volcker program needs to be analyzed in reference to the business cycle upswing that began in the fourth quarter of 1982 and did not end until the third quarter of 1990. This makes it the second longest expansion of the postwar period, the longest running from the first quarter of 1961 to the third quarter of 1969. It is essential to identify the elements of success and the elements of failure in the 1983–90 expansion. To do this, we will need to examine the various claims made by both supporters and detractors of the Reagan program. However, first we need to follow the course of policy up through 1989.
Policy: 1984–89
Beginning in 1984, it became apparent to all observers that the usual reduction in the structural deficit that accompanied previous recoveries from recessions was not occurring in the post-1982 recovery. Instead, the structural deficit rose after 1984 to 3.58 percent of GDP in 1985 and 4.31 of GDP in 1986 before declining slowly to 3.22 percent of GDP in 1989. This 1989 figure, coming at the end of a very long recovery, was much higher than in previous recoveries.13 Even the recession year of 1975 with its major tax cut had produced an average deficit of only 2.54 percent of GDP. This structural deficit drove the total government deficit.14 Thus, we conclude that fiscal policy remained quite expansive for the entire Reagan-Bush recovery.
Monetary policy was expansionary in a few periods, yet overall, as indicated by the real Federal Funds rate, the Fed was keeping a tight rein on the economy. Real interest rates were at unprecedented levels for the entire postrecovery period, despite the periods of expansionary monetary policy. That is because inflation came down almost as much as did the nominal Federal Funds rate. The same holds true for the prime rate. In the years before 1970, the highest average yearly rates in real terms were 3.3 percent in 1961 and 3.4 percent in 1963. In the period between 1970 and 1978, the highest rate was 2.51 percent, in 1978. After the imposition of the Volcker anti-inflationary program, the real prime rate jumped dramatically beginning in 1979. Even after the recession had squeezed most of the inflation out of the economy, the real prime rate never fell below 4.22 percent in any quarter between 1984 and 1989, and most of the time it was significantly higher.15 The upshot of this was that in a very real sense monetary policy and fiscal policy worked at cross-purposes for most of the decade. Monetary policy was stamping on the brakes, trying to restrain inflation, while fiscal policy was revving the accelerator to increase aggregate demand.
These actions by the Federal Reserve were in part in reaction to the widespread view that deficit financing for the military buildup could have significant inflationary consequences if the economy grew rapidly enough to achieve “full employment,” which, as we might recall, was defined in the 1980s at 6 percent of the labor force. In a major study of the proposed military buildup issued in February 1983, the Congressional Budget Office warned that
if the Congress chose to continue increased defense spending as the economy approached full employment of resources, offsetting cuts in nondefense spending or increases in taxes would become critical to avoid inflation. . . . If . . . the buildup was not compensated but instead was financed by larger deficits, . . . it could have increasingly inflationary effects in 1985 and 1986.16
With the economy growing very rapidly in 1984 and the deficit remaining very high, the Federal Reserve must have felt it had no choice but to step strongly on the brake. The decision was made at the March 1984 meeting of the Federal Open Market Committee. The economy was growing too fast, and the failure of the administration and Congress to agree on deficit-cutting actions heightened their awareness that only a tight monetary policy could prevent the recovery from exploding into another round of inflation, 1970s style.17
In the entire post–World War II period, this appears to be the first preemptive strike against inflation—in other words, a policy designed to combat an inflation that had not yet appeared. This 1984 action signaled the Fed’s recognition that the “bond market,” the institutions that buy and sell large volumes of interest-bearing notes and react strongly to fears of inflation by selling off a large volume of assets to protect their portfolios, had to be placated at all costs. Rather than wait for inflation to begin and then respond with restrictive monetary policy, the new Federal Reserve approach was to sacrifice economic growth whenever the economy appeared to be “too close” to “full employment.” Such a situation means the economy might, sometime in the near future, be subject to inflationary pressures. As always, we must remind the reader that the terms in quotation marks are incredibly imprecise. Even if one could agree that “full employment” was 6 percent in the middle 1980s, what constitutes “too close?” The lowest monthly unemployment report for 1984 was 7.1 percent in June, before the effects of the tightening were felt. The rate rose to 7.4 percent in August before declining to 7.1 again in November and December.18 The economy would not come close to “full employment” (6 percent) until the middle of 1987.
When it comes to tax policy, there is a mixed story. The Economic Recovery Tax Act had involved more than just supply-side-oriented reductions in individual income tax rates, reduced taxation of capital income, and indexing.
Congress . . . abandoned its cautious approach to President Reagan’s proposals and went in the opposite direction. A bidding war started. Many new provisions were added to the original Reagan tax proposals, including extension of individual retirement accounts (IRAs) to higher income taxpayers who were already covered under employer-provided pension plans, a new deduction for some earnings when both spouses in a family worked . . . an exclusion from income subject to tax of interest earned on qualified tax-exempt savings certificates . . . a charitable contributions deduction for individuals who did not normally itemize expenses, a credit for increasing research activities within a business, the elimination of estate taxes for a large number of wealthy taxpayers, and an number of other special preferences.19
When the Treasury Department’s Office of Tax Analysis projected the revenue loss associated with these provisions from the time of enactment up to 1990, they came up with a total figure of $323 billion, or 5.6 percent of GDP.20 The fact that the tax reductions and defense-spending increases would make it impossible to keep the federal budget deficit from rising became apparent almost as soon as ERTA was passed. By early 1982, the president’s budget message for fiscal year 1983 included significant tax increases, though the euphemism used was “revenue enhancements.” Out of that message and the efforts of members of the Senate as well as people on the president’s staff, most notably Budget Director David Stockman, came the Tax Equity and Fiscal Responsibility Act (TEFRA) of 1982. According to the analysis of the Treasury, that act “took back” $57.2 billion of the $323 billion in tax cuts contained in ERTA.21
As mentioned before, the effort to reform the Social Security system that began with an attempt to significantly cut back the payments to early retirees failed miserably.22 From the point of view of conservative economics, the changes that ultimately passed in 1983 did nothing to rectify the real problem in the Social Security retirement system. Recall that in redistributing income, it is considered inefficient to redistribute money to people who don’t really need it. But that is of course what Social Security does for all recipients who would not be in poverty without their retirement check. Nevertheless, all effort to achieve the comprehensive reform that conservative economic theory would require was abandoned. Instead, the 1983 law increased the retirement age by two years (phased in between 2000 and 2022), accelerated previously legislated payroll tax increases, forced new federal employees and employees of nonprofit organizations to join the system, and delayed for six months the next cost-of-living adjustment.23
There was one step taken in the direction of making the retirement check at least partially means-tested. As mentioned above, half of all Social Security benefits became taxable for higher-income recipients. Twenty-two percent of all Social Security recipients paid income tax on their benefits. The income tax liability as a percentage of Social Security payments (exclusive of Medicare) never rose above 2 percent for the entire decade of the 1980s.24 Nevertheless, the principle that Social Security payments were subject to taxation does reduce the amount of Social Security received by people who “don’t need it.”
In 1985, the Republican majority in the United States Senate offered a deficit reduction plan that involved limits on the growth of Social Security payments (in effect reducing the automatic cost-of-living increase for some recipients). President Reagan refused to support them, and the attempt was abandoned in the face of opposition from the Democratic majority in the House. According to Norman Ornstein and John Makin of the American Enterprise Institute,
Had Reagan supported his own party in Congress in 1985, House Democrats would have been compelled to go along, and the growth of entitlements would have been curbed, budget deficits would have been far below those that actually occurred, and the great Reagan fiscal experiment of cutting taxes and still reducing the budget deficit might well have succeeded.25
These two authors argue that members of Congress felt pressured by the high deficits in the middle of the 1980s to revisit the growing spending on entitlements, particularly those without means tests, but that the political lessons learned in 1982 when the Reagan administration had floated the idea of cutting back on early retirement benefits for Social Security recipients had convinced the majority of Congress as well as the president that Social Security was, in the language of the day, the “third rail” of American politics. Touch it and you’ll be zapped! It would be an entire decade before a deficit-cutting Congress would attack entitlements that mostly benefited the middle class, and even then the Republican-controlled Congress of 1995 explicitly ruled out changes in the Social Security system.
The impact of the actual changes made in Social Security between 1983 and 1989 still totaled $166.2 billion, according to the House of Representatives Committee on Ways and Means.26 Of all the tax changes made after ERTA, the changes associated with the 1983 Social Security Act amendments are quantitatively the most significant. The rise in the Social Security payroll tax (but not the income taxation of half the benefits of high-income taxpayers), coupled with a decline in marginal individual income tax rates and the taxation of income from capital, fits very neatly into the conservative economic-policy basket. In fact, from a supply-side perspective, the most efficient tax is a regressive tax levied in a fixed amount on a person regardless of income. Such a tax has a marginal tax rate of zero and presumably has no negative incentive effects whatsoever. The payroll tax for Social Security has a marginal tax rate of zero once the maximum earnings level has been reached. Covered earnings are taxed at rates below 15 percent (combined employee and employer rates), and that, too, is considered low enough to have a negligible impact on behavior. Thus, we can conclude that the combined Social Security tax increases and the net effect of ERTA and TEFRA was to tilt the tax system in the direction of reducing the allegedly negative incentive effects of high marginal tax rates and specifically increasing the incentives of businesses to invest by decreasing the taxation of income from capital.
Toward Tax Reform
Beginning in 1984, and concluding with the enactment of the Tax Reform Act of 1986, the clear, positive (from a supply-side perspective) impact of tax legislation began to get muddied. The first steps were made in reforming the tax shelter problem. Tax shelters involve investing with borrowed funds, depreciating the asset bought, and deducting the interest on the loan against current income. As the value of the depreciation declines, the investor can sell the asset. When that happens, all the “losses” that had reduced taxable income due to depreciation and interest payments could be recouped. That income, which had been “sheltered” from taxation by the immediate deduction of interest and depreciation would now, however, be in the form of a capital gain, which up till 1986 was subject to a maximum tax rate of 20 percent. The incentives in place after 1981 were even greater than that, because the entire initial investment was subject to an immediate 10 percent investment tax credit. This produced the perverse effect of making some investments that actually lost money produce enough tax reductions to more than offset these losses.27 To show how significant this became over time consider the following information:
Between 1965 and 1982, the number of partnerships reporting net losses grew from 229,000 to 723,000. . . . Net “losses” reported in oil and gas partnerships grew from $128 million to $13.2 billion, and in real estate from $619 million to $23 billion. Together, oil and gas and real estate partnerships accounted for about 60 percent of all losses reported on partnerships. . . . New public offerings of partnerships grew from $8 billion in 1979 to $64 billion by 1982.28
The Deficit Reduction Act of 1984 began the process of clamping down on the tax shelter market and did lead to an increase in revenue of $31 billion by 1990.29 However, the most significant departure from the incentive effects of the Economic Recovery Tax Act occurred with the passage of the Tax Reform Act of 1986. Unlike ERTA, this was not a tax cut. President Reagan insisted that it be revenue neutral. Every cut had to be matched by increases in revenue somewhere else in the tax code. There were other broad themes required by the president. First, the poor should not have to pay income tax. Over the years, inflation had eroded the real value of the personal and dependent exemptions. The only way to reverse this would be to raise those exemptions dramatically. Second, the top rates had to be reduced and the number of brackets compressed to one or two above the zero bracket.
In practice, what happened was that lower published rates were “paid for” by abolishing a number of preferences, including those that could be used to shelter income. This had the effect of raising the marginal tax rate on a number of high-income taxpayers and actually increasing the effective rate of taxation on many businesses. As C. Eugene Steuerle, the assistant secretary of the Treasury who headed up the group that produced the first tax reform proposal in 1984 (called “Treasury One”) noted, “Absent base-broadening, it is almost impossible in a revenue-neutral bill to reduce tax burdens for the poor without increasing average marginal tax rates in the economy.”30
However, since the bill was also carefully crafted so as to be revenue neutral within income groups, the result was that average income tax rates for all income classes actually fell, though the most significant falls were for people with less than $20,000 in annual income.31 This left only one source for the increase in revenue, the business sector. The change is dramatic.
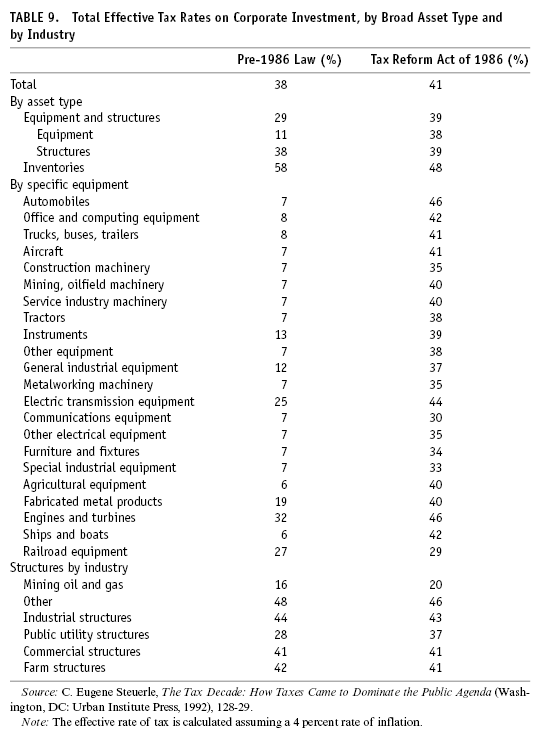
It is apparent from the variations in effective tax rates under the pre-1986 law that the tax system was definitely treating investments differently depending on the type (see table 9).32 Thus, on pure efficiency grounds, “leveling the playing field” among all kinds of businesses would definitely be a high priority. However, note also that on average the rates of corporate taxation were significantly higher after reform. This was in order to “pay for” the reductions on individuals. There was a fear that this would significantly harm investment incentives, but when one combines the effect of the new law on corporate and individual taxation, the rise in the cost of capital was quite small. Thus, the consensus among economists who looked at the impact of the Tax Reform Act (at a 1990 conference) was that it had mostly a financial impact—reducing the use of tax shelters.
It was the issue of the full taxation of capital gains that became a tremendous sticking point. The original Treasury version had proposed full taxation of real capital gains. In other words, the exclusion of an arbitrary percentage of capital gains from taxable income would be ended, but the part of the capital gain that was only due to inflation would not be subject to tax. Recall our example from chapter 3. Holding stock for five years that was bought for $100,000 and sold for $200,000 produces a capital gain of $100,000. If inflation increased prices 25 percent over those five years, $25,000 of the $100,000 gain merely keeps up with inflation and is not an increase in purchasing power. The Treasury proposal would have “adjusted the basis” (the $100,000 purchase price of the asset is the “basis”) for the inflation since purchase. Thus, upon selling the stock for $200,000, the capital gain would have been calculated from the “adjusted basis” of $125,000, the original purchase price plus the amount of inflation that had occurred since then. The tax rate would then be applied to $75,000.33 The problem with this proposal was that it would not have increased revenue as much as abolishing the exclusion without the inflation adjustment. From the point of view of rational tax policy, it is not appropriate to tax nominal gains that exceed real gains. When this is built into the law, the rate of taxation of real increases in income will vary according to how much inflation has occurred while the asset is being held. On the other hand, abolishing the exclusion did dampen “the most common form of tax arbitrage—borrowing to purchase appreciating capital assets and profiting from the tax differential. Legal experts also argue that the capital gains exclusion has caused much of the complexity in taxation.”34 On this ground, we would have to consider it a plus.
However, the strong supply-siders (such as Robert Bartley and Lawrence Lindsey) believed that the end of the capital-gains exclusion was a serious blow to the positive incentive structure that had been put into place in 1981. Bartley argued that “capital gains were especially important to the young entrepreneurial company: this was the pot at the end of the rainbow that moves breakaway engineers to take out mortgages on their homes to start a company.”35 Lindsey argued that raising the capital-gains rate to a maximum of 33 percent (the top marginal rate in the 1986 reform)36 probably would not increase revenue nearly as much as the tax writers believed, and thus he and other supply-siders believed that some capital-gains preference should be reintroduced into the tax system. Though Steuerle is among the tax experts who believe full taxation of real capital gains is the solution, not preferential treatment, he agrees with Lindsey that the revenue impact of full taxation of gains would not be very great. His reason is that capital gains can escape all taxation if the asset is held till death. Thus, people facing a high marginal tax rate should they sell assets and realize a capital gain will have an incentive to defer sales so as to realize gains when they have losses to offset them or when their other income is perhaps temporarily lower. Such a behavior pattern will tend to keep financial capital locked in to currently owned assets, reducing the flexibility of investors.
The dispute between those who wanted to reintroduce the preferential treatment of capital-gains income and those who decried such a move as a tax bonanza benefiting mostly the wealthy has raged ever since the passage of the Tax Reform Act. President George Bush asked for it repeatedly and was rebuffed by Congress. When President Clinton convinced Congress to raise income tax rates in 1993, they kept the top rate on capital gains at 28 percent, creating a small preference. As part of the bipartisan compromise in mid-1997, President Clinton and Congress agreed to a 20 percent maximum rate on capital gains realized after holding an asset for eighteen months.37 In this context it is important to recall that most analysts of the 1986 tax change noted that the major impact of the rise in capital-gains taxation was the decline in the use of many tax shelters. It remains to be seen whether creating a new capital-gains exclusion will encourage the proliferation of tax shelters once again.
Regulation
After the initial efforts to curtail the growth of social regulation, the administration was stymied. Nevertheless, it is important to acknowledge the success emphasized by Murray Weidenbaum in a retrospective analysis.
During the past eight years [1981–88], not a single major new regulatory law has been enacted (although several have been toughened). Nor has a new regulatory agency been established. This has been the first such extended period in the past half century.38
William Niskanen, his former colleague on the Council of Economic Advisers, emphasizes the missed opportunities and concludes about the areas of health, safety, and the environment that the “Reagan attempt to reform these regulations . . . was a near-complete failure.”39 If we observe the actual expenditures on regulatory agencies, we note that the decline in real spending between 1981 and 1984 was reversed briefly in 1985, fell again in 1986, but then rose dramatically in 1987. By 1989, the total expenditure on regulatory agencies was 17.2 percent higher than in 1981.40
These total-expenditure numbers mask mandates imposed on state and local government by Congress that end up increasing the regulatory burden on certain businesses. Perhaps one of the most significant examples is the nursing-home reform contained in the Omnibus Budget Reconciliation Act of 1987, which required that states enforce standards of care, including “nurse staffing, aide training, and patient assessment.”41 The costs of complying with these requirements either squeezed nursing-home profits or caused prices to rise, including the prices paid by Medicaid.
On balance, was the Reagan effort successful because it prevented much greater regulatory activity, or was it a failure because it didn’t reduce regulation in absolute terms? To a certain extent this is the question of whether a glass of juice is half full or half empty. Slowing the growth of regulations, which Niskanen acknowledged did take place, changed the atmosphere under which business operated. Weidenbaum’s emphasis on that should be sufficient for us to conclude that despite the inability to “reform” (critics would claim the effort was to gut them instead) regulations as Niskanen would have wished, the eight years of Reaganomics delivered on its promise to reduce the regulatory burden on business, particularly in the area of health, safety, and environmental protection. This is true even if not one regulation in existence in 1981 were rolled back. The reason is because when businesses are confronted with a new regulation, it takes time for them to find the least costly way of complying with it. Over time, there is a “learning curve,” which simply translates into the idea that doing something over and over again gives one the experience to perfect one’s ability to do it in the best possible way.
To take an example from everyday life, the first time a local town or city institutes a recycling requirement for citizens’ trash collection, there will be difficulties experienced because people are not used to separating different types of rubbish, they do not have the various receptacles in which to store them, and they are not quite sure which items fit where. At first it will be a bothersome, time-consuming pain, and people will make mistakes or sometimes even willfully attempt to circumvent the new rules. As people experience compliance with the rules over the next weeks and months, the separation of trash becomes second nature and therefore less time-consuming. The organization of the various receptacles becomes more efficient and therefore less time-consuming. By the time six months have passed, citizens will probably be spending a negligible amount of extra time separating recyclables from the rest of their garbage. The initial costs to business of newly introduced regulations are akin to the initial bother and time caused by the beginning of a mandatory recycling program. Just as the costs decline for individual citizens, the costs to business decline, provided no new regulations are enacted in the meantime. That is the significance of the eight-year period in which new laws were not passed and new regulatory bodies were not created.
Even with the real increase in regulatory budgets, if we assume a learning-curve process at work, we should conclude that costs of compliance would have declined so that the overall burden of regulation would have declined. Interestingly, in detailing the actual deregulatory accomplishments of the eight-year Reagan effort, the 1989 Economic Report of the President identified only changes in economic regulation.42 Even there, the report concluded on a pessimistic note.
The potential for executive regulatory oversight to impose discipline on the regulatory process is limited. . . . regulatory reform is unlikely to be a high priority for any Administration in the near future because it is hard to convince the public of the need to streamline the regulatory process when specific regulations are at issue. . . . People recognize that in the aggregate many regulations may be burdensome, but almost always a vocal interest group will attempt to block the removal of any single regulation. A second reason is that program advocates in the Congress oppose the consequences of such oversight.43
Perhaps in response to this problem, the incoming Bush administration created the Council on Competitiveness, which for the next four years acted as an “appeal of last resort” for business interests whose “competitive position” might be harmed by new or existing regulations. In addition, during the 1990s, an effort was made to give owners of property the right to block government regulations that would reduce the economic value of that property without compensation. This “property rights” movement was endorsed in the Contract with America.
The Job Creation and Wage Enhancement Act allows private property owners to receive compensation (up to 10 percent of fair market value) from the federal government for any reduction in the value of their property.44
We conclude, therefore, that the burden of regulation was eased somewhat during the 1980s, particularly in the early years of the Reagan administration. For the next decade, there was a major standoff, particularly in the area of social regulation. Neither the Bush administration nor the Clinton administration was able to break that stalemate. The issue of regulation remains quite important. The future course of regulation is unclear as the Clinton administration confronts the Republican majority in Congress once again.45
Redistribution of Income
The rule changes enacted in 1981 in the AFDC program were moderated somewhat in 1984 and then changed significantly in 1988. According to the numerical example referred to in the previous chapter, the Deficit Reduction Act of 1984 and the Family Support Act of 1988 reduced somewhat the rate of benefit reduction faced by a welfare recipient who has an opportunity to take a low-wage job.46
In 1988, the Family Support Act replaced the previously existing Work Incentive (WIN) program with the job opportunities and basic skills training program (known as JOBS). The purpose of this program was to help adults receiving welfare to avoid long-term dependency by providing education, training, and employment. States had to offer the following:
(1) education activities, including high school or equivalent education, basic and remedial education to achieve a basic literacy level, and education for individuals with limited English proficiency; (2) job skills training; (3) job readiness activities; (4) job development and job placement; and (5) supportive services. . . . [They also had to offer] two of the following four activities: (1) group and individual job search; (2) on-the-job training; (3) work supplementation programs: and (4) community work experience (CWEP) programs. . . . States may also offer postsecondary education to JOBS participants.47
This program identified which adults must participate and requires states to achieve 11 percent participation rates of this identified group. By 1991, state reported information suggested that nationally about 15 percent of the nonexempt welfare population was participating in the JOBS program.48 This amounted to 5.8 percent of the entire national AFDC caseload.
After falling in real terms from 1980 to 1985, the average monthly benefit per family and per person rose between 1985 and 1986 before falling through 1990.49 Meanwhile, the number of families participating in the AFDC program fell from 1984 to 85, rose for two years, fell in 1988, and then rose again in 1989. With the beginning of the recession in 1990, AFDC caseloads rose dramatically for the next three years and continued rising through 1994.50 The overall rise between 1984 and 1988 kept pace with the population, as the AFDC caseload remained in the area of 4.5 to 4.4 percent of the total. This dipped to 4.35 percent of the population in 1989, only to rise above 4.5 percent in the recession year.51
We can conclude that despite the moderation of the high benefit-reduction rate for working AFDC recipients, the combination of the OBRA 1981 changes and the continuing decline in real benefit levels constituted a strong disincentive to utilize the welfare system. So how are we to explain the fact that the AFDC caseload as a percentage of the population did not decline? How are we to explain the fact that the AFDC caseload as a percentage of the people in poverty actually rose from 1984 through 1988? How are we to explain the fact that the AFDC caseload of children as a percentage of the children living in poverty also rose?52
There are two possible answers. The attractiveness of AFDC was an “absolute” level of attractiveness. Even if it had been made less attractive than before, the fact that it existed at all made it a magnet because of the difficulties associated with earning a living at some low-wage job. The alternative answer is that the persistence of relatively high unemployment rates for most of the decade made the “choice” to work a harder and harder one. Interestingly, in the years when the unemployment rate finally fell below 6 percent (1988 and 1989), the percentage of the population living in poverty on AFDC stabilized at 34 percent (it actually fell by 0.2 percent between 1988 and 1989).
Regardless of which interpretation one would prefer to accept, it does appear that the initial steps toward making welfare so unattractive that people will voluntarily leave the rolls and find some other method of support was stymied beginning in 1984. This fact shows up in the research of Gary Burtless of the Brookings Institution. He created a trend rate of growth of labor supply that combined participation in the labor market with hours worked. For single women, which includes the majority of the adults receiving AFDC, the trend rate of increase in their supply of labor declined after 1981.
The labor force participation rate of single mothers was 67 percent in March 1988. . . . the rate would have been 69 percent if participation growth had continued at the pace observed in the 1960s and 1970s.53
Recall that the supporters of the Reagan Revolution argued that they were beginning the process of weaning Americans away from the welfare state. Taking only the AFDC program as a case in point, we can conclude that the effort stalled for the rest of the decade. When the economy slipped into recession in 1990 and then experienced the slowest recovery of all the postwar recoveries, the resulting rise in the welfare rolls led the majority of Congress to abandon the approach taken by the Family Support Act.54
Instead of attempting to create incentives for people to voluntarily leave the rolls, the approach put forward by the congressional majority in 1995 was to end the entitlement status of AFDC and substitute fixed payments to the states. Thus, no matter how many people might qualify for welfare, there would be no more federal money. This points up a very serious problem with the desire to reform welfare. To really reform it so that it becomes a bridge to the labor market rather than a permanent fallback position for those unable (or unwilling) to connect productively with the labor market would cost more money than the existing system, not less. It is cheaper to give people money than to train them for a job, find them a job, and give them the child care and medical insurance necessary to have them keep that job.
There is one other very important point, that moving someone from some form of public assistance into the low-wage job market does not reduce poverty. For all of the 1980s, the federal minimum wage remained unchanged at $3.35 an hour. This translates into an income of $6,968 for a year-round, full-time worker. By 1981, this wage had become insufficient to raise a three-person family out of poverty, and while the poverty threshold rose throughout the 1980s, the minimum wage remained the same.55 Though the evidence is clear that a very high percentage of recipients of AFDC left the rolls within two years, it is also true that a high percentage of those people returned to the rolls, in large part because of the inability of the low-wage job market to provide a bridge out of poverty. For many opponents of mean-tested entitlements like AFDC this is all the more reason not to permit people to rely on AFDC. Forcing people to “try harder” in the labor market will be the ultimately successful method of combating poverty.
For mainstream as well as radical critics of this approach, there is a serious omission of the historical context. Before the 1960s, there was a large and growing industrial sector that provided a ladder from low-wage, entry-level jobs requiring no skills up to high-wage, secure assembly line work and beyond. The low-wage market is nothing like that anymore, and to say that poverty results because the poor won’t work in those jobs is nonsense. People do work in those jobs, but those jobs are no longer tickets out of poverty. The modern critics of the means-tested entitlements are in effect complaining that low-wage workers do not try hard enough. This is a prime example of what many social critics have called “blaming the victim.”
In the case of food stamps, we have already noted that both cost in real terms and program participation fell from 1983 through 1987. In 1988, Congress
increased food stamp benefits across the board, liberalized several eligibility and benefit rules, eased program access and administrative rules, and restructured the employment and training program and quality control system.56
The reason for the differing approach to food stamps and AFDC is to be found in a group of beneficiaries of the food stamps program that have not been mentioned in the previous discussion. In addition to helping recipients by increasing their ability to buy food, food stamps help farmers and retailers by increasing the consumer demand for their products. Of this group, farmers in particular are a well-organized, politically potent interest group. Thus, it is not surprising that food stamps were liberalized over the period of the two Reagan administrations, while AFDC continued to be restricted.
In the case of Medicaid, we note that after declining in real terms for AFDC-related recipients between 1981 and 1984, it rose modestly from 1984 to 1988 and then accelerated dramatically from that point onward. Meanwhile, though the other areas of coverage—the elderly, blind, and disabled—did not increase at the same rate, they too experienced accelerations, though for these groups the acceleration occurred after 1989.57 Part of the reason for these increases was that after Congress made a token gesture in the direction of reduced expenditures, they spent most of the decade liberalizing access. In part this was a result of the increasing difficulty of qualifying for AFDC. Since AFDC was the major route to Medicaid, with the reduction in the ability to receive AFDC, Congress began increasing the ability of non-AFDC recipients to qualify.
[T]hese legislative actions fundamentally changed Medicaid program eligibility, in that an individual no longer has to be receiving welfare to qualify for Medicaid. In 1992, about 60 percent of Medicaid recipients qualified for Medicaid by virtue of being on welfare, down from 80 percent in 1984.58
The general trend saw AFDC recipients and other low-income individuals with substantially reduced access to Medicaid, while other population groups increased their access. Between 1984 and 1990, Congress passed ten Medicaid amendments that liberalized access for pregnant women and children.59 This led to an increase in the percentage of the general population covered by Medicaid and an increase in the percentage of the poverty population so covered. However, it should be noted that despite this, in 1990 only 42.2 percent of the poor were covered by Medicaid.60 This created the worst of both worlds, a rising expenditure that was clearly unsustainable on the one hand, and a continuing failure to accomplish its original mission, which was to provide medical care to the poor.
In this context it is important to note that though Medicaid is supposed to be a means-tested program targeted at the poor, many of the elderly who enroll in Medicaid are “poor” only in a technical sense. In order to take advantage of the opportunity to have Medicaid finance long-term care in nursing facilities, many middle-class and even upper-middle-class families have retired elderly parents or grandparents transfer all assets to their children so that their incomes consist of nothing but Social Security and a private pension. They then become eligible for Medicaid assistance in payment of nursing-home fees, while their children or grandchildren get to spend the proceeds of their assets. For many families, this is the only way to protect a lifetime of assets from being dissipated on very expensive long-term care. Nevertheless, it is clear that such activity violates the spirit of the concept of Medicaid. While people might sympathize in general with the idea that a person who has worked hard to build up some assets would like to pass them on to the children and not lose them on astronomical expenditures for a nursing home, the Medicaid program was supposed to finance medical care for people who couldn’t afford it, not for well-off people who wanted to make bequests to their children and therefore didn’t want to pay for it.
Another version of this approach occurs when most assets are transferred years before the need to enter a nursing home, but the individual does begin the stay in the facility as a private purchaser without Medicaid. A process then occurs that is called a “spenddown.” As soon as the cost of the nursing home has depleted assets down to some minimum (usually two thousand dollars exclusive of a home) and the income of the individual from private pensions and Social Security falls below the cost of care, this person qualifies for long-term care assistance under Medicaid, and the state begins to pay for the difference.61
Clearly the problem of middle-class families protecting the assets accumulated by an elderly relative while Medicaid pays for part of their nursing care is a dilemma. This dilemma is increased because Medicare, the non-means-tested medical entitlement, does not cover long-term care in a nursing home. Between 1984 and 1990, aged residents in nursing homes increased Medicaid expenditures on an average of 5 percent each year, and these were people who did not qualify for cash assistance.62 In 1990, payments of nursing-home expenses accounted for approximately 35 percent of the Medicaid budget.63 By the end of the decade the escalation in Medicaid expenditures was bound up in the general escalation in medical costs.
Medicare
Despite the changes in Medicare reimbursements for hospitals, Medicare spending rose from 7.0 percent to 8.8 percent of federal spending between 1983 and 1990. Though this is a significant reduction in the rate of increase, this needs to be compared with the fact that Social Security payments actually fell as a percentage of federal expenditures (from 21.1 percent to 19.8 percent).64 As the percentage of the population over the age of sixty-five continued to rise, the average number of aged with Medicare part A rose from approximately 24.6 million in 1980 to 29.8 million in 1990. The average benefit per aged person enrolled rose 50 percent in real terms over that same decade. Average annual benefit per aged enrollee in Medicare part B rose much faster, 150 percent in real terms.65
Aside from the change in hospital reimbursements in 1983, there were no efforts to deal with the rise in health care expenditures elsewhere in the Medicare system or in general. The Reagan administration developed no policies to stem the tide of medical inflation and never even considered what by the end of the decade was a serious problem, namely the growing numbers of Americans without health insurance. Meanwhile, Americans’ spending on health care rose quite rapidly during the 1980s. Health expenditures accounted for 5.92 percent of GDP in 1965, the year Medicare and Medicaid were enacted. By 1980, that spending had risen to 9.25 percent of GDP. When President Reagan left office that ratio had climbed to 11.51 percent of GDP, and it kept right on climbing through the years of the Bush administration.66
By 1991, this problem became a major issue in national politics. A relatively unknown former director of the Peace Corps, Harris Wofford, won a surprise victory in a special Senate election in Pennsylvania, defeating President Bush’s attorney general, Richard Thornburgh, with the slogan, “If a criminal has a right to an attorney, a citizen has a right to a doctor.” A number of Democratic candidates for president ran in the primaries with promises to introduce some form of national health insurance. Candidate Clinton promised it would be his number 2 priority (after deficit reduction and economic recovery, which he claimed were one and the same). President Bush, meanwhile, offered his own version of health insurance reform in 1992. Interestingly enough, with the defeat of President Clinton’s efforts to get a health insurance bill through Congress, the Republicans in their Contract with America mentioned nothing about reforming the nation’s health care system.67 However, as part of the 1997 budget agreement, President Clinton and Congress agreed to increase spending $24 billion over five years to bring previously uninsured children into coverage.68
Unemployment Compensation
After the economy began to recover in 1983, the unemployment rate began to fall in 1984. However, the rate remained high by historical standards, only falling below 7 percent in 1987. Because the policy of not extending unemployment benefits continued, the percentage of the unemployed receiving compensation payments actually fell during the recovery. In 1983, an average of 44 percent of the unemployed received payments, but that percentage fell to 34 in 1984. For the next four years the average percentage of the unemployed receiving unemployment compensation was below 33 percent. This is in marked contrast to the previous recovery from recession (1976–79), in which the ratio of unemployed receiving payments averaged 52 percent.69 Thus, we can safely say that the Reagan administration persisted in its policy position that unemployment compensation was more a hinderance to fighting unemployment than a help. The approach was to introduce and maintain flexibility in labor markets. Generous unemployment compensation would be particularly counterproductive, according to this perspective, during a recovery because with business beginning to expand output, individuals might be missing out on new career opportunities in rising industries and/or rising regions of the country if they were collecting unemployment checks and hoping for a recall to a job that was gone forever.
Cutting Government Spending
With the failure of the budget deficit to evaporate as the economy recovered from the 1982 recession, and with Congress balking at the specific program cuts proposed by the postrecession Reagan budgets, some members of Congress decided to attempt to legislate a balanced budget. The idea of a constitutional amendment to balance the federal budget had been kicked around before, and in fact it would come to the floor of the Senate in 1986. For a majority of members, this route represented too drastic a step. However, they were willing to try a law mandating a balanced budget (in some target year in the future), coupled with a mechanism to get there. The law, as finally passed, was the Gramm-Rudman-Hollings act, officially called the Balanced Budget and Emergency Deficit Control Act. The law charted reduced maximum targets for the federal deficit through 1991, when it was required to reach zero. The law cap was amended in 1987, and the target year for reaching a balanced budget was delayed until 1993.
To force Congress and the president to arrive at a five-year (then seven-year) program of targeted deficit reduction all the way down to zero, the law provided for automatic across-the-board budget cuts that would have to be divided half and half between the Pentagon and civilian federal spending (with Social Security, interest on the debt, and some programs that benefit the poor exempted). In a book written in 1987, Alan Blinder scornfully explained why a law whose sponsor, Senator Warren Rudman of New Hampshire, called a “bad idea whose time has come” passed with such large majorities:
There were . . . arch-conservatives like Senator [Phil] Gramm [of Texas], who had long been dedicated to shrinking the government.. . . There were traditional Republicans, who were worried enough about fiscal rectitude to favor a tax increase. Exasperated by President Reagan’s stubborn resistance to tax hikes, they hoped Gramm-Rudman would force his hand. Rather than risk gutting his precious defense budget, they hypothesized, the president would cave in on taxes. Let’s call his bluff, they decided.
Democrats, especially in the House, were willing, perhaps even eager, to give the president a Procrustean bed in which to sleep. Let him submit a budget that abides by Gramm-Rudman, they said, and then let him take the political heat. Others guessed, correctly as it turned out, that the Supreme Court would come to the rescue by declaring the law unconstitutional before it could do any harm. They could therefore show the folks back home that they supported balanced budgets without voting to cut a single spending program—a politically alluring prospect.70
As rational economic policy, deficit reduction across the board makes no distinction between extremely valuable government spending (such as on the Federal Aviation Administration, which is responsible for the safety of the flying public) and what might be easily recognized as pork barrel spending (such as dredging a harbor to benefit only the people in that area and indirectly a few transportation companies and customers). The law also required continued deficit reduction, even in the face of recession. It is true there was a weak “escape clause” in the bill, but that could only be invoked if a recession were predicted for the following year. For political as well as technical forecasting reasons, such predictions are almost never made. As Blinder pointed out, the law made no provision for increased deficit spending during the first years of a recovery, when reducing the deficit would work to slow and possibly end that recovery.71
Supporters of the law argued that the whole purpose of building in the automatic reductions was to force the president and Congress to agree on a budget that met the target without triggering those re-ductions. In the end, that did not happen. During the first budget go-round (1986), Congress passed a budget resolution hitting the Gramm-Rudman deficit target for fiscal year 1987 ($144 billion). However, President Reagan refused to accept that budget because it raised taxes and cut defense too much. Congress, in what was becoming known as budget gridlock, refused to permit defense spending to escape the budget-cutting ax and refused to continue cutting domestic programs as in the first Reagan budget. The impasse lasted until after the fiscal year had already begun. Then Congress came up with a budget that appeared to fit under the Gramm-Rudman deficit limit,72 and it was passed as a continuing resolution in November 1986. When the deficit began to exceed the predictions, the time for automatic reductions had passed.73
In 1986, the Supreme Court had declared the automatic mechanism for cutting spending unconstitutional. Congress claimed they were going to “fix” the law by creating a new automatic mechanism. They did that in 1987 and stretched out the time for the achievement of a balanced budget. The automatic spending cuts or “sequester” were granted the president rather than the comptroller of the currency, as in the original law.74 The act remained the law of the land up until the passage of the Deficit Reduction Act in 1990.75
The Thrust of Policy, 1981–89
After reviewing the evidence from both this and the previous chapter, it seems fair to say that on balance, the Reagan-Volcker program was able to move the policy regime in the directions outlined by the conservative critique of the pre-1979 economy detailed in chapter 3. The tax system became less progressive, and marginal tax rates, particularly at the high end, came down. Inflation was reduced dramatically and stayed low. Regulatory growth was stopped, and there was some reversal of the burden of regulation, if only as a result of the learning curve. Redistribution of income to the poor and unemployed was reduced compared to previous periods. There even was the first small step toward making Social Security means tested by the imposition of a tax on some benefits. Meanwhile, federal government spending on nondefense, noninterest, non–Social Security areas of the budget were cut, in some cases quite drastically.76 This policy regime was the subject of extraordinary controversy during its operation, and that controversy continues to this day.