28
The trouble with moving upmarket
Poverty rates in Britain declined from 1968 to the late 1970s, but since then have risen continuously. Our report for the Joseph Rowntree Foundation1 shows how this trend has been accompanied by a rise in the geographical segregation of the poor from the rich – where the two groups live physically apart.
There is some good news, though. In the most recent period, the number of households with people who are the poorest – income poor, materially deprived and subjectively poor – fell, and such very poor households also became less geographically concentrated. It has become evident that government policy can reduce that gap.
The people in the most geographically segregated social group are those who were so wealthy that they could afford to exclude themselves from the schools, hospitals, cleaning, childcare, recreation and other norms for most people in society. As they grew wealthier, however, the richest did not grow greatly in number, but became corralled in fewer and fewer parts of the country.
At the extreme end are the most affluent parts of, for example, the Mole Valley in Surrey, and Chesham and Amersham, in Buckinghamshire. In 1980, a majority of the population in these places were neither rich nor poor. Now only a quarter of households there are non-poor, non-wealthy, while more than a third in these areas are counted in our most exclusively wealthy category. Today, the majority of people living in the most expensive areas will have moved there over the last few decades, making such places unaffordable to almost everyone else. In a more unequal society, everyone is less free to choose where they live.
In the most recent period, we saw for the first time large parts of many cities with more than half the population becoming poor. In these places, it is, in effect, now normal to be poor.
This is hardly surprising, given that just over a quarter of households nationally are poor and that there has been a rise in geographical segregation both of rich and poor over time. You would have to spread the poor very evenly in fictional mixed communities to hide concentrations with such a high national poverty rate – high both by international and historic standards.
Table 1: The most divided constituencies in Britain 1980-2000
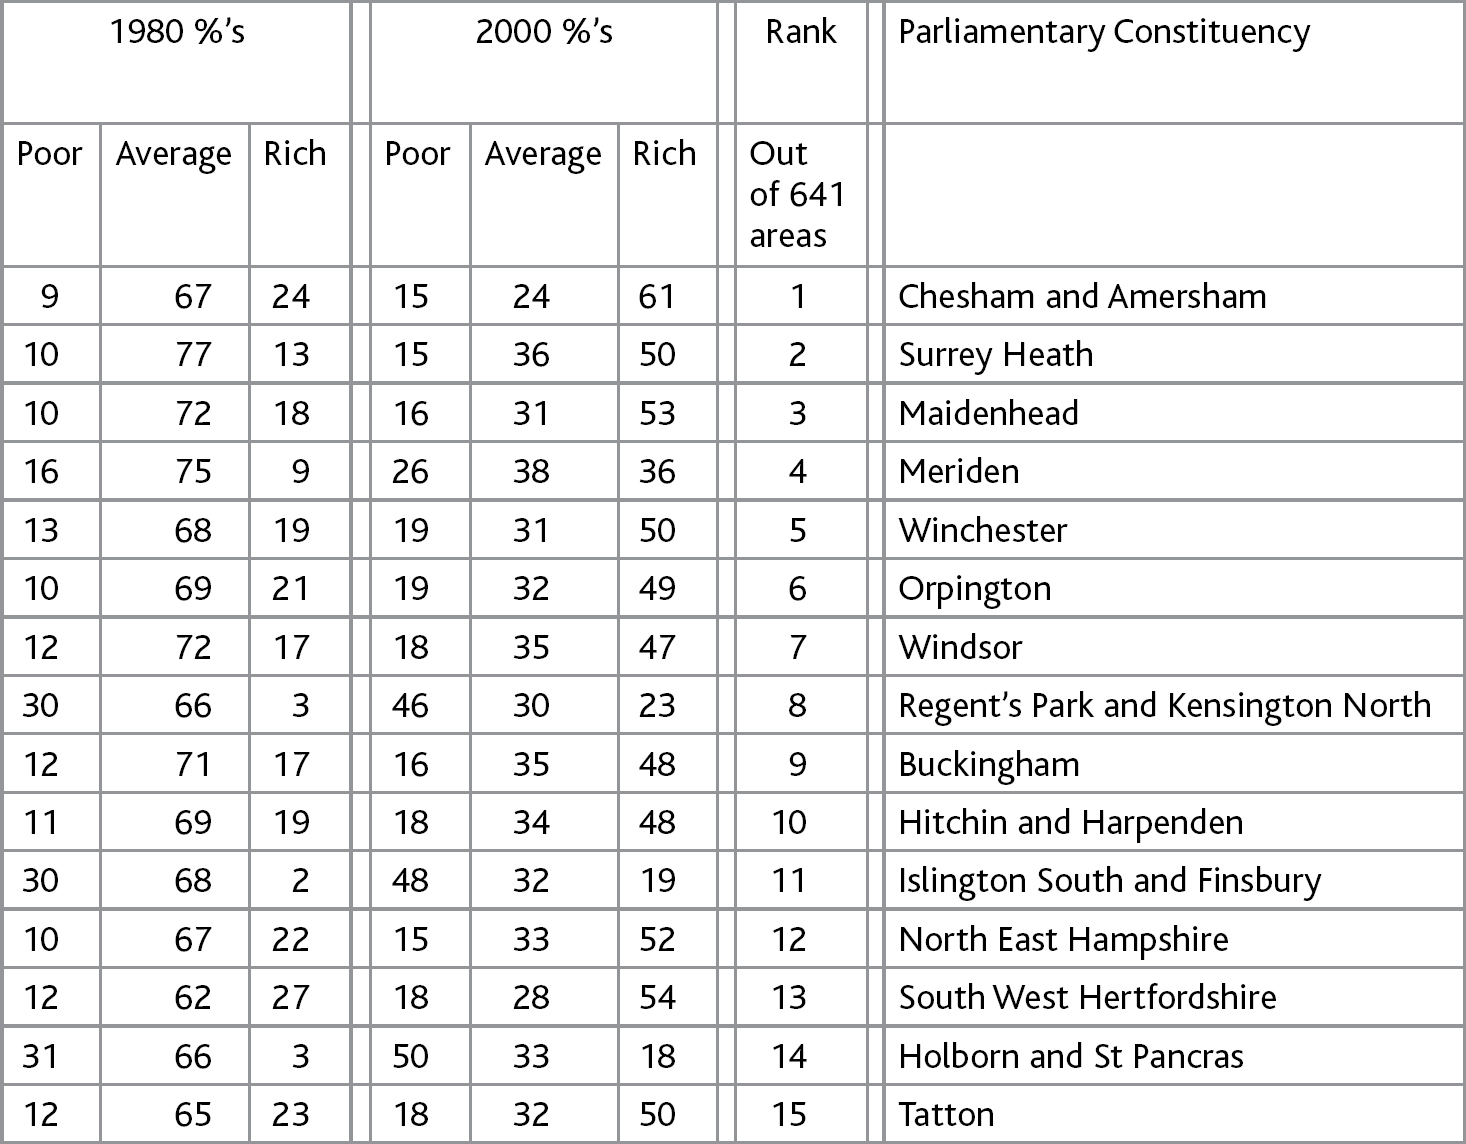
Note: The proportions in the three 1980s and three 2000 columns each sum to 100% (other than due to rounding). These are the 15 Constituencies with the greatest loss of households living in average circumstances in Britain 1980–2000.
It took a long time to pull together information from four surveys of poverty and four censuses, to collect other data on consumption and the assets of the rich, and to merge them to produce a picture of Britain that allows our changing geography of wealth and poverty to be mapped over thousands of communities in comparable ways for the first time in such detail.
The most obvious result is that you cannot expect to reduce poverty and the spatial concentration of poverty while wealth becomes more concentrated, both socially and spatially.
Poverty was at its minimum in the last 40 years when fewest people were so much wealthier than the average. Poor and wealthy were less geographically segregated from the rest. Given current trends, only a minority of people may soon live in “normal” households. The majority will either not be able to afford to live a normal life – to avoid debt and take a holiday, or, at the other end of the scale, they will be concerned about inheritance tax, buying their way out of state provision, and how many holidays a year they can take.
That future has already arrived in London, where rich and poor jostle together most closely. And if the long-term trends we have identified continue, then socially much of the rest of the country will start to look that way. So why let things carry on polarising when we can see that we are heading in the wrong direction?
Exclusive enclaves
- Chesham and Amersham in Buckinghamshire has seen the greatest polarisation between rich and poor in England and Wales since 1980. Then, 67% of its households were living in “normal” circumstances (neither rich nor poor). By 2000, that figure had plummeted to 24%. A quarter of households were rich in 1980, but this had soared to 61% by 2000. Meanwhile, the proportion of poor households went from 9% to 15%.
- Other areas with dramatic recent concentrations of wealth include Surrey Heath (13% rich in 1980 to 50% by 2000) and Maidenhead (18% to 53%).
- Few exclusive enclaves are found in the North. One area which makes it into the top 15 constituencies of areas to have lost the greatest number of average households since 1980 is Tatton in Greater Manchester where half the population were rich by the year 2000. Two decades earlier less than a quarter had been so well off.2