11
Holed and Bolted Plates
11.1. Calculating holed composite plates
So far, we have seen how it is possible to determine the fracture, and moreover the RF, of a composite laminate subject to a given load. In reality, before applying these criteria, we must determine the stress field, which will obviously vary depending on the location of the structure. To determine this stress field, i.e. here the resultant force and moment, we generally use the finite element method. However, the finite element method presents various drawbacks.
One such disadvantage is the time it takes to calculate. The most obvious case is that of sizing bolt or rivet holes in aircraft structures. Keeping in mind that a standard passenger aircraft counts upward of a million rivets, it is obviously out of the question to mesh every single hole to determine the stress field at the hole edge. We therefore use either an analytical method to determine the stress field at the hole edge, knowing the far-field stress, or a hole ratio using a test or a finite element model surrounding a reference hole.
Another disadvantage is the representativeness of the finite element models in the areas of stress concentration. It can be demonstrated that in these areas, the behavior of the composite is more complex than the simple elastic behavior law and plate model raised in this lesson, and that it is then necessary to use complex 3D models to account for composite damage and achieve better realism. We note that using only an elastic behavior law and a plate model to simulate the behavior of the composite in the areas of stress concentration results in efforts far greater than in reality (which are smoothed by damage), which leads to the structure being oversized. This phenomenon can be compared to the plasticity phenomenon encountered in metallic structures; the plasticity reduces overstressing at singular areas (hole, crack, notch, etc.). These damage or plasticity effects must therefore be seen as beneficial (in general), which help smooth the stress in critical areas.
Let us take the case of a holed laminate composite plate subject to a tensile loading.

Figure 11.1. Holed plate under tension. For a color version of this figure, see www.iste.co.uk/bouvet/aeronautical2.zip
We obviously observe a stress concentration at the hole edge due to the presence of the hole. We note that reasoning tends to be with average stress in the thickness of the laminate (σx0), but keep in mind that this stress does not apply to the material: certain plies support more stress than others, and it is also forbidden to apply a fracture criterion directly to this average stress, without first determining the stress in each ply. Furthermore, index 0 is generally omitted in order to simplify notations (this will be the case in the present work), but should not be forgotten all the same!
We can determine analytically the stress field at the hole edge for an infinite plate:
Where R is the radius of the hole,  is the stress away from the hole, y is the coordinate of the considered point (varying between R and +∞ at the hole edge) and
  is the stress concentration ratio at the hole edge, expressed as:
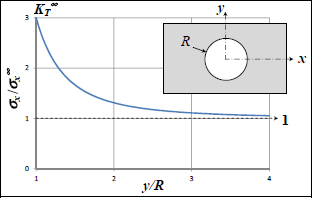
Figure 11.2. Stress concentration at hole edge for an isotropic material
This stress concentration ratio represents the overstress at the hole edge, in relation to the stress away from the hole. Coefficients Ex, Ey, νxy and Gxy obviously represent the equivalent moduli of the laminate. It should be noted that this calculation is only valid if the orthotropic axes of the laminate coincide with the stress coordinate system (x, y).
This stress concentration ratio is equal to 3 in the case of an isotropic material; in other words, the stress at the hole edge is three times higher than the stress in the absence of a hole. In the case of an isotropic material (Ex = Ey = E and G = E/2/(1+v)), we then get:
Nonetheless, we note that in the case of an orthotropic material, the stress concentration is higher if the ratio of 0° plies is high. Take, for example, T300/914 that we mentioned previously:
If we use a stacking sequence with 100% of plies at 0°,  reaches 7.5, whereas it is only at 2.2 with 100% of plies at 90°!
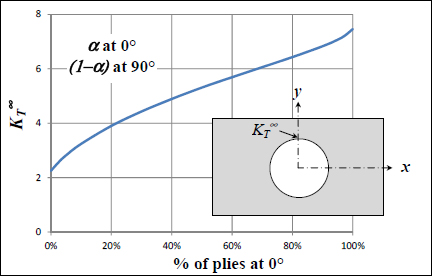
Figure 11.3. Stress concentration ratio at the hole edge depending on the stacking sequence
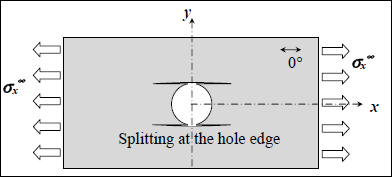
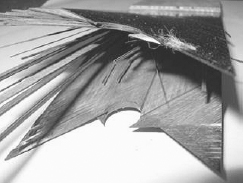
In practice, this coefficient of 7.5 in the case of a stacking sequence with 100% of 0° ply is to be taken with a pinch of salt, because the hole edge will experience a type of damage called splitting, which reduces this stress concentration. Furthermore, a laminate with 100% of its fibers at 0° doesn’t really make sense; this type of stacking is too sensitive to matrix cracking and is always supplemented with at least a few plies at 90° and at ±45° which will reduce the stress concentration ratio.
Another important effect is that of the width of the specimen noted W. We thus define the net stress  as the average stress through the net section:
Where D is the diameter of the hole and W the width of the plate. We verify that these two stresses are equal for W >> D.

Figure 11.6. Principle of net stress in a holed plate under tension
Nonetheless, we can demonstrate that to account for the width of the specimen, it is best to do it via the intermediary of a coefficient β, known as the shape factor:
With:
Once again, we verify that β tends towards 1 when W >> D. This coefficient is slightly weaker than the net stress coefficient. Also, the tendency is to trace the inverse of these coefficients so as to evidence the linear character of the section reduction ((W–D)/W), rather than the inverse of the shape factor coefficient (1/β).

Figure 11.7. Comparison between net stress and shape factor coefficient. For a color version of this figure, see www.iste.co.uk/bouvet/aeronautical2.zip
We note that in this case, the stress concentration ratio at the hole edge becomes β. rather than
  !
!
Considering that the concentration ratio for  is 3 (in the quasi-isotropic case), one could think that a holed plate would support three times less stress than a plate with no hole. However, the calculation that determines the stress at the hole edge is only true if the material is linear elastic, and if the plate remains a plate. And, at the hole edge, the material suffers damage. Therefore, not only does the material’s behavior stop being linear elastic, but the plate theory we just presented is no longer valid (in particular, the damage at the hole edge will cause small delaminations and the laminate plies will therefore no longer be perfectly joined, and the homogeneous strain model in the thickness for a membrane loading will no longer be valid).
To take the effect of damage into account, we use the theory of “point stress”. This theory consists of considering that the stresses calculated are only valid at a distance d0 of the hole.
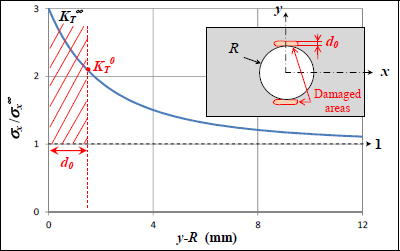
Figure 11.8. Principle of the “point stress” theory. For a color version of this figure, see www.iste.co.uk/bouvet/aeronautical2.zip
We thus define a stress concentration ratio  , lower than the previously used
  , and much closer to reality! All that remains is to determine the d0 in order to account for the experimental observations, and this is where the real problem with this method lies: how does the d0 vary with experimental conditions? In practice, this d0 will indeed vary with the type of stress (tension, compression, shear, etc.), the stacking sequence, thickness, material, etc.
Values in the order of 1 to 2 mm are often used for standard aircraft cases (carbon/epoxy type material T300/914 with a thickness of a few millimeters). This d0 can be seen, upon first glance, as the size of the damaged area at the hole edge on which the plate theory used for the calculation of composite laminates is not valid. In reality, though, the problem is more complicated, as d0 is simply repositioned to identify the experimental fracture. In practice, this calculation method works quite well and is widely used in the aviation industry. Nonetheless, the value of d0 remains to be determined in the most varied cases possible, depending on the thickness, the material, the stacking sequence, the diameter of the hole, the type of drilling used, etc.
Take, for instance, the following example:
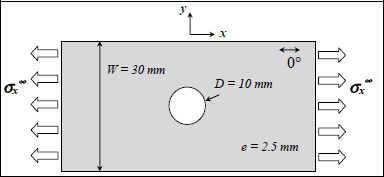
We then obtain β = 1.15 and:
when considering an isotropic laminate. However, if we take d0 = 1.5 mm, we then obtain:
Which means that this laminate will break for a stress 2.26 times lower than in the absence of a hole (and not 3.52 times as  would have led us to believe). This result complies better with the experimental results.
Another important effect for composite laminates is the “hole size effect”. It is characterized by the fact that the composite is less sensitive to a small hole than a large one. Note, however, that to compare different hole sizes, one must either consider an infinite holed plate, or use a constant W/D ratio (or we’ll just be observing that a small hole removes less matter than a large one!):


This phenomenon is evidenced by the point stress. The stress distribution depends only on y/R, and will therefore be the same regardless of the size of the specimen if traced according to y/R, but will be much more sudden if traced according to its true size (according to y) for a small hole:

Figure 11.12. Influence of d0 in calculating the hole size effect under tensile loading. For a color version of this figure, see www.iste.co.uk/bouvet/aeronautical2.zip
Thus, taking the stress at a constant distance d0 from the hole edge, the stress will be lower for a small hole. This type of behavior is very different for metallic materials for which the size has no (or little) effect on the resistance of a hole (obviously if the size is considered large compared to the size of the grain, typically a couple tenths of a millimeter, which is widely acceptable for structures that are more than one millimeter thick).
The point stress method can also be generalized whatever the load, on the condition that it is applied to every direction of the fibers:

Figure 11.13. Point stress method for different orientations of the plies. For a color version of this figure, see www.iste.co.uk/bouvet/aeronautical2.zip
We must then verify the point stress criterion for two points located at a distance d0 of the hole:
- – in the direction y for the plies at 0°;
- – in the direction x for the plies at 90°;
- – in the direction at –45° of x for the plies at 45°;
- – in the direction at 45° of x for the plies at –45°.
11.2. Calculating the multi-bolt composite joints
The aforementioned point stress methods are widely used for empty holes, but less so for bolt or rivet holes. These holes are obviously filled by the bolt or rivet, and then referred to as filled holes. The presence of tightening and potential washers will obviously modify the way the stress travels through the composite, and it can be delicate to take into account using the point stress method. In the case of a bolt composite joint, the point stress method is therefore often substituted for an equivalent stress method, which we will be describing here. Keep in mind, however, that the choice between these two methods often comes down to the habits of engineering firms rather than any actual advantages/disadvantages of either method.

Figure 11.14. Blind fastener Fybrflush® (www.ahg.fr). For a color version of this figure, see www.iste.co.uk/bouvet/aeronautical2.zip
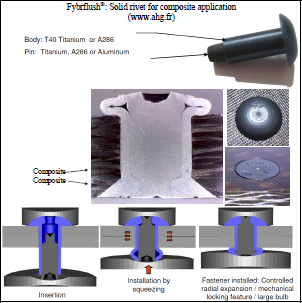
Figure 11.15. Application of a Fybrflush® blind fastener (www.ahg.fr). For a color version of this figure, see www.iste.co.uk/bouvet/aeronautical2.zip
One common approach often used to size filled holed plates is based on the hole ratio. This hole ratio is defined as the relation between the stress limit with the hole  and the stress limit with no hole
  :
:
This hole ratio is therefore far lower than 1 (unlike the stress concentration ratio). It can be compared, upon first glance, to the inverse of the aforementioned stress concentration ratio, specifically the inverse of the stress concentration ratio at a distance d0 from hole  .
.
We can thus define an equivalent stress,  , defined as the stress that will lead to the same amount of damage (or the same RF) as with no hole:
Furthermore, in order to take into account the effect of the width of the specimen, we use net stress:

Figure 11.16. Principle of equivalent stress for the calculation of a bolt composite joint
In practice, the hole ratio is determined by an experimental test, then used to define an equivalent stress. This ratio is approximately αt = 0.6 under tensile loading, αc = 0.85 under compressive loading and αs = 0.6 under shear loading. The presence of the hole is less disturbing under compression as the bolt supports part of the load.
This is the same as saying that a filled holed plate will break 1/0.6 = 1.67 times earlier under tension (or shear) and 1/0.85 = 1.18 times earlier under compression. As with the d0, all that remains is to determine these ratios αt, αc and αs which can depend on the thickness, the stacking sequence, the material (of the laminate, bolt or rivet), the type of bolt or rivet, the tightening, etc.
This type of approach characterizes the net section fracture of the structure. In the case where the bolt is loaded, we would need to make sure the bolt composite joint will not break under different fracture modes. There are four primary fracture modes for a bolt composite joint:
- – Net section fracture that we have just mentioned. It primarily concerns plies at 0° that support most of the stress along x-direction (this is only true for standard stacking sequences containing a minimum of plies at 0°).
- – Bearing fracture. This one is due to high compressive stress existing at the contact between the bolt and the composite laminate. It primarily affects plies at 0° and at ±45° which support most of this stress.
- – Shear out fracture. This is due to high shear stress τlt generated in the plies at ±45°. It is observed when the distance L between the hole and the side of the plate is low.
- – Cleavage fracture. This is due to the stress along the y-direction generated by the load on the bolt. These forces cause stress that is mainly supported under the form of longitudinal stresses σl by the plies at 90°. This fracture is observed when the distance L between the hole and the side of the plate is low.
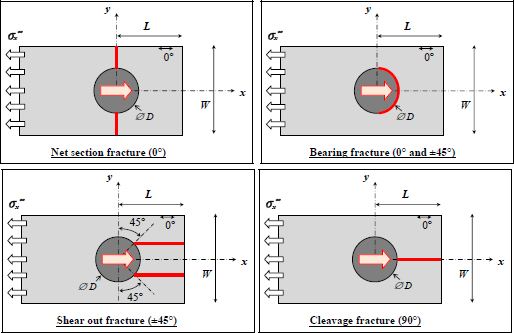
Figure 11.17. The four primary fracture modes in a bolt composite joint. For a color version of this figure, see www.iste.co.uk/bouvet/aeronautical2.zip
Let us compare the filled hole tension loaded with far-field tensile stress with that of a filled hole tension loaded via the intermediary of the bolt. We must obviously have F =  .W.e (where e is the thickness of the plate) to verify the equilibrium equation.

Figure 11.18. Filled hole tension with non-loaded bolt a) and loaded bolt b). For a color version of this figure, see www.iste.co.uk/bouvet/aeronautical2.zip
If we model this problem with the finite element method, using a quasi-isotropic stacking sequence (Ex = Ey = 50 GPa) and a far-field tensile stress σx∞ = 100 MPa, we then obtain the following mean stress fields (once again, this is the average stress throughout the thickness of the laminate):
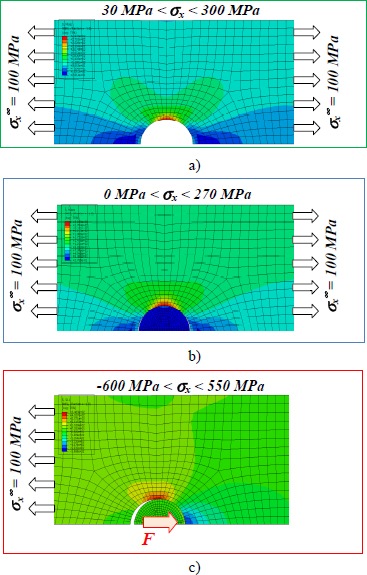
Figure 11.19. Open hole tension a), filled hole with non-loaded bolt b) and loaded bolt c). For a color version of this figure, see www.iste.co.uk/bouvet/aeronautical2.zip
If we now perform a cut at x = 0 (at the hole edge) of the stress field, we get:
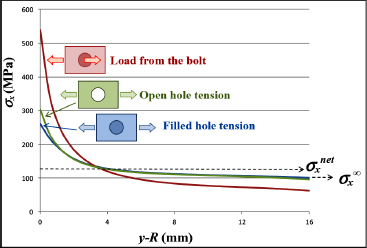
Figure 11.20. Stress at the hole edge of an open-holed plate, filled hole with non-loaded bolt, and with loaded bolt. For a color version of this figure, see www.iste.co.uk/bouvet/aeronautical2.zip
We observe that the maximum stress is far higher when the stress is introduced into the bolt (550 MPa) compared to the case where the load is introduced by a far-field tensile stress (270 MPa). We also observe that the stress, when there is no bolt (300 MPa) is slightly higher than when there is a bolt (270 MPa). Lastly, we also note in this graph that stress σx tends towards σx∞, far from the hole for the case of far-field tensile loading, and towards a much lower value for the case where the tensile loading is imposed by the bolt. We can also demonstrate that the average stress on the net section is equal for all three cases with net stress, or 125 MPa.
To account for this overstress of the case where the load is introduced by the bolt, compared to the case of far-field tensile loading, we define an equivalent stress as:
Where Kb is the bearing ratio and σb the bearing stress defined as:

Figure 11.21. Principle of equivalent stress for calculating a bolt composite joint. For a color version of this figure, see www.iste.co.uk/bouvet/aeronautical2.zip
This bearing stress is the average contact pressure experienced by the bolt. We restate that if the contact pressure was constant over a half cylinder and always normal on the surface, then this formula would be correct (you can in fact obtain it by integrating a constant and a normal pressure to the surface). In practice, the pressure distribution is more sinusoidal, and therefore this formula gives us (as its name would indicate) the average of this pressure.

Figure 11.22. Bearing stress. For a color version of this figure, see www.iste.co.uk/bouvet/aeronautical2.zip
The next step is to experimentally determine the bearing ratio Kb in order to define the equivalent stress. In practice, this ratio is in the order of 0.2, but can obviously vary depending on the material, the thickness, the stacking sequence, etc.
If we return now to our example, that would give us, for the following equivalent stresses:
- –
 = 208 MPa in the case of the far-field tensile loading;
 - –
 = 375 MPa in the case of the loaded bolt.
Once again, the stress is higher in the case of the loaded bolt, as observed by the finite element method. These stresses can be compared to one of the point stress methods by realizing that they correspond to stress obtained at approximately 0.5 mm from the hole; this would be the same as using a point stress of d0 = 0.5 mm. This remark should nonetheless be used with caution, as it is the tests that dictate the results. Do not forget that a method remains valid until proven false! In sum, comparing these different sizing criteria with experimental results will allow us to evaluate the parameters (αt, αs, αc, Kb and the stress limits) and assess their relevance.
This equivalent stress method helps size a bolt composite joint to the net section; it now remains to verify that other fracture modes are not met. The bearing fracture model is simply verified by comparing the average bearing pressure to an acceptable pressure:
Where  is the bearing limit stress obtained experimentally. This calculation can appear surprising since we know that the distribution of bearing stress is more sinusoidal than constant. However, at the same time, the bearing limit stress is obtained experimentally with the same hypotheses and during a similar test, meaning the procedure is consistent. The objective here is to demonstrate that this bearing limit stress does not vary too much depending on the thickness, the stacking sequence, or the type of bolt or rivet. In practice, the order of magnitude for this stress is near 600 MPa (or –600 MPa to be precise, since it is a compression stress).
We note that it corresponds to an intermediary value between the compression stress limit of the fibers and the compressive limit stress of the resin. For example, for T300/914 and using a quasi-isotropic stacking sequence, if we consider that only the fibers that are perpendicular to the load will break under fiber fracture, and that the other directions will break under resin compressive fracture, we then get:
In other words, regardless of the direction of the bearing, and for a quasi-isotropic stacking, 25% of fibers will work in the direction of the fibers and 75% in the direction of the resin. This reasoning is coherent and gives us the first estimate of the bearing limit stress. We also note that following this reasoning, the bearing limit stress will vary depending on the stacking sequence and the direction of the load, if the stacking sequence is non-isotropic.
Lastly, the bearing limit stress varies depending on the tightening of the bolt: the tighter the bolt (until a certain point), the higher the bearing limit stress. The value of –600 MPa corresponds to a standard aircraft tightening, and can be twice as low in the absence of tightening (in other words, it becomes closer to the compressive limit stress of the matrix).
Having demonstrated that the bolt composite joint resisted bearing, it now remains necessary to demonstrate that it withstands the last two load cases, which are the shear out fracture and the cleavage fracture. In practice, these two cases are covered by net section and bearing sizing. But this result is true only if the edge distance is not too small and if there is a minimum number of plies at ±45°. In conclusion, the result is true if the aviation guidelines are respected. In practice, the edge distance must be at least equal to approximately three or four times the diameter of the hole in every direction.
If we now trace the limit stress of a multi-bolt composite joint (sized by the limit stress of the material) according to the ratio of the diameter to the width, we obtain the following curves:
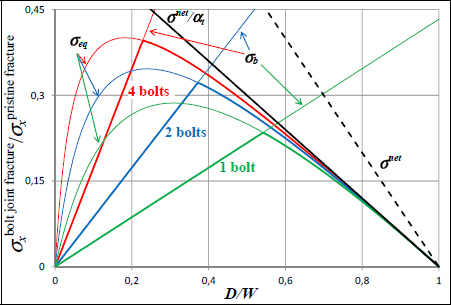
Figure 11.23. Sizing of a multi-bolt composite joint depending on the number of bolts. For a color version of this figure, see www.iste.co.uk/bouvet/aeronautical2.zip
These curves help define the efficiency of a multi-bolt composite joint depending on the D/W ratio. We note that for high D/W values, the net section criterion (i.e. in equivalent stress) is the one that limits the bolt joint’s resistance, while as for lower values of D/W, it is the bearing that limits the bolt joint’s resistance. To increase the bolt joint’s resistance, the solution is to increase the number of bolts (in the direction of the load) in order to limit the amount of stress being transmitted by each bolt and tinker with the D/W ratio. We note that even with four bolts, the stress does not distribute evenly; the first bolts (in this example, bolts 1 and 4 of Figure 11.24) transmit more load than the others. In practice, this ratio depends on the stiffness of the plates, the bolts (or rivets), the tightening, etc., and a value of approximately 30% for the first bolts and of 20% for the others is a good order of magnitude (Figure 11.24).
Considering the previous figure, we understand why a D/W ratio in the order of 0.2–0.25 is currently used; it is the value that maximizes the resistance of a multi-bolt composite joint. We also note that in order to avoid having an overly sudden fracture, we will favor bearing a fracture that is more progressive than a net section fracture. Lastly, we see that again increasing the number of bolts does not have much impact on the overall resistance of the bolt joint.
The D/W ratio of the bold joint can be seen as the distance (in the perpendicular direction to the load) between two consecutive bolts. In practice, a ratio of 4 or 5 is commonly used; meaning that the pitch distance between two consecutive bolts is in the order of four or five times the diameter (D/W ≈ 0.2–0.25). This order of magnitude of the pitch distance between two consecutive bolts is also a good order of magnitude for the pitch distance used in the direction of the load.
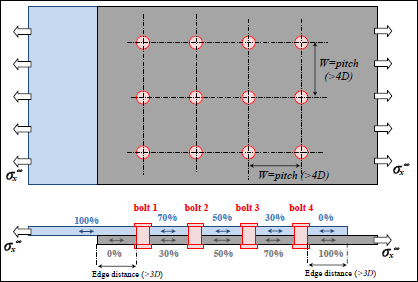
Figure 11.24. Diagram of a multi-bolt composite joint with the bypass loads. For a color version of this figure, see www.iste.co.uk/bouvet/aeronautical2.zip


