Meteorological and Hydrological Hazards
Hurricanes, Sea Level Rise, Floods, Drought, Wildfire, Tornadoes, Severe Winter Weather, and Extreme Heat
What You’ll Learn
• The difference between meteorological and hydrological hazards
• Characteristics of hurricanes
• Types of flooding and the relationship between floodplains and floods
• The rating systems used to measure the intensity of hurricanes, tornadoes, and windchill
• The types of severe winter hazards common in the United States
• Wildfire conditions and characteristics
• The types of drought and their impacts on society
• The effect of sea level rise on coastal flooding
• The influence of climate change on meteorological and hydrological hazards
Goals and Outcomes
• Select the appropriate tools to measure meteorological and hydrological hazards
• Examine patterns of human activity, such as development, taking into account the potential for natural hazards
• Evaluate the use of rating scales and weather patterns used by managers responsible for community safety
• Assess how climate change may cause an increase in the intensity or frequency of natural hazards
This chapter examines several weather-related hazards and how they can affect a community. We classify these hazards as either meteorological, meaning they are due to processes in the Earth’s atmosphere, or hydrological, which result from the Earth’s water systems. This chapter focuses on the following major meteorological and hydrological hazards: hurricanes, sea level rise, floods, drought, wildfire, tornadoes, severe winter weather, and extreme heat. Although wildfire is not necessarily caused by weather patterns, it is included in this chapter because certain weather conditions must be present for wildfire to occur. We discuss some of the main characteristics of these natural hazards, what to expect during the course of a hazard event, how the hazards are ranked in terms of severity, and some of the impacts they can have on our communities.
3.2 Weather-Related Natural Hazards
Between the years 1980 and 2012, there were 144 disasters in the United States that reached over 1 billion dollars each in damages as a result of weather-related natural hazards.* In 2005, a single weather-related event by the name of Hurricane Katrina exceeded all of the previous disasters in this category in terms of property damage and lives lost, resulting in a total estimated cost of $125 billion. In 2012, Hurricane Sandy caused extensive damage along the northern stretches of the Atlantic seaboard in a region that is no stranger to weather-related events but that was not prepared for the scale of damage that occurred from this extremely large storm. Other parts of the country have experienced their share of weather phenomena—including massive flood events and devastating tornadoes in the Midwest, blizzards and ice storms in the north, and highly destructive wildfires in the western states. It is clear that hazards present serious problems for communities throughout the country. These and other weather-related hazards fall into two major categories:
• Meteorological hazards: A weather event that occurs because of processes in the Earth’s atmosphere.
• Hydrological hazards: A weather event that occurs as part of the Earth’s water systems.
It is possible (and common) for an event to fit within both categories. The most prevalent meteorological and hydrological hazards that occur in the United States include the following:
• Hurricanes
• Storm surge
• High winds
• Torrential rain
• Tornadoes
• Waterspouts
• Floods
• Nor’easters
• Severe winter weather
• Freezing rain
• Snowstorms
• Blizzards
• Windchill
• Extreme cold
• Drought
• Heat wave
• Hailstorms
• Lightning storms
• Severe thunderstorms
• Fog
• Avalanche
• Sea level rise
In this chapter, we focus on the hydrological and meteorological hazards that occur most frequently throughout the country, have the highest probability of causing significant damage to property, and pose the highest risk to human life and safety. The ultimate goal of learning about weather-related hazards is to be able to lessen their impacts on our communities through mitigation and preparedness activities that specifically target the conditions in a particular area.
Throughout this chapter, we also describe how these natural hazards are changing over time as a result of climate change. Climate describes the long-term average of weather conditions such as temperature, wind, and rain at a certain place. As the global climate changes, the likelihood of many weather events such as flooding or extreme heat tend to change as well. Of particular concern for coastal communities is the effect of climate change on the ocean, as the rate of sea level rise is expected to accelerate. It is important to note that the impacts of climate change are not identical in every community or every region. For more specific information about the likely climatic shifts in your community and the impact this has on natural hazards, contact your state climate office: http://www.stateclimate.org/.
CHOOSING A WAY OF LIFE
Awareness of the high probability of hurricanes and other coastal storms on the Atlantic and Gulf Coasts is vital to reducing the impacts of wind, waves, rain, and storm surge on properties located along the shoreline. In some coastal communities, regulations and/or personal choice have led residents to adopt various measures to protect property. In towns such as Gulf Shores, Alabama, structures are built on stilts to reduce the risk of flooding caused by hurricanes. Although these beach houses appear to be perched on top of toothpicks, the stilts are effective in elevating the first-floor of the structure above expected flood heights, offering a degree of protection during storms. Many homeowners also install permanent storm shutters on the exterior of the building or have plywood ready to install over windows and doors when coastal storms are predicted. These prepared residents have learned from first-hand experience or from the experience of others that slab-on-grade buildings are not safe in flood-prone areas, or that merely taping windows is not an effective way of preventing damage from hurricane-force winds. These examples indicate the wide range of choices available to property owners living in vulnerable locations such as the coast; property owners can make beneficial choices if they are knowledgeable about natural hazards and their potential impacts on people and property. We will discuss these and other mitigation and preparedness tools in later chapters. For now, we focus on the hazards’ physical characteristics and their impacts on society.
SELF-CHECK
• Define meteorological hazards and hydrological hazards.
• List examples of meteorological and hydrological hazards.
• Explain why a basic knowledge of weather-related hazards is necessary for carrying out hazard mitigation and preparedness activities.
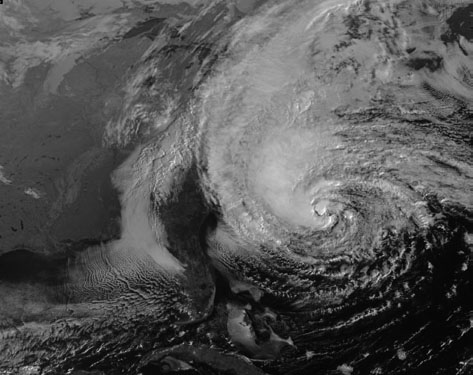
A hurricane is a revolving mass of wind that circulates around a calm center called the eye, which can be 20–30 miles wide. The eye is surrounded by rain bands that extend in spirals outward from the center of the storm. Hurricanes are extremely powerful forces that can last for more than 2 weeks over water and can extend across 400 miles. Because hurricanes are large, moving storm systems, they can affect entire states or regions. Not only is coastal development affected, but areas far inland can also suffer direct impacts from hurricanes, including high winds and torrential rain.
Hurricanes originate in tropical ocean waters poleward of about 5° latitude. Thus hurricanes are also referred to as tropical cyclones. Hurricanes are “heat engines,” meaning they are fueled by the release of latent heat from the condensation of warm water (see Figure 3.1). These conditions exist in tropical areas and supply the energy necessary for a hurricane to form. The prime season for ideal hurricane conditions lasts from June 1 through November 30. This means the hurricane season comprises 6 months out of every calendar year; much of this period coincides with peak tourist season in many hurricane-prone coastal areas.
Hurricanes begin as tropical depressions. If the proper conditions are maintained, a depression can develop in a tropical storm and then intensify to full-blown hurricane status. Hurricane formation requires the following conditions:
• Sufficiently warm sea surface temperature.
• Atmospheric moisture from seawater evaporation.
• A low-pressure disturbance.
• Weak vertical wind shear in the lowest 50,000 feet of the atmosphere.
3.3.2 Hurricane Characteristics
A hurricane is a multiforce natural hazard made up of several distinguishing characteristics, each of which can be very destructive. The combination of features is often what makes a hurricane so dangerous. The major elements of a hurricane that cause the most damage to property and pose the greatest threat to human life include the following:
FIGURE 3.1 This NASA image of Hurricane Sandy shows the massive extent of the storm as it batters the U.S. northeast coast on October 29, 2012.
• Storm surge: Storm surges are large waves of ocean water that sweep across coastlines where a storm makes landfall. The more intense the storm, the greater the height of the water. The higher the storm surge, the greater the damage to the coastline. Storm surges inundate coastal areas, wash out dunes, cause backwater flooding in rivers, and can flood streets and buildings in coastal communities.
• Storm tide: If a storm surge occurs at the same time as high tide, the water height will be even greater. Storm tide is the combination of the storm surge and the normal tide. For example, a 15-foot storm surge along with the normal 2-foot high tide creates a storm tide of 17 feet.
• Inland flooding: As hurricanes move across land bringing torrential rains and backwater flooding from the ocean, rivers, and streams overflow. In fact, a study between 1970 and 1999 found that more than half of deaths related to hurricane activity have been the result of inland flooding.*
• Water force: During hurricanes and other coastal storms, coastal areas will experience flooding with velocity or “wave action,” defined as areas subject to receiving waves on top of the rising water from coastal flooding. The velocity and the force of the water make flooding even more destructive. The velocity and wave action knock over buildings, move debris, erode dunes, scour the shoreline, and displace and redeposit sand.
• Wind velocity: The higher the wind speed the greater the potential damage. Hurricane-force winds can travel hundreds of miles inland, causing substantial damage to vegetation, buildings, and infrastructure. Hurricane-force winds can also create missiles out of loose debris such as roof shingles, tree branches, lawn furniture, even boats and cars. Flying debris often causes more damage than the force of the wind alone.
• Coastal erosion: Coastal erosion is the wearing away of coastal land. It is commonly used to describe the horizontal retreat of the shoreline along the ocean. Although erosion occurs as a natural coastal process, hurricanes can greatly accelerate the normal rate of erosion along the coastline, even to the point that houses and other structures that were considered safe from ocean waves become suddenly subject to direct wave action or even fall into the sea.
MODELING STORM SURGE TO SAVE LIVES
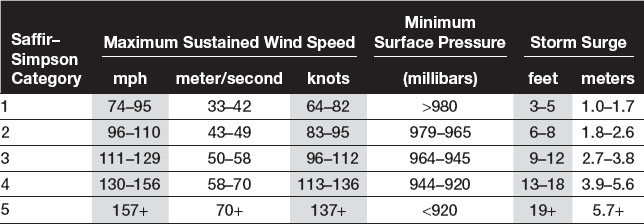
Since 1900 storm surge-induced flooding has killed more people in the United States in hurricanes than all other hurricane-related threats combined (freshwater flooding, winds, and tornadoes).1 Coastal engineers are working to enhance the analysis and prediction of storm surge through the use of sophisticated computer models. One such model is the advanced coastal circulation model (ADCIRC), which combines rain, atmospheric pressure and wind forecasts to predict when, where and to what extent coastal communities will experience storm surge, high waves and flooding. The high-resolution models provide more detail and accuracy than typical surge forecasts through the use of supercomputers capable of trillions of calculations per second. Emergency managers can use the model’s results to identify which locations to evacuate as a storm approaches and to plan for mitigation and response before severe storms occur* (see Figure 3.2).
FIGURE 3.2 The Advanced Coastal Circulation Model ADCIRC is used to predict storm surge and flooding as hurricanes approach the coast.
* The ADCIRC storm surge model was developed by Dr. Rick Luettich at the University of North Carolina at Chapel Hill and his colleagues. Visit coastalhazards.org for more information about ADCIRC model. To view outputs from the model and learn more visit the Coastal Emergency Management Risk Assessment website at coastalemergency.org.
When a hurricane makes landfall and traverses across the land either up the coast or inland, the types of damage that occur vary according to the dominant feature of that particular storm. Hurricane Fran, for instance, was considered primarily a “wind hurricane.” When this hurricane affected the state of North Carolina in 1996, the majority of reported damages included roofs ripped off of homes; trees falling on structures, vehicles and roadways; and damage caused by flying debris. In contract, when Hurricane Floyd hit North Carolina 3 years later, most of the damage was caused by severe flooding. The entire eastern third of the state experienced unprecedented high water levels, as rainfall far inland caused rivers and streams to overflow their banks, flooding homes, businesses, hog farms, sewer plants, junkyards, and other features of the built environment throughout the coastal plain.
Historically, Atlantic hurricane activity has experienced a great deal of variability. Some periods have above-normal activity, while others have below-normal activity. These fluctuations result from differences in the number of hurricanes and major hurricanes forming in the Atlantic and Caribbean Sea each year. Hurricane seasons from 1966 to 2009 averaged 11.3 named storms each season, with an average of 6.2 becoming hurricanes and 2.3 becoming major hurricanes.*
3.3.3 Measuring a Hurricane: The Saffir–Simpson Scale
Hurricane severity is measured using the Saffir–Simpson scale, ranging from 1 (minimal) to 5 (catastrophic). The scale categorizes hurricanes based upon maximum sustained winds, minimum barometric pressure, and storm surge potential (see Table 3.1). These three factors are combined to estimate the potential flooding and damage to property given a hurricane’s estimated intensity.
Category 3, 4, and 5 hurricanes are the most potentially dangerous and can be categorized as major hurricanes. However, it is important to remember that hurricanes of all intensities, including Category 1 and 2 hurricanes, have the potential to cause massive property damage and pose a risk to human life. For example, although Hurricane Irene made landfall as a Category 1 hurricane in 2011, it caused extensive flood damage and resulted in approximately $10 billion in damage and 45 deaths. Similarly, Hurricane Sandy in 2012 was a Category 2 storm at its peak wind intensity, but caused catastrophic damage due in large part to its coastal storm surge. Table 3.2 gives examples of the types of damage that can occur with each of the hurricane categories on the Saffir–Simpson scale.
TABLE 3.1 Saffir–Simpson Scale
Hurricanes have the greatest potential to inflict damage as they cross the coastline from the ocean at a point called landfall. Because hurricanes derive their strength from warm ocean waters, they generally deteriorate once they make landfall. The forward speed of a hurricane can vary from just a few miles per hour to up to 40 miles per hour. This forward motion, combined with a counterclockwise surface flow, makes the right front quadrant of a hurricane the locale of the most potentially damaging winds. Slow-moving hurricanes can actually cause more damage than faster hurricanes because they spend more time in one location, dumping more rain, causing more storm surge, and subjecting the area to prolonged high winds. The worst-case scenario is a hurricane that stalls along the coast, pounding the area for hours or even days.
The site of hurricane landfall is notoriously unpredictable. However, the skill of tropical storm and hurricane forecasting has greatly improved with advances in technology. In 1990, the average error in predicting hurricane landfall 72 hours in advance of a storm was almost 300 miles. Today, the average error in the National Hurricane Center’s 72 hours prediction is 100 miles.* The track that a hurricane can take once it makes landfall is also somewhat unpredictable. Inland areas far west of the Atlantic coast and north of the Gulf Coast have been devastated by the remnants of tropical storms and hurricanes as they travel with the force of forward momentum. The erratic nature of hurricanes is illustrated on the map in Figure 3.3 shows North Atlantic hurricane tracks from 1851 to 2012.
3.3.5 Hurricanes and Patterns of Human Activity
Past trends show that hurricane frequency has fluctuated in cycles of a few decades. During the period of below-average hurricane activity that lasted from 1970 to 1994, intense development and growth occurred along the coastlines of the Atlantic Ocean and the Gulf of Mexico. Although many of the beaches and barrier islands of the Gulf and Atlantic had some development before this time, for the most part structures along the coast were relatively small-scale, single-family cottages, and the number of people living in coastal areas was much lower than today. In fact, relatively large tracts were inaccessible except by water or air, leaving extensive stretches of coastal land undeveloped.
TABLE 3.2 Hurricane Category Damage Examples
Category |
Level |
Description |
Example |
1 |
MINIMAL |
Damage primarily to shrubbery, trees, foliage, and unanchored homes. No real damage to other structures. Some damage to poorly constructed signs. Low-lying coastal roads inundated, minor pier damage, some small craft in exposed anchorage torn from moorings |
Hurricane Humberto (2007) |
2 |
MODERATE |
Considerable damage to shrubbery and tree foliage; some trees blown down. Major damage to exposed mobile homes. Extensive damage to poorly constructed signs. Some damage to roofing materials of buildings; some window and door damage. No major damage to buildings. Coastal roads and low-lying inland escape routes cut off by rising water 2–4 hours before arrival of hurricane’s center. Considerable damage to piers. Marinas flooded. Small craft in unprotected anchorages torn from moorings. Evacuation of some shoreline residences and low-lying areas required |
Hurricane Ernesto (2012) |
3 |
EXTENSIVE |
Foliage torn from trees; large trees blown down. Most poorly constructed signs blown down. Some damage to roofing materials of buildings; some window and door damage. Some structural damage to small buildings. Mobile homes destroyed. Serious flooding at coast and many smaller structures near coast destroyed; larger structures near coast damaged by battering waves and floating debris. Low-lying inland escape routes cut off by rising water 3–5 hours before hurricane’s center arrives. Flat terrain 5 feet or less above sea level flooded inland as far as 6 miles. Major erosion of beaches. Massive evacuation of all residences within 500 yards of shore and of single-story residences within 2 miles of shore may be required |
Hurricane Ivan (2004) |
4 |
EXTREME |
Shrubs, trees, and all signs blown down. Extensive damage to roofing materials, windows, and doors. Complete failures of roofs on many small residences. Complete destruction of mobile homes. Major damage to lower floors of structures near shore due to flooding and battering by waves and floating debris. Low-lying inland escape routes cut off by rising water 3–5 hours before hurricane’s center arrives. Flat terrain 10 feet or less above sea level flooded |
Hurricane Katrina (2005) |
5 |
CATASTROPHIC |
Shrubs, trees, and all signs blown down. Very severe and extensive damage to windows and doors; extensive shattering of glass in windows and doors. Complete failure of roofs on many residences and industrial buildings; considerable damage to other roofs. Some complete building failures. Small buildings overturned or blown away. Complete destruction of mobile homes. Major damage to lower floors of all structures less than 15 feet above sea level within 500 yards of shore. Low-lying inland escape routes cut off by rising water 3–5 hours before hurricane’s center arrives. Massive evacuation of residential areas on low ground within 5–10 miles of shore may be required |
Hurricane Camille (1969) |
FIGURE 3.3 This map from the National Hurricane Center shows the tracks of hurricanes in the North Atlantic Basin from 1851 to 2012.
When investors, developers, and vacationers “discovered” the pristine coastlines of states along the Atlantic and Gulf, an unprecedented boom in coastal construction began. The 1980s in particular saw a rapid expansion of high-rise (and high-dollar) properties in the most vulnerable and fragile areas of the coast. The coinciding lull in hurricane activity served to bolster the image of the coast as a safe and lucrative investment opportunity. By the time the cycle of calm ended development patterns in many communities were already firmly established. Local communities and coastal states discovered that waterfront development was extremely profitable, not just for the private investor and vacation homeowner, but for the public sector as well: property tax revenues from expensive real estate contributed significantly to the local and state economies, and the multiple businesses related to tourism and other coastal industries provided jobs, further bolstering local markets. There was little incentive to curb rapid expansion and growth at that time, which set up the scenarios we are experiencing today: massive development, extensive public infrastructure, huge population numbers, and expensive investment coupled with more frequent and destructive hurricane activity. We can see from this discussion that the rapid increase in property damage and loss of life that we have experienced in the last few years is due to the combination of intense hurricane activity intersecting with intense human activity in the narrow strip of land along the coast.
3.3.6 Impacts of Climate Change on Hurricanes
Trends in hurricane activity are often described by changes in intensity, frequency and the location of hurricanes. The recent trend has been toward stronger Atlantic hurricanes, with indications that climate change will continue to result in more strong hurricanes in the future. At the same time, it is possible that the overall number of hurricanes may decrease slightly. Unfortunately, these two trends are unlikely to balance out in terms of damage, since stronger hurricanes cause exponentially greater damage than smaller storms.*
It is likely that climate change is shifting the location or average tracks of hurricanes further toward the poles; along the Atlantic coast this will result in hurricanes traveling further north—such as Hurricane Irene in 2011, which caused massive flooding as far north as Vermont, and Hurricane Sandy in 2012, which had a devastating effect on New York and New Jersey.2 Of course, no one single event can be directly attributed to climate change, but recent large tropical storm systems may be the “wave” of the future.
WHAT’S IN A NAME?
To help identify tropical storms and track them across the ocean, the World Meteorological Organization uses six lists of names in rotation. The name of the first tropical storm of the season begins with the letter “A”; subsequent storms are named in alphabetical order, alternating between male and female names. When the alphabet is depleted, additional storms are named using letters of the Greek alphabet as occurred in 2005 when the last tropical storm of the season was named Epsilon. If a hurricane is particularly deadly or costly, its name is retired and a new name is selected to enter the 6-year cycle. Recent “retirees” include Igor in 2010, Irene in 2011, and Sandy in 2012.*
SELF-CHECK
• Define hurricane eye, rain band, storm surge, and landfall.
• Describe a hurricane.
• Explain how climate change may affect hurricane activity.
• Cite four features of a hurricane that cause the most damage to property and risk to human life.
• Name the scale used to measure hurricane activity.
As the earth’s climate changes, global sea levels are rising due to thermal expansion of warming ocean waters, as well as the melting of ice caps and glaciers. As molecules warm, they move more quickly and take up more space. You may have experienced this phenomenon in winter when your car tires are not as inflated after a very cold night. Another easy way to visualize thermal expansion is to take an inflated balloon and hold it over a source of heat; you will see the balloon expand as the air molecules inside move more quickly. Today, the same thing is happening to our oceans at a much larger scale.
Global sea level has risen by about 8 inches over the last century. Proxy data has shown that this rate of sea level rise is greater than any other period in the last 2000 years. Since 1992, the rate of sea level rise as measured by satellites has been about twice the rate observed over the last century. In the next 100 years, sea level is projected to rise another 1–4 feet.4 A rise at the higher end of these predictions will threaten the over five million Americans who live within four feet elevation of local high tide.
The extent of sea level rise experienced by a particular community varies depending on local or relative sea level rise. Relative sea level rise is the combination of mean sea level rise and a number of local factors including vertical land movement (subsidence or uplift), changes in tidal ranges, changes in coastal currents, and changes in water temperature. For example, the stretch of coast from Cape Hatteras, NC to New Jersey has much higher rates of relative sea level rise than most of the U.S. Atlantic coast.5 As a result the coast north of Cape Hatteras will experience sea level rise at up to double the rate of the southern shoreline in North Carolina.6
3.4.2 Impact of Sea Level Rise on Flooding and Storm Surge
The rate of sea level rise is not expected to remain constant, and is in fact accelerating. At the increased rate of sea level rise that is anticipated, thousands of square miles of low-lying land in areas of the Atlantic and Gulf coasts are at risk of both permanent inundation—when flooding events do not recede—as well as periods of punctuated inundation. Nationwide, it is expected that sea level rise will increase the 100-year floodplain by as much as 38% or by 7000 square miles.6
The effects of storm surge and coastal flooding from hurricanes are also greater due to sea level rise. As seas continue to rise because of the warmer expanding ocean and melting ice sheets, the storm surge from hurricanes will ride higher upon seas and can extend farther inland causing more damage on land. In some coastal states, sea level rise and storm surge, combined with the pattern of heavy development in coastal areas, are already causing damage to infrastructure such as roads, buildings, ports, and energy facilities.4
3.4.3 Sea Level Rise and Saltwater Intrusion
Inundation is not the only impact of sea level rise; coastal communities will also confront saltwater intrusion, failure of septic tanks, and widespread die off of non-salt-tolerant plants and agricultural crops. These impacts pose serious threat to coastal economies, public health, and the environment.
Saltwater intrusion is the result of seawater infiltrating freshwater aquifers. Some exchange between oceans and coastal aquifers occurs naturally due to the increased mineral content, density, and water pressure of saltwater. Coastal wetlands are at high risk due to the combined effects of sea level rise and inland droughts that reduce freshwater inflows. Damage to these ecosystems has serious implications for water quality, coastal biodiversity, and coastal fisheries. Additionally, as wetlands and saltmarsh are weakened or destroyed by sea level rise, the natural mitigative feature of the ecosystem to absorb floodwater and the shock of storm surge declines, leaving coastal communities even more vulnerable to these hazards.
Flooding is the leading cause of weather-related deaths in the United States. It is the most common natural hazard in the country because of the widespread geographical distribution of river valleys and coastal areas and the longstanding attraction of human settlements to these areas. Flooding is generally the result of excessive precipitation that can occur during a hurricane, thunderstorm, or other torrential rainfall. Flooding can also be caused by a dam break or levee failure.
3.5.1 Effects of Climate Change on Flooding
Climate change has a direct influence on rainfall events and subsequent flooding. Since a warmer atmosphere is able to hold more water, global warming leads to increased water vapor in the atmosphere. Storms, whether thunderstorms, rain, snow storms, or tropical cyclones, tend to have more moisture and produce more intense precipitation. This increases the risk of flooding. Additionally, more precipitation is expected to occur as rain instead of snow, and snow that does fall is likely to melt earlier, increasing the risk of flooding in early spring.*
3.5.2 Floodplains, River Basins, and Watershed
Before we discuss the characteristics of flood hazards in the United States, we will introduce some of the features associated with rivers and how rivers function as part of the natural ecosystem. Quite frequently, floodwaters rise at a very fast rate because the quantity of water deposited during a particular rain event exceeds the capacity of the river channel to hold such a large volume of water at one time. Sometimes with little warning floodwaters overflow their riverbanks, moving to low-lying areas first. The flat lower-elevation areas that typically lie to either side of a river or stream that experience this inundation make up the waterway’s natural floodplain.
• The floodway is the central portion of the floodplain, the area with the greatest water velocities and highest depths.
• The flood fringe comprises the outer areas on both sides of the flood-way and is usually the area of shallower depths and lesser velocities. The flood fringe is also the area that stores water during a flood.
• A river basin is the land that water flows across or under on its way to a river. Just as a bathtub catches all the water that falls within its sides, a river basin sends all the water falling on the surrounding land into a central river and out to an estuary or the sea. River basins may also be referred to as catchments, because they essentially catch, or collect, the water from surrounding higher elevations.
A river basin drains all the land around a major river. Basins can be divided into watersheds, or areas of land around a smaller river, stream, or lake. The landscape is made up of many interconnected basins or watersheds. Large river basins such as the Mississippi are made up of hundreds of smaller river basins and watersheds. Within each watershed, all water runs to the lowest point—a stream, river, lake, and eventually the ocean. On its way, water travels over the surface and across farm fields, forestland, suburban lawns, and city streets as stormwater runoff, or it seeps into the soil and travels as groundwater.
Broadly speaking, floods fall into two categories:
• Flash floods are the product of heavy localized precipitation in a short time period over a given location.
• General floods are caused by precipitation over a longer time period and over a given river basin.
3.5.3.1 Flash Flooding
Flash floods occur within a few minutes or hours of heavy amounts of rainfall, a dam or levee failure, or a sudden release of water held by an ice jam. Flash flood waters move at very fast speeds and can roll boulders, tear out trees, destroy buildings, and obliterate bridges. In fact, because of its density water moving at 10 miles per hour exerts the same pressure on a structure as wind gusts of 270 miles per hour.* Walls of water can reach heights of 10–20 feet and generally are accompanied by a deadly cargo of debris. During a flash flood cars can easily be swept away in just two feet of moving water. Heavy rains that produce flash floods can also trigger mudslides, a potentially dangerous secondary hazard.
Most flash flooding is caused by slow-moving thunderstorms, repeated thunderstorms in a local area, or by heavy rains from hurricanes and tropical storms. Although flash flooding often occurs along mountain streams where the terrain is steep, it is also common in urban areas where much of the ground is covered by impervious surfaces. Impervious surfaces are hard, paved areas such as roof tops and parking lots, where rainwater can’t soak through to the ground. Instead, the water flows over the surface as runoff until it reaches a drain or low-lying area. As illustrated in Figure 3.4, man-made features such as roads and buildings generate greater amounts of runoff than land with natural groundcover like grass, trees, and other vegetation. Flooding can also occur when drainage channels in urban areas are unable to contain the runoff that is generated by relatively small but intense precipitation events.
FIGURE 3.4 High levels of impervious surface in a community can contribute to flooding, as illustrated by these businesses that were forced to close when the Mississippi River flooded in June 2013. FEMA.
TRAGEDY ON THE BIG THOMPSON
On July 31, 1976, the Big Thompson River near Denver, Colorado overflowed during an extremely heavy thunderstorm. The canyon through which the Big Thompson flows has very high, steep walls in some places, leaving little opportunity for the soil to absorb precipitation. Usually the winds above the mountains surrounding Big Thompson Canyon are strong enough to blow rainstorms away quickly but this storm was an exception. Without the action of the wind, the storm dropped 8 inches of rain in just 1 hour in a concentrated location and dumped a total of 12 inches during its 2-hour span. As a result, a wall of water 19 feet high roared down the Big Thompson Canyon where people were camping, fishing, and exploring the canyon that afternoon. Tragically, the only egress from the Canyon floor was up its steep sides, so visitors were trapped as the wave of water rushed down the channel. Over $40 million dollars of property was damaged or destroyed and 140 people perished in this single event.
3.5.3.2 General Flooding
While flash floods occur within hours of a rain event, periodic general flooding is a longer-term event that can last for several days. The primary types of general flooding are riverine flooding, coastal flooding, and urban flooding.
• Riverine flooding is a function of precipitation levels and water runoff volumes within the watershed of a stream or river. Periodic flooding of land adjacent to freshwater rivers and streams is a natural, inevitable, and—in the absence of human presence—desirable occurrence. When stream flow exceeds the capacity of the floodway or normal watercourse, some of the above-normal stream flow spills over onto adjacent lands within the floodplain.
• Coastal flooding is typically the result of storm surge, wind-driven waves, and heavy rainfall. These conditions are produced by tropical storms—including hurricanes—during the summer and fall, and nor’easters and other large coastal storms during the winter and spring. Storm surges may overrun barrier islands and push seawater up coastal rivers and inlets, blocking the downstream flow of inland runoff. Thousands of acres inland may be inundated by both saltwater and freshwater. Escape routes, particularly those from barrier islands may be cut off quickly, stranding residents in flooded areas and hampering rescue efforts.
• Urban flooding occurs where there has been development within the floodplain. In many areas of the country, intense development in the floodplain is a result of the use of waterways for transportation purposes when shipment by water was the major form of moving goods and raw materials. Sites adjacent to rivers and coastal inlets provided convenient places to load and offload commodities and passengers. The price of this accessibility has been increased flooding of the communities that grew up in the surrounding area. Urbanization increases the magnitude and frequency of floods by increasing impervious surfaces, increasing the speed of drainage collection, reducing the carrying capacity of the land, and, occasionally, overwhelming sewer systems.
Unlike some other meteorological hazards, areas prone to flooding can be mapped with relative precision, depending upon the extent and accuracy of data gathered about the waterway itself and the surrounding floodplain. Factors that are used to map flood-risk areas include the following:
• Proximity to the river or stream
• Amount of vegetative cover
• Soil moisture conditions
• Local historic rainfall records
• Topographic features of the area
An assessment of flooding potential requires spatial data (geographic information) of these factors at a relatively small scale. We need the information at this level of detail because flood hazards vary greatly by location and type.
3.5.4.1 Flood Insurance Rate Maps
Much of the flood mapping in the United States is carried out under the National Flood Insurance Program (NFIP) administered by the FEMA. The NFIP offers federally backed flood insurance to residents in communities that choose to participate in the program by regulating development in the floodplain according to standards established by the NFIP (for a more detailed discussion of the NFIP, see the chapter on the federal government).
The NFIP provides FIRMs to participating communities to help define the local flood risk. Digital versions of these maps are called DFIRMs. Terminology used on a FIRM includes the following:
• Floodway: The stream channel and the portion of the adjacent floodplain that must remain open to permit passage of the base flood without raising the water surface elevation by more than one foot.
• 100-year floodplain: Applies to an area that has a 1% chance, on average, of flooding in any given year. Despite this terminology, a 100-year flood can occur 2 or more years in a row, or once every 10 years. The 100-year flood floodplain is also referred to as the base flood: a national standard that represents a compromise between minor floods and the greatest flood likely to occur in a given area. The base flood provides a useful benchmark.
• Base flood elevation: The elevation of the water surface resulting from a flood that has a 1% chance of occurring in any given year. The base flood elevation (BFE) is the height of the base flood, usually in feet, in relation to a specific datum, such as the National Geodetic Vertical Datum of 1929, or the North American Vertical Datum of 1988.
• Special flood hazard area: The land area covered by the floodwaters of the base flood is the special flood hazard area (SFHA) on NFIP maps. The SFHA is the area where the NFIP’s floodplain management regulations must be enforced and the area where the mandatory purchase of flood insurance applies.
• 500-year flood floodplain: The area with a 0.2% chance of flooding in any given year.
• Coastal high hazard areas: Coastal areas that are subject to a velocity hazard (wave action).
FIRMs also show different floodplains with different zone designations. These are primarily for insurance rating purposes, but the zone differentiation can be helpful for other floodplain planning purposes as well. For example:
• Zone A: The 100-year or base floodplain. There are six types of A zones.
• Zones V and VE: The coastal area subject to velocity hazards (wave action).
• Zone B: Area of moderate flood hazard, usually the area between the limits of the 100- and 500-year floods.
• Zones C or X: Areas of minimal flooding hazard.
• Zone D: Area of undetermined but possible flood hazard.
A non-special flood hazard area (NSFHA) is an area in a moderate-to-low risk flood zone. An NSFHA is not in any immediate danger from flooding caused by overflowing rivers or hard rains. However, it’s important to note that structures within an NSFHA are still at risk. In fact, one out of four floods occurs in an NSFHA.
Most cities, towns, villages, and counties in the United State have one or more clearly recognizable flood-prone areas, usually along a river, stream, or other large body of water that are designated as the SFHAs on the community’s FIRM. These flood-prone areas are targeted by several types of government initiatives to minimize flooding and its impacts. These initiatives include maps, floodplain management criteria, ordinances, and community assistance programs. However, thousands of communities also have shallow, localized flooding problems outside of the SFHA that occur because of poor drainage, inadequate storm sewers, clogged culverts or catch basins, sheet flow, obstructed drainage ways, sewer backup, or overbank flooding from small streams. These kinds of flood events can occur anywhere in a community and can result from even minor rainfall events.
Localized flooding refers to flooding outside the scope of criteria that apply to the SFHA as depicted on a community’s FIRM. This includes areas within and outside the B, C, and X zones. Such floods are often referred to as the following:
• Stormwater flooding
• Nuisance flooding
• Flooding on small streams
• Carpet wetters
• Poor drainage
• Ponding
If these localized floods occur infrequently, the problems are minor. However, in some areas localized flooding can be chronic so that over the years the cumulative damage and recurring disruptions from localized flooding can be more than that caused by episodic flooding on major rivers and streams. The costs of insuring buildings that are subject to the repeated damage add up as well, and many property owners outside the SFHA do not purchase flood insurance. Even a few inches of water in the basement or ground floor of a building can cause expensive damage, as when carpeting, wallboard, insulation, mattresses, and upholstered furniture must be disposed of and replaced. Studs, stairs, floorboards, and other wooden parts of a flooded building must be thoroughly cleaned and dried or discarded. Electronics, appliances, papers and irreplaceable personal possessions (including photographs) are often destroyed. Even minimal amounts of flooding can block streets and disrupt traffic patterns, which can impact areas outside the immediate flood area. Localized flooding also poses health risks from mold and mildew that grows in wet conditions inside homes and buildings, as well as potential safety hazards as people are at risk even in shallow flooding. Unfortunately, there have been numerous incidents of children drowning or being swept away while playing in or around drainage ditches and storm sewers. Adults, too, can be knocked down by just a few inches of moving water, and cars can be picked up and transported downstream by the flow of deceptively shallow flooding in roadways.
SELF-CHECK
• Define floodplain, SFHA (special flood hazard area), and base flood.
• List the three types of general flooding.
• Cite five factors used to map flood-risk areas.
• Discuss FIRMs and SFHAs.
Drought is one of the most costly natural hazards affecting the United States. Drought is a period of unusually persistent dry weather that lasts long enough to cause serious problems such as crop damage or water supply shortages. The severity of a given drought depends on the degree of moisture deficiency, the duration, and the size of the affected area.* However, the impacts are often a result of the combination of the natural event (less precipitation than expected) and the demand communities place on water supply. In this way, human activities can exacerbate the impacts of drought (Figure 3.5).
FIGURE 3.5 Low water levels like those shown in the Yufeng Reservoir during the 2015 drought in Hainan, China, can result in significant crop losses, inadequate fresh water supplies for communities, and ecological damage. (Courtesy of Anna Frodesiak.)
Drought can be classified in four ways:
• Meteorological drought is a departure of precipitation from normal levels. Due to climatic differences, what might be considered a drought in one location may not be a drought in another.
• Agricultural drought refers to a situation where the amount of moisture in the soil no longer meets the needs of a particular crop.
• Hydrological drought occurs when surface and subsurface water supplies are below what is considered normal for the area.
• Socioeconomic drought refers to the situation that occurs when water shortages begin to affect people. This can happen, for example, when water capture, storage, and delivery do not keep pace with growth and development in a community.
3.6.1 Effects of Climate Change on Drought
There are a number of mechanisms by which climate change influences the likelihood and severity of drought. There has been an increase in drier, hotter areas around the world, particularly in the subtropical band circling the globe which includes the states of Texas, New Mexico, and Arizona.* Climate change is also leading to wider swings between wet and dry extremes. Much like a larger bucket, a warmer atmosphere can hold and dump more water, but takes longer to refill.* Finally, earlier snowmelt as a result of a warming climate can further reduce water availability in the summer and fall.
Periods of drought can have a wide range of environmental, agricultural, health, economic, and social consequences. Sustained lack of moisture can diminish or suspend crop production and damage wildlife habitat. Water quality often suffers during droughts since less water is available to dilute pollutants. In addition, many industrial processes and electricity production rely heavily on water supplies, and their continued operation can be jeopardized by water shortages. Drought also significantly increases the risk of wildfires (discussed in the next section).
BLOWING IN THE WIND
The Dust Bowl of the 1930s, caused by severe drought combined with unsustainable farming methods, was one of the most significant disasters the United States has faced. Following a decade of extensive deep plowing of agricultural land in the Great Plains, the drought of the 1930s caused the loose topsoil to dry out and blow away with the prevailing winds. Millions of acres of farmland were damaged and hundreds of thousands of people were forced to leave their homes in search of new economic opportunities.
With the advent of soil and water conservation districts and concerted efforts of government training initiatives, farming practices following the Dust Bowl were modernized to ensure adequate crop rotation and other forms of resource management were put in place to mitigate the impact of droughts nationwide.
Despite the revolution in farming and advances in resource conservation that were implemented after the Dust Bowl, drought continues to impact farmers and ranchers in the United States. The 2012–2013 North American Drought, caused in part by a lack of snow and reduced meltwater absorbed into the soil, is the most extensive drought affecting the United States in half a century. Roughly 80% of agricultural lands in the United States were impacted, resulting in significantly lower crop yields and reducing the national gross domestic product by an estimated 0.5%–1%.
A number of indicators are used to monitor and communicate drought levels. These indicators typically combine variables such as precipitation and temperature. However, since the indicators tend to be climate-based they do not reflect changes in how drought interacts with human development, such as increasing population density or intense agricultural production that may make the effects of drought worse.
The U.S. National Integrated Drought Information System (NIDIS) was established in 2006 to provide users with the ability to determine the potential impacts of drought and associated risks. Through the U.S. Drought Portal (www.drought.gov), NIDIS makes the U.S. Drought Monitor and a range of other indices and tools available to the public.
SELF-CHECK
• Explain the differences among meteorological, agricultural, hydrological, and socioeconomic drought.
• Describe how climate change is influencing drought.
• List five impacts that drought can have on society or the natural environment.
A wildfire is an uncontrolled burning of wilderness or relatively undeveloped areas such as grasslands, brush, or woodlands. The potential for wildfire depends on the following:
• Recent climate conditions (e.g., drought)
• Current meteorological conditions (high temperature and/or low humidity)
• Sufficient fuel load, including dense forest undergrowth and dead timber
Hot summers with average or below-average rainfalls and extensive dry vegetative groundcover increase susceptibility to fire in the fall, a particularly dangerous time of year for wildfire.
DROUGHT SETS THE STAGE IN COLORADO
A string of wildfires devastated several areas of Colorado in the summer of 2012. The dry conditions of the preceding winter set the stage, with only 13% of the average precipitation. Summer temperatures then exceeded 100°F with relative humidity in the teens and single digits. While thunderstorms and arsonists were likely responsible for the ignition of the blazes, the difficulty in controlling the fires and the extent of damage were largely a result of the prevailing meteorological conditions. Approximately 34,500 residents were evacuated and at least 500 homes were destroyed during the fires that lasted from June through August.
3.7.1 Human Management of Wildfire
Wildfires have taken place as a natural process for many millions of years, playing an important role in the ecological integrity of our natural environment. Human settlement has significantly influenced changes in the spatial and temporal pattern of wildfire occurrence as well as the associated risks to human life and property. Table 3.3 shows the various approaches to wildfire since early human habitation in North America.
Natural wildfires still take place on a regular basis. They can be caused by human carelessness, arson, or from lightning strikes on the tops of mountains. Other natural disturbances such as tornadoes and hurricanes can influence the structure and fuel distribution of forests, which can lead to a change in wildfire intensity and risk. Occurrence and frequency of wildfire also relies greatly upon the type of forest surrounding the community.
3.7.2 Measuring Wildfire Risk Conditions
One scale of wildfire risk conditions is measured with the Keetch–Byram drought index (KBDI). The KBDI estimates the potential risk for wildfire conditions based on daily temperatures, daily precipitation, and annual precipitation levels on an index of 0 (no drought) to 800 (extreme drought). It is a useful tool for fire fighters, planners, and citizens in understanding the risk of wildfire (Figure 3.6).
SELF-CHECK
• Define wildfire
• How does the KBDI help communities plan for wildfire?
• List three environmental conditions that can contribute to the start of a wildfire.
TABLE 3.3 Fire Regime Time Periods
Time Period |
Fire Description |
14,000–500 years ago |
Native Americans used fire for swidden agriculture, hunting visibility, reduction of wildfire fuel, and maintenance of trails |
500–100 years ago |
European settlers used fire to maintain large amounts of permanent agricultural fields at a much greater scale than before |
Late 1800s into early 1900s |
Forests were extensively logged, exacerbating conditions for common occurrence of wildfires |
1900–1950s |
Response to wildfires was widespread fire suppression |
1950–Today |
Active management; natural role of fire is incorporated through prescribed burning |
FIGURE 3.6 The Keech-Byram Drought Index was specifically devised in 1968 to assess the risk of fire. It attempts to measure soil moisture deficiency by accounting for evaporation, transpiration (water from plants), and precipitation. The index ranges from zero, the point of no moisture deficiency, to 800, the maximum drought that is possible. (From http://www.drought.gov/drought/content/products-current-drought-and-monitoring-wildfire/keetch-byram-drought-index.)
A tornado is a violently rotating column of air extending from the base of a thunderstorm (see Figure 3.7). Tornadoes can also form during hurricanes. These dangerous wind events are sometimes called “funnel storms” or “funnel clouds” because the shape of the rotating column of air is typically wider at the top than at the base. Contrary to popular belief, the tornado funnel does not always touch the ground; a debris cloud beneath a thunderstorm may confirm the presence of a tornado despite the absence of a visible funnel. Waterspouts, which are weak tornadoes that form over warm ocean waters, can occasionally move inland to become tornadoes.
Tornadoes are spawned by thunderstorms and produced when cool air overrides a layer of warm air, forcing the warm air to rise rapidly. Tornadoes are usually preceded by very heavy rain and, possibly, hail. If hail falls from a thunderstorm it is an indication that the storm has large amounts of energy and may be severe. In general, the larger the hailstorm, the more potential for damaging thunderstorm winds and/or tornadoes.
FIGURE 3.7 This image is the first tornado captured by the National Severe Storms Laboratory Doppler radar and NSSL chase personnel. The tornado is here in its early stage of formation. Union City, Oklahoma, 1973. (Photo credit by NOAA Photo Library.)
As powerful as they are, tornadoes account for only a tiny fraction of the energy in a thunderstorm. What makes them dangerous is the energy that is concentrated in a small area, perhaps only a hundred yards across. The damage from a tornado is due to the resulting high wind velocity, or speed of the wind as it revolves.
3.8.2 The Fujita–Pearson Tornado Scale
The intensity, path length, and width of tornadoes are rated according to a scale developed in 1971 by T. Theodore Fujita and Allen D. Pearson. Under this scaling system, tornadoes classified as F0–F1 are considered weak tornadoes; those classified as F2–F3 are considered strong, while those classified as F4–F5 are considered violent.
The size of a tornado is not necessarily an indication of its intensity. Large tornadoes can be weak, while small tornadoes can be violent. Tornado intensity may also change during the lifespan of the event. A small tornado may have been larger, and is at the “shrinking” stage of its life cycle.
Evidence from past tornadoes suggests that tornadic wind speeds can be as high as 300 miles per hour in the most violent events. Wind speeds that high can cause automobiles to become airborne, rip homes to shreds, and turn broken glass and other debris into lethal missiles. The most serious threat to humans and other living creatures from tornadoes is from flying debris and from being tossed about in the wind.
3.8.2.1 The Enhanced Fujita Scale
Because of limitations in the original Fujita scale—which does not recognize differences in construction and can overestimate wind speeds greater than F3—a team of meteorologists and wind engineers collaborated to develop the enhanced Fujita scale, which was unveiled by the National Weather Service in 2007.* The enhanced Fujita scale can be used to determine an “EF Number” based on 28 separate damage indicators (see Table 3.4). The damage indicators represent typical types of construction, ranging from single-family residences to multistory hotels. Depending upon the type of indicator, specific degrees of damage can be identified.
3.8.3 Tornado Activity in the United States
In an average year, more than 1000 tornadoes are recorded across the United States, resulting in 80 deaths and over 1500 injuries. 2011 was a particularly destructive and deadly year with 1692 confirmed tornadoes in the United States, resulting in 553 deaths and more than 5000 injuries.† These figures are based on tornado events that are sited and reported. In less populated areas, tornado frequency may be much higher, but the events remain unobserved. Tornadoes can occur in any state, but are more frequent in the Midwest, Southeast, and Southwest. Although tornadoes can occur at any time of the year, in the southern states peak tornado season lasts from March until May, while the northern states experience more frequent tornado activity during the summer. Waterspouts are more common in the late fall and winter in the southern states and along the Gulf Coast.
TABLE 3.4 The Enhanced Fujita Scale
Fujita Scale |
Enhanced Fujita Scale |
||
F Number |
3 Second Gust (mph) |
EF Number |
3 Second Gust (mph) |
0 |
45–78 |
0 |
65–85 |
1 |
79–117 |
1 |
86–110 |
2 |
118–161 |
2 |
111–135 |
3 |
162–209 |
3 |
136–165 |
4 |
210–261 |
4 |
166–200 |
5 |
262–317 |
5 |
Over 200 |
3.8.3.1 Effects of Climate Change on Tornado Formation
The tornado outbreak across the southern United States in late April 2011 was deadly, devastating, and record breaking. These days, when the weather breaks records, it’s natural to wonder if global warming is to blame.* At this point, there is no clear long-term trend in tornadoes resulting from climate change. However, some computer models do suggest that climate change may cause conditions to be more favorable for tornado formation in certain regions of the country.†
2011 JOPLIN, MISSOURI TORNADO
On May 22, 2011, one of America’s deadliest and most costly tornadoes tore through Joplin, Missouri and into portions of Newton and Lawrence counties. The EF-5 tornado, part of a larger late-May tornado outbreak, was approximately 0.75 miles wide and flattened 8400 houses, 18,000 cars, and 450 businesses in its 22.1 mile-long track. The tornado also completely destroyed St. John’s Regional Medical Center and Joplin High School. In all, 189 people lost their lives from tornado-related injuries. The cost to rebuild Joplin is estimated at $3 billion.
SELF-CHECK
• Define tornado, wind velocity, and waterspout.
• Discuss the conditions required for the creation of a tornado.
• Name the scale currently used to rate tornadoes.
• Discuss the relationship between the size of a tornado and its strength.
In contrast to tropical storms such as hurricanes, severe winter storms are extra-tropical cyclones. These storms form outside the tropics, are characterized by fronts, and have their strongest winds within the upper atmosphere. Unlike tropical cyclones that have a center warmer than the surrounding air, the center of extra-tropical storms is colder. Fueled by strong temperature gradients and an active upper-level jet stream, severe winter storms produce an array of hazardous weather conditions, including the following:
• Freezing rain
• Windchill
• Extreme cold
• Snowstorms
Blizzards, which can involve a combination of all of these hazards, pack a major snowstorm into one cold, windy, low-visibility event. The following sections give a brief description of each of these severe winter weather hazards.
A blizzard is a snowstorm characterized by low temperatures (usually below 20°F) that is accompanied by winds that are at least 35 miles per hour or greater. In addition, there must also be sufficient falling and/or blowing snow in the air. This airborne snowfall contributes significantly to the danger posed by a blizzard, as visibility can be reduced to 1/4 mile or less for 3 hours or longer. A severe blizzard is considered to have temperatures at or below 10°F, winds exceeding 45 miles per hour, and visibility reduced to near zero.
Blizzard conditions often develop on the northwest side of an intense storm system. The difference between the lower pressure in the storm and the higher pressure to the west creates a tight pressure gradient, which in turn results in very strong winds. These winds combine with snow and blowing snow to produce extreme conditions. Storm systems powerful enough to cause blizzards usually form when the jet stream dips far to the south, allowing cold air from the north to clash with warm air from the south. With the colder and drier polar air comes an atmospheric temperature cold enough for the development of snow, sleet, or freezing rain. A few of the notable blizzard events in the United States are listed in Table 3.5.
Snow is frozen precipitation in the form of a six-sided ice crystal, commonly known as the snowflake. Snowstorm is the phrase used to describe any storm with heavy snow.
Snow requires temperatures to be below freezing in all or most of the atmosphere, from the surface up to cloud level. Snow can fall when surface temperatures are above freezing and form a relatively shallow layer on the ground. Under these conditions, the snow will not have enough time to melt before reaching the ground; the snow will be quite wet and contain large flakes, the result of wet snow crystals sticking to one another to form larger flakes. Generally, 10 inches of snow will melt into one inch of water. Sometimes the snow–liquid ratio may be much higher—on the order of 20:1 or 30:1. This commonly happens when snow falls into a very cold air mass, with temperatures of 20°F or less at ground level.
TABLE 3.5 Notable Blizzard Events in the United States
Name of Storm |
Date |
Details |
The “Knickerbocker” Storm |
January 1922 |
This blizzard took place in Washington, DC and caused the roof of the Knickerbocker Theater to collapse, killing almost 100 people |
The New York City Storm |
February 1969 |
There was so much snow in the city that even the snow plows were buried in snow, forcing the city to employ 10,000 workers to clear the streets with shovels |
The Buffalo Storm |
February 1977 |
Areas surrounding western New York state and Ontario, Canada were hit by a blizzard that killed 28, shutdown Buffalo, and stranded thousands of people in their cars on the highway |
The Blizzard of the Century |
March 1993 |
This storm took place across a wide area of the eastern United States, from Alabama to Massachusetts. Snowfall rates of between 1 and 2 inches per hour took place in many areas |
The Blizzard of 1996 |
January 1996 |
This January blizzard took place in the northeastern United States and was the cause of over 100 deaths |
Snowmageddon/North American Blizzard of 2010 |
February 2010 |
“Snowmageddon” was a Category 3 nor’easter that dropped more than 35 inches of snow in some areas, and resulted in at least 41 fatalities between the United States and Mexico |
High-impact snowstorms in the Northeastern United States are ranked according to the Northeast snowfall impact scale (NESIS), developed by Paul Kocin of The Weather Channel and Louis Uccellini of the National Weather Service.* The NESIS consists of five categories of storms in descending order of severity: Extreme, Crippling, Major, Significant, and Notable. The scale rates storms that have large areas of 10-inch snowfall accumulations or greater. A score is assigned to each area affected by the snowstorm as a function of the amount of snow, the area impacted, and the number of people in the path of the storm. Because the score includes population data, the index gives an indication of a storm’s societal impacts.
NESIS categories, their corresponding NESIS values, and descriptive adjective are displayed in Table 3.6.
Freezing rain or freezing drizzle is rain or drizzle that occurs when surface temperatures are below freezing. The moisture falls in liquid form but freezes upon impact, resulting in a coating of ice or glaze on all exposed surfaces. Sleet is precipitation that falls as frozen water or becomes frozen before it hits the ground.
Category |
NESIS Value |
Description |
1 |
1–2.499 |
Notable |
2 |
2.5–3.99 |
Significant |
3 |
4–5.99 |
Major |
4 |
6–9.99 |
Crippling |
5 |
10.0+ |
Extreme |
Freezing rain is caused when there is a warm mass of air in the middle altitudes between the ground and the cloud deck and a mass of freezing air near the surface. When the precipitation falls from the cloud, it will generally be snow. As it encounters the warm air it will melt to form rain. The melted snowflake then falls through the shallow freezing layer without refreezing into sleet. As the precipitation reaches ground level, it enters air at below-freezing temperatures, and quickly turns to ice. As a result, when the liquid droplets encounter exposed objects at the surface they freeze upon contact.
Some ice events (up to and including ice storms) are the result of cold air damming (CAD). CAD is a shallow, surface-based layer of relatively cold, stably stratified air entrenched against the eastern slopes of the Appalachian Mountains. With warmer air above, falling precipitation in the form of snow melts, then becomes either super-cooled (liquid below the melting point of water) or re-freezes. In the former case, super-cooled droplets can freeze on impact (freezing rain), which in the latter case, the re-frozen water particles form ice pellets, or sleet.
3.9.4 Windchill and Extreme Cold
A cold wave is an unusual fall in temperature to the freezing point or below, exceeding 16° in 24 hours or 20° in 36 hours. What constitutes extreme cold varies across different regions of the United States. In areas unaccustomed to winter weather, near freezing temperatures are considered extreme cold. In contrast, the more northern and mountainous states require much lower temperatures for conditions to be considered extreme cold.
• Windchill factor describes what happens to the human body when there is a combination of cold and wind. As wind increases, heat is carried away from the body at a faster rate, driving down skin temperature (which can cause frostbite) and eventually the internal body temperature (which can cause death).
FIGURE 3.8 NOAA has developed a windchill index that shows how wind speed and temperature combine for the windchill effect and resultant time (in minutes) for frostbite to occur.
• Windchill temperature is a measure of the combined cooling effect of wind and ambient air temperature. Windchill temperature is a unit of measurement used to describe the windchill factor.
Figure 3.8 is a windchill chart that shows the amount of time it takes for humans to develop frostbite given different windchill temperatures (see following section for definition of frostbite).
3.9.5 Effects of Climate Change on Severe Winter Weather
Climate change is likely to impact winter weather in substantially different ways depending on the region. As temperatures rise, the atmosphere is able to hold more moisture, resulting in more intense precipitation events. In mid-winter, this may translate into heavier snowfalls and more severe winter weather, assuming that the temperature is still below freezing. However, at the beginning and end of the snow season, and in communities with winter temperatures near freezing, it is likely that the warmer temperatures associated with climate change will lead to more rainfall events rather than snow.
Over the past century, the northeastern United States has experienced a dramatic increase in 1-day precipitation extremes during the cold season from October to March. This observed trend is consistent with predictions about the effects of climate change on severe winter weather.*
3.9.6 Impacts of Severe Winter Weather
The dangers posed by severe winter weather are generally threefold:
• The cold wet conditions can be extremely hazardous to the health of people and animals that are exposed for prolonged periods of time.
• Driving conditions become hazardous as roads, bridges, and overpasses become slick or impassable due to accumulation of snow and ice.
• Power outages can occur when power lines are coated with ice or are knocked down by falling tree limbs.
On average, winter weather claims nearly 100 lives each year in the United States; the majority of these fatalities can be directly attributable to the impacts of winter storms. About 70% of all winter-related deaths occur in motor vehicle accidents caused by hazardous driving conditions, while nearly 25% are due to prolonged exposure to snow and cold. A significant percentage of winter weather-related deaths are due to heart attacks caused by overexertion while shoveling snow. Deaths have also occurred as a result of poisonous fumes released by generators, propane heaters, gas stoves, and charcoal grills when power outages force people to improvise alternate sources of heat and cooking for their homes. Without adequate ventilation in enclosed spaces, these devices can prove deadly within a matter of hours.
Dangers to human health from exposure to extremely cold conditions include frostbite and hypothermia.
• Frostbite is a severe reaction to cold exposure that can permanently damage body extremities. A loss of feeling and a white or pale appearance of fingers, toes, nose, and ear lobes are symptoms of frostbite.
• Hypothermia is a condition brought on when internal human body temperature drops below 95°F. Symptoms of hypothermia include uncontrollable shivering, slow speech, memory lapses, frequent stumbling, drowsiness, and exhaustion.
WINTER WEATHER DOWN ON THE FARM
Heavy accumulation of ice can bring down trees, electrical wires, telephone poles and lines, and cell phone towers, disrupting communications and power for days. The massive ice storm of January 1998 covered the St. Lawrence River Valley with a veneer of solid ice. Although the destructive storm hit a region accustomed to severe winter weather, it left more than 4 million people without electricity, including a large number of the area’s farmers. Because many of these rural farms were not equipped with generators, livestock suffered. Many lessons were learned from this event about rural emergency preparedness, planning, and action. Today, many more farms and rural homeowners have generators stored in preparation for the next winter event (see Figure 3.9).
FIGURE 3.9 Cattle and livestock had a difficult time staying warm and finding food during severe winter weather in Kansas in 2007. Farmers had to airlift hay to animals in the field. FEMA.
SELF-CHECK
• Define extra-tropical cyclone, blizzard, severe blizzard, snowstorm, windchill factor, and hypothermia.
• List four conditions created by severe winter storms.
• Discuss the difference between a snowstorm and a blizzard.
• Name three dangers that severe winter weather pose.
Extreme heat, often referred to as a heat wave, is a prolonged period of excessively hot weather, which may be accompanied by high humidity. While specific definitions vary, it is generally characterized by at least 3 consecutive days with temperatures that exceed 90–100°F.
In addition to high temperatures, relative humidity can increase the risk of health-related problems such as sunstroke or heat stroke. The National Weather Service Heat Index shown in Figure 3.9 combines the air temperature and relative humidity to estimate the apparent temperature, or the perceived outdoor temperature, to help emergency managers, public health workers, and individuals understand the potential risks from extreme heat (Figure 3.10).
FIGURE 3.10 The National Weather Service Heat Index indicates how air temperature and humidity combine to determine the measure of comfort we feel when outside in hot weather. (From http://www.weather.gov/media/unr/heatindex.pdf.)
3.10.1 Impacts of Extreme Heat
The effects of extreme heat can be profound, leading to public health emergency, damaging infrastructure, causing power outages, increasing the risk of wildfire, and may even lead to an increase violent crime. Every year, a large number of hospitalizations and deaths are connected to extreme heat. In fact, an average of 400 deaths in the United States each year are directly related to heat, a higher mortality rate than any other natural hazard in this country.* Older adults, very young children, and those who are sick or overweight are at a higher risk for heat-related illnesses, which include heat exhaustion, heat stroke, dehydration, and heat rash.
Additionally, public health researchers expect that heat-related mortality may be much greater because of underreporting heat as causing or contributing to death.
People living in urban areas are often at higher risk than those in rural areas, particularly as stagnant warm air can trap pollutants in urban areas and cause problems for people with respiratory difficulties. Additionally, materials in urban environments like asphalt and concrete can store heat longer and gradually release it overnight, resulting in much higher nighttime temperatures than typically occur in rural areas. This phenomenon of urban areas being warmer than rural areas due to human activities is referred to as the urban heat island effect.
The 1995 Chicago heat wave was one of the worst in U.S. history. The excessively high heat index, measured as high as 125°F, led to approximately 750 heat-related deaths over a period of 5 days. Most of the victims were the elderly poor living in the heart of the city, many of whom did not have air conditioning or could not afford to turn it on. Fear of crime also made many older citizens resistant to opening windows and doors at night, contributing to the tragedy.
With climate change, temperatures will rise in many areas of the country, and extreme heat events are expected to become more prevalent—particularly in the Southeast. More extreme heat means
• More intense and frequent heat waves or consecutive high-temperature days, when temperatures do not drop at night.
• An increased number of very hot days throughout the year.
• An increase in seasonal average temperatures. Future climate projections include shorter cool seasons and longer warm seasons, with an increase in average temperature during both.3
SELF-CHECK
• Define extreme heat, heat index, and apparent temperature.
• Explain the cause of the urban heat island effect.
• Discuss the populations and groups who tend to be most vulnerable to extreme heat.
This chapter covers some of the United States’ most prevalent—and destructive—meteorological and hydrological hazards. The combination of intense hurricane activity and intense human activity along the coast has resulted in greater loss of life and property than ever before. Similarly, where humans choose to live often leaves them more vulnerable to riverine, urban, and coastal flooding. Conversely, unusually dry or hot conditions can stress communities, infrastructure, and the natural environment, and lead to a range of disasters resulting from drought, wildfire, and extreme heat. This chapter also covered the dangerous effects of tornadoes and severe winter weather hazards. Ultimately, a greater knowledge of all of these weather-related hazards will enable us to lessen their impacts on our lives and communities.
100-year floodplain |
The area that has a 1% chance, on average, of flooding in any given year as shown on a community’s FIRM. |
500-year flood floodplain |
An area with a 0.2% chance of flooding in any given year. |
Base flood |
The 100-year flood floodplain as shown on a community’s FIRM. |
Base flood elevation |
The elevation of the water surface resulting from a flood that has a 1% chance of occurring in any given year as shown on a community’s FIRM. |
Blizzard |
Snowstorm characterized by low temperatures and accompanied by winds that are at least 35 miles per hour. |
Catchment |
A river basin, or the area surrounding a river that collects water from higher surrounding elevations. |
Coastal erosion |
The wearing away of the shoreline along the ocean. |
Coastal flooding |
Flood event that is the result of storm surge, wind-driven waves, and heavy rainfall. |
Coastal high hazard area |
Areas that are subject to a velocity hazard (wave action). |
Cold air damming |
A surface-based layer of cold air entrenched against the eastern slopes of the Appalachian Mountains; results in freezing rain or sleet. |
Cold wave |
An unusual fall in temperature, to or below the freezing point, exceeding 16° in 24 hours or 20° in 36 hours. |
Enhanced Fujita scale |
An updated tornado index based on the Fujita scale that incorporates 28 damage indicators and degrees of damage estimates to more clearly classify tornado intensity during a tornado event. |
Estuary |
A semi-enclosed area where fresh water from a river meets salty water from the sea. |
Extra-tropical cyclones |
Storms that form outside the tropics; severe winter storms. |
Eye |
Calm center of a hurricane. |
Flash flood |
A flood event occurring with little or no warning where water levels rise at an extremely fast rate. |
Flood fringe |
The area on both sides of the floodway with lower depths and velocities. The flood fringe stores water during a flood. |
Flood insurance rate map |
Map of a community that shows both the SFHAs and the risk premium zones applicable to the community. D-FIRMs are digitized versions of the flood maps. Official FIRMs and D-FIRMs are issued by FEMA. |
Floodplain |
Low-laying flat areas that typically lie to either side of a river or stream. |
Floodway |
The central portion of the floodplain with the greatest water velocities and highest depths. |
Freezing rain |
Moisture falling in liquid form that freezes upon impact when surface temperatures are below freezing. |
Frostbite |
A severe reaction to cold exposure that can permanently damage its victims. |
General flood |
Flood event caused by precipitation over an extended period and over a given river basin. |
Groundwater |
The water found in cracks and pores in sand, gravel, and rocks below the earth’s surface. |
Hurricane |
An intense tropical cyclone, formed in the atmosphere over warm ocean waters, in which wind speeds reach 74 miles per hour or more and blow in a large spiral around a relatively calm center or “eye.” |
Hydrological hazards |
Weather event that occurs as part of the Earth’s water systems. |
Hypothermia |
A condition brought on when the body temperature drops below 95°F. |
Impervious surface |
Hard areas, such as pavement or rooftops, where water cannot soak through to the ground. |
Inland flooding |
A hazard event where river and streams overflow as a hurricane or storm system moves across land. |
Keetch–Byram drought index |
Scale of fire conditions that estimates the potential risk for wildfire based on daily temperatures, daily precipitation, and annual precipitation levels on an index of 0 (no drought) to 800 (extreme drought). |
Landfall |
The point where a hurricane crosses the coastline from the ocean. |
Major hurricane |
Category 3, 4, and 5 hurricanes; most potentially dangerous. |
Meteorological hazards |
Weather event that occurs because of processes in the Earth’s atmosphere. |
Northeast snowfall impact scale |
Scale used to characterize and rank high-impact snowstorms in the Northeast United States. |
Rain band |
A spiraling arm of rain radiating out from the eye of a hurricane. |
River basin |
The area surrounding a river that collects water from higher surrounding elevations; the drainage area of a river. |
Riverine flooding |
Flood event that is a function of precipitation levels and runoff volumes within the watershed of a stream or river. |
Runoff |
Water that is unable to soak through impervious surfaces such as rooftops or pavement. |
Severe blizzard |
Snowstorm with temperatures near or below 10°F, winds exceeding 45 miles per hour, and visibility reduced by snow to near zero. |
Sleet |
Ice pellets. |
Snowstorms |
Any storm with heavy snow. |
Special flood hazard area |
An area within a floodplain having a 1% or greater chance of flood occurrence in any given year (100-year floodplain); represented on FIRMs by darkly shaded areas with zone designations that include the letter A or V. |
Storm surge |
Rise in the water surface above the normal water level on the open coast due to the action of wind stress and atmospheric pressure on the water surface. |
Storm tide |
The combination of a hurricane’s surge and the normal tide. |
Tornado |
A violently rotating column of air extending from the base of a thunderstorm. |
Tropical cyclones |
Storms that form in the tropics; includes hurricanes and other less intense storms. |
Urban flooding |
Flood event that occurs where there has been development within the floodplain. |
Water force |
The wave action of water during a hurricane that makes flooding particularly destructive. |
Watershed |
All the land drained by a river, stream, or lake; many watersheds make up a river basin. |
Waterspout |
Weak tornadoes that form over warm ocean waters. |
Wildfire |
An uncontrolled burning of grasslands, brush, or woodlands. |
Wind velocity |
The speed of wind. |
Windchill factor |
As wind increases, heat is carried away from the body at a faster rate, making temperatures feel colder. |
Windchill temperature |
Unit of measurement to describe windchill factor. |
1. Weather-related natural hazards can be classified as either meteorological or hydrological. True or False?
2. Which of the following is not a prevalent hazard in the United States?
a. Drought
b. Storm surge
c. Waterspout
d. Tsunami
3. A hurricane begins as a
a. Waterspout
b. Tropical storm
c. Tropical depression
d. Tornado
4. A hurricane’s severity is measured on a scale of 1–6. True or False?
5. Hurricane velocity increases after landfall. True or False?
6. The current trend in hurricane landfalls is
a. Steady
b. Decreasing
c. Increasing
d. Difficult to determine
7. The World Meteorological Organization relies on Female names to identify tropical storms and hurricanes. True or False?
8. Another name for a catchment is
a. River basin
b. Streambed
c. Flood hazard zone
d. Floodplain
9. Flash flooding is common in urban areas. True or False?
10. Flood maps are created using
a. Soil moisture conditions
b. Topographic features
c. Proximity to a river
d. All of the above
11. Which of the following is the most damaging effect of a tornado?
a. Lightning
b. Hail
c. Wind velocity
d. Heavy rain
12. A small tornado can cause less damage than a large tornado. True or False?
13. Severe winter storms are tropical cyclones. True or False?
14. Blizzard conditions are characterized by extreme cold and wind. True or False?
15. Windchill factor is
a. A unit of measurement to describe wind speed
b. The wind temperature during a cold wave
c. The air temperature during a winter storm
d. How a combination of cold and wind affects the human body
16. Frostbite and hypothermia exhibit similar symptoms. True or False?
1. Hurricanes can affect more than just coastal areas. Explain how.
2. When is hurricane season in the United States?
3. Hurricanes typically involve more than one destructive feature. List the six characteristic threats of a hurricane.
4. According to the Saffir–Simpson scale, what are the hurricane categories and the corresponding levels used to describe them?
5. When a river overflows, floodwater first moves into the surrounding low-lying, flat areas. What is the name of this area?
6. Flash floods can occur in mountains or urban areas. Explain the role of impervious surfaces in a flash flood.
7. Coastal areas often face the threat of flooding. Name three different ways that coastal communities can be flooded during a storm.
8. Define a tornado. How is a tornado different from a hurricane, and how are they related?
9. Name the scale used to rate tornadoes and give the range for classification.
10. Explain how climate change may cause us to experience both more frequent flooding and more frequent drought, as well as seasons that may be both hotter and colder than we have experienced in the past.
11. Severe winter weather can be very dangerous. How does windchill affect human safety during winter weather?
12. What are three dangers that officials must be concerned about during a winter storm?
1. Using the list of the most prevalent meteorological and hydrological hazards in the United States, pick the 10 hazards that most apply to where you live and put them in order of most likely to least likely to occur.
2. Working with the list of 10 hazards for your community, consider the likely impact each event could have on the community.
3. Imagine that a hurricane with maximum sustained winds of 125 miles per hour were to strike your area (whether or not you live in a hurricane-prone region). Examine your neighborhood to see how it would be affected.
4. Assume you are an official of a town on a barrier beach island on the Gulf Coast. A large hotel and resort has brought much-needed tourism to the area, along with a boom in real estate development. Using the example of a real community that was hit hard by a hurricane, draft an introduction to a presentation you’ll give about why development should be carefully regulated in hazard areas.
5. Assume that you are an insurance agent in an area that has not experienced serious flood damage in more than 25 years. How could you begin to convince your clients of their needs to buy flood insurance for their homes? What kind of information could you provide to them?
6. If a tornado with winds of 115 miles per hour were to hit your community, what level of tornado would it be, and what kind of damage would be likely? Which buildings would be especially vulnerable?
7. Compare the potential effects of a blizzard to those of an EF2 tornado. Which elements are different? Which are the same?
8. With wind speeds of 40 miles per hour and a temperature of 0°F, calculate the windchill and explain what that means for someone who has left his or her broken-down car in a storm to walk an undetermined distance for help.
Find Your Ecological Address
Even if you don’t live on the waterfront, the land around your house drains into a river, estuary, or lake somewhere nearby. What river basin are you located in? Into what river or stream does your land eventually drain? Does the water running off your property enter a storm drain, a ditch, or an open field? How fast does runoff enter local streams? How much of the area is paved or covered with hard surfaces such as roads or rooftops?
Flooded with Information
Evaluate your risk of experiencing a flood where you live. Which type of flooding are you most vulnerable to? You can get more information about floods and estimate your flood risk and your insurance premium from the FEMA National Flood Insurance Program Flood Smart website: www.floodsmart.gov.
Communicating Hazard Threats
Select one threatened area or population of your community and come up with ideas for how to prepare for a potential natural hazard. For example, consider aging mobile homes that you feel could not withstand a serious wind event. What information would you provide to members of your community and how would you make it available?
Winter Storms: The Deceptive Killers
Imagine that you’ll be spending a winter in Buffalo, New York, an area that can be crippled by intense lake-effect snows. Where will you be when disaster strikes? At work, at school, or in the car? A severe storm event may confine you to your home or force you to evacuate. What would you do if basic services—water, gas, electricity, or telephones—were cut off? Using the following NOAA and FEMA websites to prepare a disaster plan for you/or your family: http://www.ready.gov/make-a-plan and www.nws.noaa.gov/om/brochures/wntrstm.htm.
1. Blake, E. S. et al. 2007. NOAA Technical Memorandum NWS TPC5. National Hurricane Center, Miami, Florida.
2. IPCC. 2011. Summary for policy makers. In: Special Report on Extremes. http://ipcc-wg2.gov/SREX/.
3. Woodruff, S. C. et al. 2013. Adapting to Climate Change: A Handbook for Local Governments in North Carolina. Chapel Hill, NC: Coastal Hazards Center the University of North Carolina at Chapel Hill. Available online at: coastalhazardscenter.org/adapt.
4. Melillo, J. 2013. Draft for Public Comment. National Climate Assessment and Development Advisory Committee, January 11.
5. Sallenger, A. H., K. S. Doran, and P. A. Howd 2012. Hotspot of accelerated sea-level rise on the Atlantic coast of North America. Nature Climate Change 2(12): 884–888.
6. Neumann, J. et al. 2000. Sea-level Rise and Global Climate Change: A Review of Impacts to U.S. Coasts. Pew Center, February, http://www.c2es.org/docUploads/env_sealevel.pdf.
* http://www.ncdc.noaa.gov/billions/events.pdf.
* http://www.noaa.gov/features/02_monitoring/inland_flooding2.html.
* http://www.nhc.noaa.gov/climo/.
* http://www.nhc.noaa.gov/verification/verify5.shtml.
* http://www.nature.com/ngeo/journal/v3/n3/full/ngeo779.html.
* http://www.cgd.ucar.edu/cas/Trenberth/trenberth.papers/SSD%20Trenberth%202nd%20proof.pdf.
* http://training.fema.gov/EMIWeb/edu/docs/fmc/Chapter%202%20-%20Types%20of%20Floods%20and%20Floodplains.pdf.
* http://www.wrh.noaa.gov/fgz/science/drought.php?wfo=fgz.
* http://onlinelibrary.wiley.com/doi/10.1002/wcc.81/abstract?systemMessage=Wiley+Online+Library+will+be+disrupted+on+23+February+from+10%3A00-12%3A00+BST+%2805%3A00-07%3A00+EDT%29+for+essential+maintenance.
* http://www.climateaccess.org/sites/default/files/Cutting_Connecting%20the%20Dots_0.pdf.
* http://www.ncdc.noaa.gov/oa/satellite/satelliteseye/educational/fujita.html.
† http://www.spc.noaa.gov/wcm/annualtornadomaps/2011.png.
* http://www.climatewatch.noaa.gov/article/2011/noaas-csi-team-investigates-tornado-outbreak.
† http://www.pnas.org/content/104/50/19719.full.
* http://www.erh.noaa.gov/rnk/Newsletter/Fall%202007/NESIS.htm.
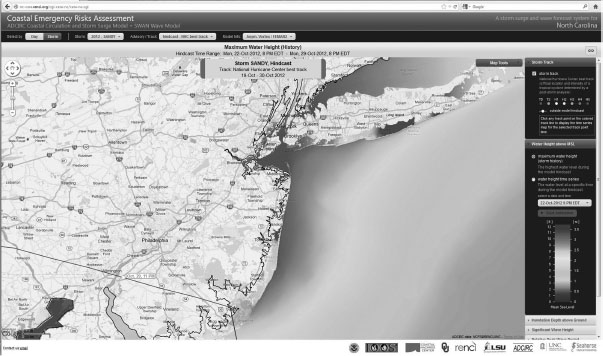
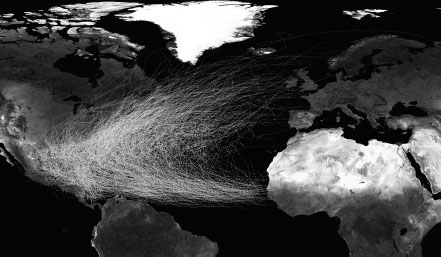
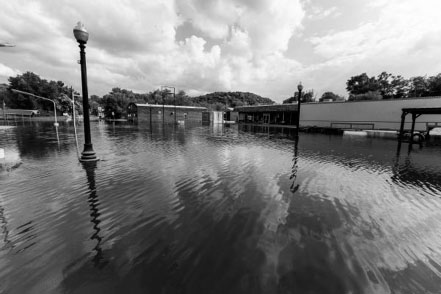
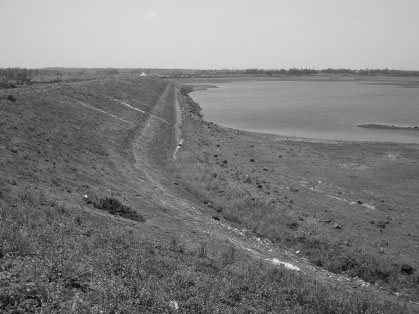
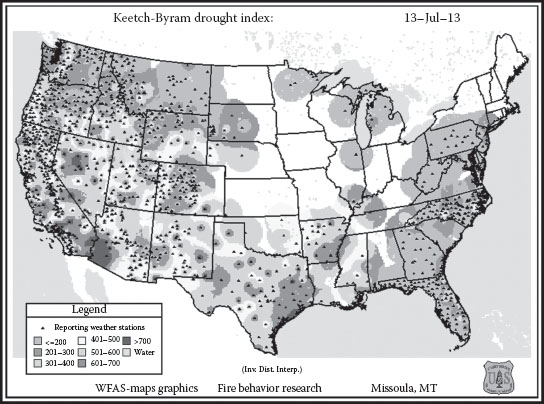
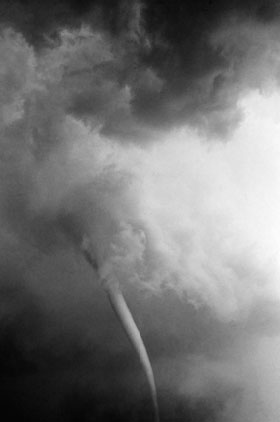
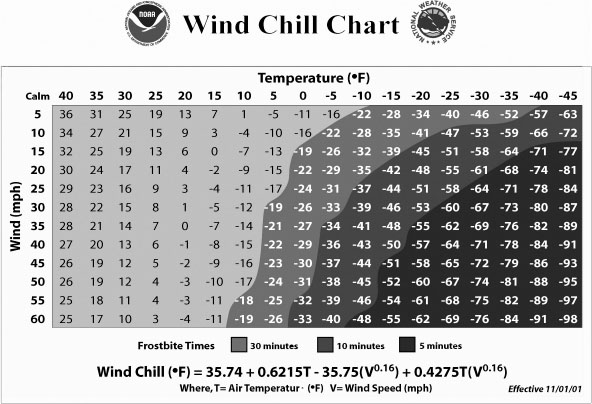
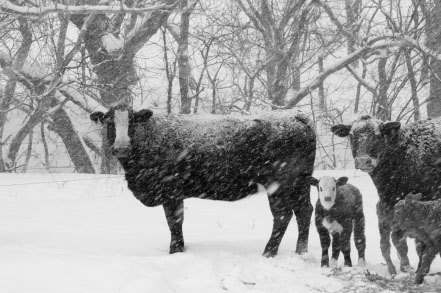
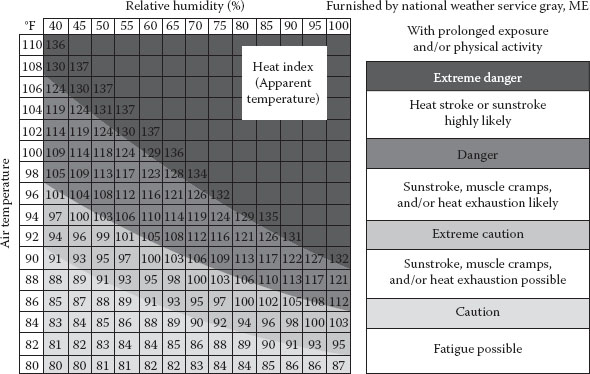