2
Understanding your company’s performance
“Not everything that can be counted counts, and not everything that counts can be counted.”
Albert Einstein
• To understand growth, you need to disaggregate it into three components (or “cylinders,” as we call them): portfolio momentum, M&A, and share gain
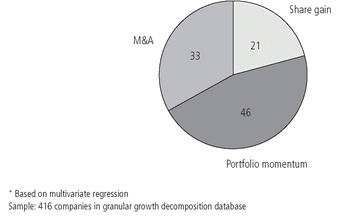
• Portfolio momentum and M&A account for almost 80 percent of what differentiates large-company growth performance; organic share gain accounts for just over 20 percent
• The average large company gets 6.6 percent growth from portfolio momentum, 3.1 percent from M&A, and 0.4 percent from share gain
• You can benchmark growth performance as robustly as you can benchmark cost performance
IN OUR EXPERIENCE, CEOs have a fairly deep understanding of the profit and cost performance of their own company and of their competitors. However, their ability to describe, explain, and compare revenues in terms of their company’s past or future growth is often much more limited. When we ask them to compare their company’s performance with that of peers, we frequently hear detailed statistics on profit performance, activity indicators, and cost benchmarks. Where growth is concerned, they sometimes mention relative market shares.
What we seldom hear, though, are apples-to-apples comparisons of top-line growth trajectories or explanations of how their company’s growth performance compares with that of rivals. Why is this? The simple answer is that making these comparisons is far from easy.
Getting to the sources of growth
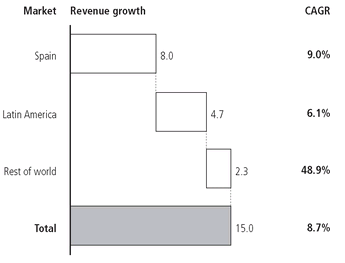
The growth performance of Telefónica, Spain’s highly successful telecom company, illustrates this well. The company has achieved strong growth in the global telecom market over the past six years, with top-line growth of 9 percent a year. The company has made a fair number of deals, notably a series of acquisitions in South America and, more recently, the purchase of Český Telecom and O2.
When we ask executives from other telecom companies to explain Telefónica’s growth, they often point to its activities in South America. Although this region has clearly contributed to Telefónica’s overall growth, as a deeper analysis of its performance between 1999 and 2005 reveals, it is not the only growth driver (
Figure 2.1). In particular, Telefónica did very well in Spain.
So why aren’t the underlying drivers of Telefónica’s growth better understood? The problem is that even when we are looking at a single company there is no easy way to make a like-for-like comparison of top-line growth performance over a period of years. To benchmark growth properly, we would have to dig deeply into segment-level data in company annual reports to establish the real sources of revenue growth. We are not the first to say this; indeed, some commentators have gone so far as to propose a new form of reporting—a “sources of revenue” statement—that tracks customer revenue back to five sources.
1€ billion, 1999-2005
Source: Dealogic; Hoovers; company reports; McKinsey analysis
For a proper comparison to be made, overall growth performance needs to be broken down into organic growth and inorganic M&A-driven growth, as the two are quite different in nature. In turn, organic growth needs to be broken down into its two components: the momentum of the portfolio a company starts with (by which we mean the growth rate of the underlying market segments) and the company’s relative market-share performance (the difference between company growth rates and relevant segment growth rates). For the aggregate numbers to be accurate, these breakdowns need to be done at the segment level.
We believe that the only way to reach a full understanding of your own current and past growth and draw accurate comparisons with competitors’ performance is to break growth down into these three components of portfolio momentum, share gain, and M&A—or growth “cylinders,” as we call them. This is what we have done in a new form of analysis that we call granular growth decomposition, or simply “decomp” (see the box “Introducing granular growth decomposition”).
INTRODUCING GRANULAR GROWTH DECOMPOSITION
A granular growth decomposition is a method of splitting a company’s growth into three main components that we call growth “cylinders”:
M&A is the net inorganic growth a company achieves when it purchases or sells revenues via acquisition or divestment.
Portfolio momentum is the organic revenue growth a company achieves through the market growth of the segments represented in its portfolio. It includes the impact of acquisitions and divestments that affect the company’s exposure to underlying market growth after the first year of the transaction.
2 Portfolio momentum is, in a sense, a measure of strategic performance.
Share gain is the organic growth a company achieves through gaining or losing market share from its competitors. We define market share by the company’s weighted average share of the segments in which it competes.
One other factor needs to be taken into account in the decomp: the effects of currency fluctuation. These can significantly distort growth measurements and, hence, perceptions of performance. A translation from one currency to another can allow companies to benefit from currency appreciation in overseas markets. Over the past few years, for instance, US companies with sales reported in Europe have benefited from the appreciation of the euro. Although we generally include currency effects in the portfolio momentum category, we sometimes highlight them separately.
McKinsey & Company has set up a dedicated team of analysts in India to perform granular growth decompositions on a large scale in order to compare companies with their peers. As each company decomp is completed, it is added to a database that provides a reference class for large-company growth performance. As far as we know, this is the only such database in the world.
At the time of writing, we have carried out granular growth decompositions for about 500 large companies, and we are adding more to our database all the time to improve our coverage while still maintaining a balanced representation of industry sectors.
Peer comparisons
To see how the granular growth decomposition can be used to gain insights into a company’s growth, let’s consider a hypothetical case.
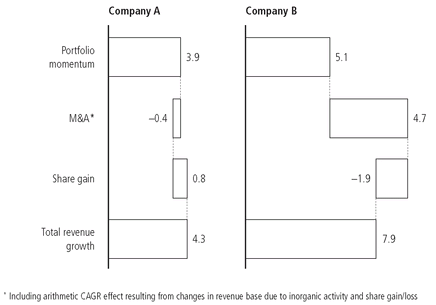
Company A grew by 4.3 percent a year between 1999 and 2005. To understand where this growth came from, we need to break it down into the three cylinders, as illustrated in the left-hand column in
Figure 2.2. This reveals that most of company A’s growth is driven by portfolio momentum. The M&A cylinder, which represents net inorganic growth over the period, shows a negative result, meaning that the company divested more businesses than it acquired. As for share gain, this made a positive contribution to company A’s overall growth, albeit a modest one. So the granular growth decomposition has shown us that company A’s business segments are in growing markets and are gaining market share.
Understanding one company’s performance by unraveling its real sources of growth is interesting, but drawing comparisons between peers or benchmarking a company against its industry can yield more valuable insights. Consider a second hypothetical company. Company B competes in the same markets as company A, and is similar in size. Its growth performance is shown in the right-hand column of
Figure 2.2.
Fig 2.2 Contrasting growth trajectories
Revenue CAGR breakdown based on local currency, 1999-2005, percent
Source: Global Insight; company reports; SDC; Dealogic; Hoovers; analyst reports; McKinsey analysis
At first glance, company B appears to be outperforming company A: in terms of top-line growth, it has delivered a compound annual growth rate of 7.9 percent, as against company A’s 4.3 percent. But a closer look reveals a more complex picture. Company B is actually losing market share. The strong contribution made by the M&A cylinder to its revenue growth—4.7 percent—is perhaps masking issues with execution elsewhere in the business. Look again at company A; in the same markets and over the same time period, it managed to gain market share. Now that we are comparing apples with apples, we are able to draw a much more accurate comparison of the two companies’ individual strengths and weaknesses.
Revenue CAGR breakdown based on local currency, 1999-2005, percent
Source: Global Insight; company reports; SDC; Dealogic; Hoovers; analyst reports; McKinsey analysis
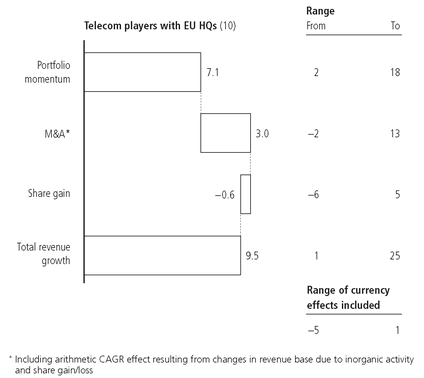
Now that we’ve seen how the granular growth decomposition works in a hypothetical case, let’s see how it applies to the real world. Our team of analysts worked for more than two months to make a detailed comparison between ten telecom companies with headquarters in Europe over the period 1999 to 2005. The results of the analysis are fascinating: they partly confirm our intuitive understanding, but hold surprises too.
As
Figure 2.3 reveals, the telecom companies’ collective growth was driven by portfolio momentum and M&A. As a group, the companies did not gain market share; on the contrary, they lost it to attackers. But these averages conceal quite startling differences in the performance of individual players. Take inorganic growth: the top performer managed to notch up a CAGR of 13 percent, while its weakest peer turned in a negative CAGR of -2 percent. Similarly, companies varied widely in terms of portfolio momentum (a range of 2 to 18 percent) and share gain (from -6 to 5 percent).
Growth for the average large company
These numbers are all very well, you might think, but what do they tell us? Let’s now look at the companies in our granular growth database to see if we can reach any useful conclusions about where companies tend to get most of their growth. To find out, we took our database of 416 companies and broke down their average performance over the period 1999-2006 into the three cylinders of growth.
3 We found some of the results surprising—and so did many of the executives with whom we shared them.
Fig 2.4 Where large companies got their growth
Average revenue CAGR breakdown, 1999-2006, percentage points
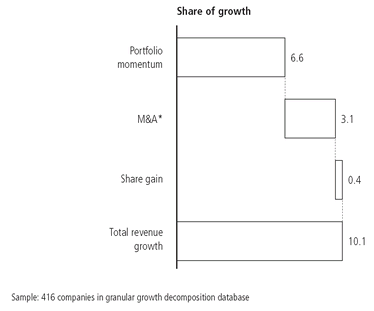
The average large company grew at 10.1 percent per year over the period (
Figure 2.4). Portfolio momentum accounted for 6.6 percent of this growth, M&A for 3.1 percent, and share gain for 0.4 percent. This means that virtually
all the growth for an average company could be explained by the underlying growth rates in its market segments, coupled with its own M&A activity. We’ll take each of these cylinders in turn.
Portfolio momentum: Thank your predecessor
Portfolio momentum accounts for 6.6 percent of a typical large company’s 10.1 percent compound annual growth rate. In other words, almost two-thirds—65 percent—of a large company’s growth is inherited: it derives from the performance of the existing portfolio. With CEO tenures being as short as they are, what this means is that when a company reports its results, much of its growth performance has been determined by decisions taken by the previous management. The former CEO of Shell, Lo van Wachem, acknowledged as much where he told management trainees in a masterclass:
“The actual revenue I realize today is grossly dependent on the energy reserves acquired and explored by the two CEOs before me, and CEOs two generations after me will reap the benefits of my effort.”
It is a lesson in humility to realize that when you are talking about growth, you may well be standing on the shoulders of giants.
M&A: More important than you think
Across all the companies in our sample, the level of M&A activity is surprisingly high. We’ll look at this in more depth in chapter 6; suffice to say here that M&A is important for growth giants and challenged companies alike. As
Figure 2.4 shows, M&A activity contributes on average 3.1 percent per year in revenue growth. In other words, a company with $10 billion in revenue is acquiring, on average, companies with $310 million in revenue that year. To understand why, we can look back at some of the companies that are featured in our “grow or go” analysis in the Introduction.
Take Schlumberger and General Dynamics, both of which made the transition from the challenged category in the first business cycle (1984-94) to the growth giant category in the second (1994-2004). General Dynamics made the leap by divesting heavily in the early 1990s as the defense market deteriorated, and then going into acquisition mode once the market offered better prospects. Schlumberger also worked its way up by actively trading its portfolio. On the one hand, it strengthened its operations in the fast-growing market of oilfield products and services by making a series of acquisitions, including Camco’s drilling products and services and Baker Hughes’ seismic services. On the other hand, it divested businesses that didn’t fit with its growth goals, such as metering, chip-testing, and IT services outside the oil industry.
If we now turn to the companies that managed to retain their growth giant status through two business cycles, we find that many of them did so by making extensive use of M&A. Some, such as GE, are renowned for the effectiveness of their M&A machine; others, such as Pfizer, are leading the consolidation of their industry. Between 1994 and 2004, when the compound annual growth rate of the pharmaceutical industry was running at 9 percent, Pfizer made several key acquisitions, buying Warner-Lambert (at that time about two-thirds its size in terms of sales) for $112 billion in 2000, and Pharmacia in 2003—a purchase that made it the world’s largest research-based pharmaceutical company.
Market share: Seldom a growth driver
One important finding that came from our analysis was that market share, as defined by a company’s weighted average share of the segments in which it competes, typically appears to play only a minor role in driving growth. It contributed just 0.4 percent per year to the average company’s growth trajectory. This is interesting news given that gaining share organically through superior execution is precisely what many management teams dedicate their efforts, planning, and tactics to achieving—sometimes to the exclusion of all else.
This poses a couple of questions. First, isn’t it only to be expected that the average company neither gains nor loses market share, since market share is a zero-sum game? Digging deep into our database, we find there are share gainers and losers, but few companies exhibit significant and sustained share gain, and those that do tend to have compelling business-model advantages. We’ll say more about this in chapter 7, which is entirely devoted to share gain. Remember, too, that we calculate share gain at the segment level, so if a given company gains share in some segments and loses it in others, the net effect will be that the two cancel each other out. We’ll explore this further as well.
Second, if large companies aren’t losing share, what about the population of smaller companies that are often thought to be growing more quickly and gaining share from incumbents? It turns out that their fate differs from country to country. Our analysis suggests that in the US, the average large company does lose a bit of market share over time, whereas its European counterpart gains a bit. Although we haven’t analyzed this in detail, we believe that it may have something to do with the greater dynamism of the US market for early-stage companies. If new entrants aren’t capturing significant market share from incumbents, perhaps they are growing by creating or redefining categories, markets, and businesses instead.
So what conclusions can we draw from all this?
Location, location, location
Ask any real-estate agent the secret of buying the right house and there’s a good chance they’ll tell you “Location, location, location.” How a house was built, what it looks like, how old it is, and how much it will cost you to transform it into the home of your dreams are not nearly so important as where it is. Location is paramount. Everything else can be fixed.
Is that true for companies too? Do the industries, sectors, and segments in which they compete matter far more than any other factor in determining their growth performance?
To answer this question we need to go back to the decomp database, this time to understand what drives the
differences among the growth rates of different companies. Using a multivariate regression, we looked at the contribution of the three growth elements to differences in company growth. As
Figure 2.5 reveals, 79 percent of what differentiates leading companies from the rest in terms of growth performance is explained by portfolio momentum and M&A—factors determined by
where a company chooses to compete. Just as in real estate, then, location matters.
In terms of the individual cylinders, portfolio momentum or market growth explains 46 percent of the difference in growth performance between large companies, highlighting the importance of market selection in driving growth.
Fig 2.5 Performance differentiation by growth component*
Percent
M&A is responsible for 33 percent of the performance difference. That is, active acquirers grow a lot faster than companies that rely on organic growth. (We discuss whether this creates value in chapter 6.)
Share gain explains on average only about 21 percent of differential growth performance,
4 so it’s hard to escape the conclusion that the effort companies put into hard work and smart execution doesn’t get them very far relative to competitors.
Put another way, a company’s choice of where to compete is almost four times more important than outperforming within its market.
At this point you may be wondering whether the relative unimportance of market share in explaining differences in growth performance applies only to certain market sectors. To find out, we compared a cross-section of industries.
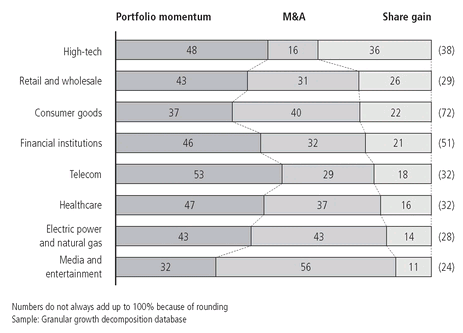
Not surprisingly, the eight sectors we examined show some variation (
Figure 2.6). However, the overall message remains the same: market share outperformance doesn’t play a significant part in the growth differences between leading companies and average performers. In most sectors it is responsible for less than a quarter of the differential. The only major exception is the high-tech sector, at 36 percent. Here, the disruptive nature of the market and the brevity of product life cycles facilitate new entry, so allowing young upstarts to challenge the market share of established players a bit more frequently than in other sectors.
Fig 2.6 Differentiation by growth cylinder and for selected sectors
Percent (number of companies)
Tailwinds or headwinds?
To explore further the part played by favorable markets—or what we call “tailwinds”—in differentiating growth performance, let’s now return to the four categories we looked at in the Introduction and apply them to a set of companies from our growth decomposition database (
Figure 2.7).
5
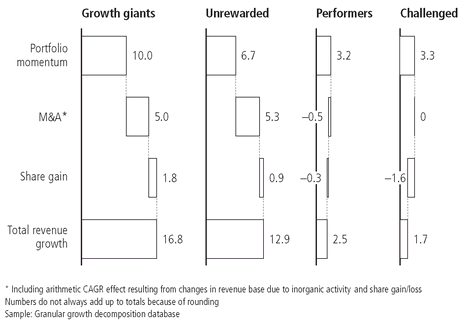
The companies with growth giant performance are helped by favorable tailwinds and substantial M&A, which together drive their performance. On average, a growth giant with revenue growth of 16.8 percent receives 10 percent from portfolio momentum and 5 percent from M&A. The remaining 1.8 percent growth comes from market-share gains.
Unrewarded companies also benefit from tailwinds. On average, they receive just over half (6.7 percent) of their total annual growth of 12.9 percent from market momentum, and slightly less (5.3 percent) from M&A. Growth in market share contributes just 0.9 percent.
The performers are in the doldrums. In fact, their portfolio momentum is below the GDP growth rate and is in some cases even negative.
Average revenue CAGR breakdown, 1999-2005, percent
The challenged companies, far from receiving favorable tailwinds, are in fact being buffeted by multiple headwinds in the markets where they operate. At 3.3 percent, their portfolio momentum is below GDP. In addition, these companies are losing market share at the rate of 1.6 percent a year.
What lessons can we draw from this? One obvious observation is that growth giants deliver, on average, more growth both overall and in each one of their cylinders—portfolio momentum, M&A, and share gain—than any other group, performers included.
It’s abundantly clear from this analysis that a company’s granular growth performance depends heavily on the markets in which it operates. So the next time a company announces stellar performance, it’s worth taking a closer look to see how much of its growth came from better steering, and how much from a favorable tailwind. What is driving performance: execution or strategic choices?
In much the same way, it’s a good idea to ask questions about your own company’s performance. Do you know your numbers on growth, and your peers’, both by segment and overall? Do you use them in your planning, performance appraisals, and external presentations? Are your plans consistent with your real sources of growth? Or are they based on possibly unrealistic hopes of gaining market share?
In the next chapter, we draw on the insights we’ve developed from the decompositions to explore the different ways in which companies have grown.
NOTES
1 M. Treacy and J. Sims, “Take command of your growth,”
Harvard Business Review, April 2004, pp. 1-9. The five sources of growth they identify are continuing sales to established customers (base retention); sales won from the competition (share gain); new sales in an expanding market (market positioning); moves into adjacent markets where core capabilities can be leveraged; and entirely new lines of business unrelated to the core.
2 Market growth within the first year after the transaction is counted as M&A for the purposes of our model; after the first year, it is classified as portfolio momentum.
3 Our granular decomposition database consisted at this point of 416 companies. We had data for the period 1999-2006 for most of them (almost 70 percent); the rest either start with 2000 data or end before 2006. Many of the analyses in this book were carried out with this full database sample of 416 companies, although some are based on an earlier version with 207 companies. We performed checks on both versions of the database to ensure the samples were representative.
4 The previous analysis showed that market share gain didn’t make a significant contribution to the growth rate of the average company. This present analysis shows that it plays a more important role in explaining the differences between companies, although it is still less significant than either portfolio momentum or M&A.
5 We took a set of US-based companies from our growth decomposition database and used their revenue and value-creation performance between 1999 and 2005 to classify them according to the four performance categories in chapter 1. (Comparable segment-level data was not available for all the companies in the sample.)


