4
A granular company
“I’m astounded by people who want to know the universe when it’s hard enough to find your way around Chinatown.”
Woody Allen
• You can use cylinder firing to benchmark your growth both at the corporate level and at the granular level
• A growth MRI can help you disaggregate your company’s performance so that you understand how your cylinders fire at the segment and sub-segment level
• The challenge for large companies is to ensure cylinder firing across a sufficient number of segments and sub-segments
• Different parts of an organization can fire on different cylinder combinations
SO FAR, WE HAVE INTRODUCED the ideas of granularity and cylinder firing as two independent concepts. We now need to combine the two. In order to get a real sense of your growth performance, you need to judge how well you are firing on cylinders at the granular segment level, not just the overall corporate level.
To make this kind of analysis possible, we have developed a tool for conducting growth scans for our clients. We call it a growth MRI.
1 It produces multiple granular views of the business and incorporates several heuristic tests to assist in the analysis. A comprehensive account of the MRI tool is outside the scope of this book, but we have included examples of the kinds of insight it affords in the following two case studies.
Combining cylinders with segments
In order to illustrate how you can apply the cylinder-firing analysis at a granular level, let’s look at the case study of a $22.5 billion consumer goods company that we’ll call GoodsCo.
GoodsCo is a challenged company as defined in the Introduction: it has a TRS of 5 percent per annum, way below the median, and a revenue growth rate below GDP. The company has been working on a turnaround and has managed to halt the downward slide that it was experiencing until 2000. Between 2001 and 2004, it achieved a CAGR of 3.2 percent (
Figure 4.1). But where did it get this growth, and which parts of the business are still struggling?
Fig 4.1 GoodsCo’s growth development
$ billion
Source: Datastream; company reports; McKinsey analysis
To find out, we carried out a decomp on GoodsCo, analyzing its revenue components over a five-year period by geographic market and by product category. We combined market research data with the company’s filed revenues, so sector revenues are approximations.
At first sight, GoodsCo appears to have produced stable albeit slow growth over the period 2001 to 2004. But let’s look at where that growth came from by examining cylinder performance for the five geographical regions in which GoodsCo operates (
Figure 4.2).
In the United States, there was strong growth from portfolio momentum, but that was partly offset by a substantial loss in market share. Europe was GoodsCo’s growth engine, with a strong organic performance on both share-gain and portfolio-momentum cylinders. Despite positive market momentum, Latin America’s performance was hurt by losses on both share gain and M&A. Although Africa/Middle East and Asia/Pacific grew nicely at 9.1 percent and 6.1 percent CAGR, respectively, their absolute contribution to growth was still small.
Fig 4.2 GoodsCo’s granular growth decomposition by region
Change in revenue, 2001-04, $ million
Source: Dealogic; Hoovers; company reports; McKinsey analysis
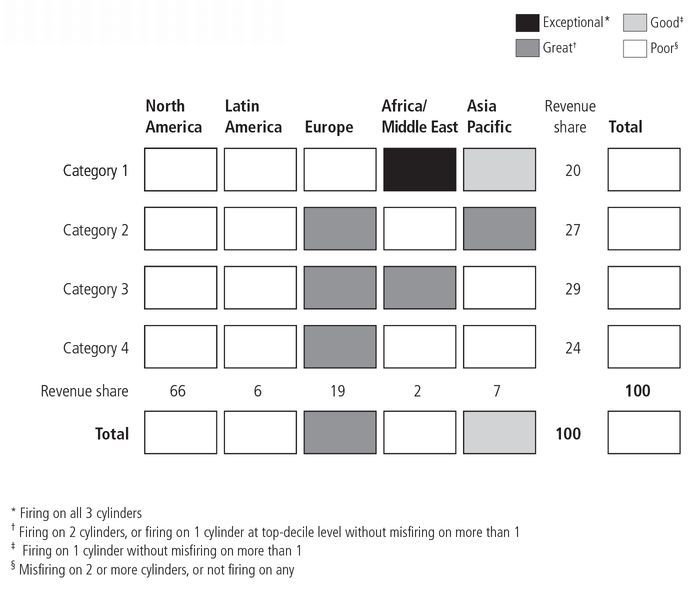
The picture gets sharper if we dig a little deeper. By disaggregating GoodsCo’s reported results further, we can look at its growth MRI in four separate categories across the five geographic regions (
Figure 4.3). When we evaluate cylinder firing at this 20-segment level, we get a much more detailed view of what has been happening at GoodsCo.
No fewer than 13 of the 20 segments are registering as poor in terms of cylinder performance; in other words, they are either not firing on any cylinders or misfiring on two or three. Unfortunately, they collectively represent almost 80 percent of the business.
On the positive side, one segment is firing at an exceptional level, although it represents just 0.2 percent of total revenues. Similarly, five segments register as great, representing about 20 percent of revenues between them, while one segment, representing 1.5 percent of revenues, is performing at a good level.
While most categories performed well in Europe, the business is misfiring in its core segments in the Americas.
To put it simply, GoodsCo appears to have a portfolio problem. With the benefit of the growth MRI analysis, we can see that it probably needs to take bold decisions to move into higher-momentum markets. In addition, GoodsCo should consider M&A and divestment opportunities if it aspires to end up with a portfolio of businesses that are firing on multiple cylinders.
Understanding firing performance
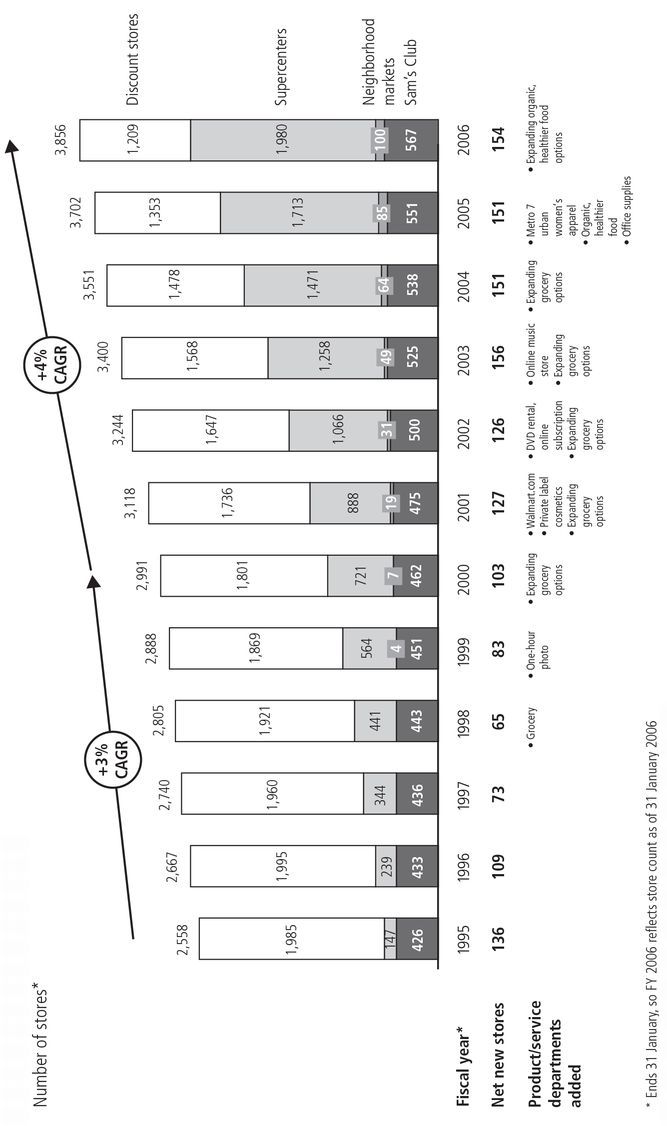
Wal-Mart provides a contrasting example, showing how a company can grow at the granular level by firing on multiple cylinders. Its growth story is a remarkable one. When founder Sam Walton died in 1992, the retail giant had achieved just over $40 billion in sales. By the year ending January 2006, revenues had reached $316 billion. Wal-Mart grew by expanding in two mutually reinforcing directions: adding more stores and selling more categories of products and services in existing stores.
From 1995 to 2006, the number of stores rose from 2,558 to 3,856 (
Figure 4.4). Despite this growing base, Wal-Mart managed to accelerate the rate of new store openings from over 3 percent a year in the first half of that period to over 4 percent in the second. At the same time as expanding its stores, Wal-Mart also introduced many new service and product categories such as one-hour photo developing, private-label cosmetics, DVD rental, health foods, and office supplies. The reinforcing nature of these two growth paths enabled Wal-Mart to achieve a CAGR in revenue of about 16 percent over the past decade while holding margin steady.
This enviable record doesn’t imply, however, that contributions to growth have been uniformly consistent or that the same cylinders are driving growth in different parts of the business. To get a more granular perspective on Wal-Mart’s growth, we can divide the business into its standard reporting segments. For the sake of simplicity we’ll keep to a dozen or so segments. In practice, though, a company of this size using its own internal data could probably break down its business into a hundred or more segments.
Source: Company filings; Hoovers; press reports; McKinsey analysis
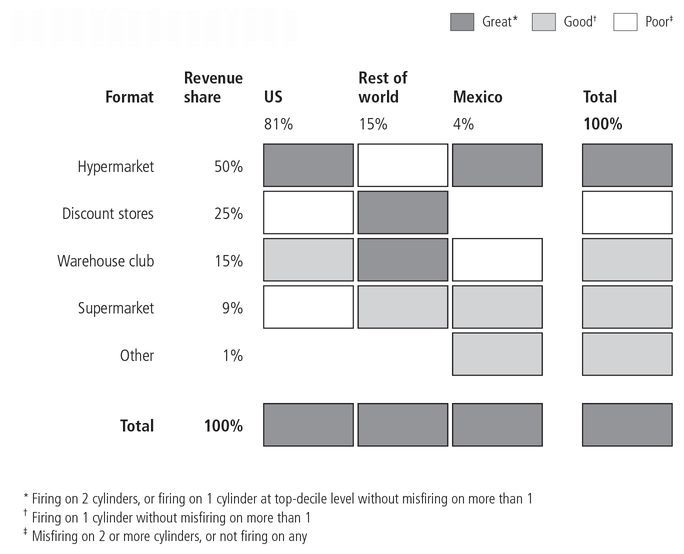
Working with January 2005 data, we can zoom in on the $285 billion of revenues. First, we can establish the growth cylinder performance of each store format using our decomposition database cutoffs. When we look at the business this way, it’s easy to see the importance of the US and the Supercenter (hypermarket) format (
Figure 4.5). This combination accounts for $130 billion in revenues and has delivered great cylinder performance. By contrast, the old discount-store format in the US posts bottom-quartile growth and poor cylinder performance.
If we take a step back, it’s clear that Wal-Mart as a whole posted a great cylinder performance. To a large extent, this is because the four segments with great cylinder performance represent a large part (almost half) of the business, in contrast to GoodsCo’s situation. Add in Wal-Mart’s good performers and you’ve covered about two-thirds of the company. In short, Wal-Mart fired on cylinders where it mattered the most.
If we then look at the data through a geographic lens, we see that the US, Mexico, and the rest of the world all posted great cylinder performance. However, different regions fired on different cylinders. Whereas portfolio momentum and organic share gain drove growth in the US as a whole, the story in the rest of the world was growth through M&A and share gain, but not portfolio momentum.
The MRI confirms that Wal-Mart, unlike GoodsCo, had good or great patterns where it really counted. Moreover, it drew on different cylinders in different countries and acted to improve its portfolio over time—a remarkable performance indeed. Even so, the MRI uncovered opportunities to fire on even more cylinders within various different businesses.
The granularity of choice
If we take a step back, both these examples raise the question of where to compete. On first seeing its growth MRI, a company may feel that it ought to improve its cylinder-firing performance in every cell. But that would be missing the point. Instead, it should view the cells with an eye to addressing “where to compete” choices—which cells to keep, which to emphasize, which to sell—before it tackles performance within individual cells.
The finer the granularity of the analysis, the better the insights for informing the growth direction will be. To see why, consider a practical example.
Let’s take a high-end European clothing retailer with a successful product line and store format for the mass-affluent segment. It is beginning to saturate the relevant parts of the European market (upmarket commercial districts in major cities) and needs to find new ways to grow. It could set about this in several different ways:
• It could expand along the geographic dimension by starting to think of itself as a high-end global clothing retailer and trying to grow its existing business by entering new markets.
• It could expand along the product dimension by defining itself simply as a high-end European retailer and attempting to grow by targeting other buying needs of the mass-affluent customer through existing stores or new formats.
• It could expand along the customer segment dimension by defining itself as a European clothing retailer and seeking to attract other customer segments beyond its mass-affluent core market. Alternatively, it could stick with its high-end customers but segment this market more finely to find new opportunities for growth.
If it had the management resources and the luxury of time, it could experiment on a small scale with all three options, trying out different combinations and scaling up the ideas that work best.
2 But if it can only focus on one big push at a time, the company will need to evaluate each growth path at a granular level to make an informed choice.
Geographic expansion: From continents to street corners
Let’s say the retailer is convinced that there is significant growth potential in the mass-affluent segment outside Europe. In addition, it feels much more comfortable betting on the power of its intellectual property (clothes design, brand, store design and layout) and on the consistency of the tastes of high-end customers around the world than on its ability to create new formats or sell items other than clothes. So it adopts an expansionary global mindset, and its next step is to decide which markets to enter first.
The texture of the market for a high-end clothing retailer starts at the macro level (in which countries or continents is the mass-affluent market growing the fastest?), but goes down to a very granular level, that of neighborhoods or commercial districts within a particular city. This is because urban districts vary so much in terms of their socio-economic mix that choosing the wrong part of town to build your store can prove fatal to your sales growth. Location can easily trump execution; at this level, geography is destiny. A quick tour of the globe serves to illustrate.
Continents. Nominal global GDP
3 grows at 6.2 percent per year. If you strip out inflation, the differences in growth rates between continents are actually quite small. Asia’s growth is only 0.3 percentage point faster than that of the world as a whole; Africa’s growth is only slightly slower in real terms; and Europe and Latin America trail by just 1 percentage point. Clearly, the real differences are to be found below the continent level.
Countries. Individual countries display greater variation in growth rates than continents do. Asia, for instance, is often labeled as a growth continent, but it doesn’t experience rapid growth across the board. China and India may be growing at 8 and 9 percent a year, respectively, but Japan and Indonesia notch up just 1 and 3 percent annual growth. Our retailer may decide to target the US market because the mass-affluent segment represents a relatively large share of the population, but it should also be aware that this segment is growing faster in emerging markets.
States and cities. Let’s assume that our retailer decides to enter the US market anyway. It still has a lot of work to do. Some states and metropolitan areas are growing considerably; others are not. If we focus on cities with populations in excess of a million people, population growth rates over the last two decennial censuses (1990 and 2000) range from 0 percent to 3 percent. If we look at affluence, the proportion of people in a city who earn over $75,000 a year can be as high as 41 percent (Washington, DC) or as small as 17 percent (Oklahoma City).
Neighborhoods, commercial districts, streets, and individual sites. At this level of granularity, a company’s strategy typically starts to blur with its execution. There is no question that the texture of the market (that is, the level of granularity at which supply, demand, and competition play out) varies from one neighborhood or commercial district to another, and often from one street to the next. In the city of New York, for instance, average per capita income varies enormously by district: in 1999, it ranged from around $8,000 in the Bronx to well above $120,000 in parts of Manhattan. There can be huge differences even within a few blocks. Retailers know that site selection is critical and that a store’s sales can depend on whether it is on this street corner or that one and whether it is right on the street or set back. Data at this level is not easily available, but Walgreens and other top retailers have developed sophisticated processes and proprietary data to help them select the best sites.
Product expansion: From categories to SKUs4
Now let’s say that our retailer is less sure of its products’ global appeal but confident that it truly understands its customer base, the mass-affluent segment of the European market. Perhaps it has invested in sophisticated research about what its customers expect from the products they buy or from their shopping experience, and has stumbled onto insights that it can apply to other areas of mass-affluent retailing. Bearing in mind its existing capabilities, it may want to confine itself to non-durable or small durable consumer goods of the type traditionally sold through department stores, such as luxury packaged food, bedding, beauty products, and jewelry. This definition is broad enough to provide significant headroom for growth while still ruling out some areas of luxury retailing, such as sports cars.
As with geography, there is virtually no limit to how granular product selection at the SKU level can go. Imagine that our retailer decides to venture into producing and selling its own brand of beauty products. If it is successful, it may then want to consider entering a series of other new categories, such as fragrances, spa products, nutraceuticals, and beauty services such as facials. Within those categories, it may then decide to vary its offering by store location: for instance, stores in a busy business district could offer express manicures for women on their lunch break, while those in shopping malls could offer one-hour facials for customers with more time.
Customer expansion: New demographics or finer segmentation
On the other hand, perhaps our European clothing retailer feels that its real expertise lies in selling clothing, so it decides to carry on doing just that but to venture into customer segments outside its mass-affluent core. It might choose this strategy if it believes that most of the growth in European retail is going to be outside the affluent segment, and if it is confident enough to take on the discount retailers that already appeal to this market. To reach new segments in this way, some retailers use innovative new formats that link into their brand but avoid diluting it, much as Gap did in 1994 by introducing Old Navy to target middle-class teenagers. Ten years later, Old Navy was generating $7 billion a year in revenue, 42 percent of Gap’s total. Banana Republic and Piperlime are other examples of Gap’s strategy of targeting differentiated customer segments.
Another option might be for our retailer to stay with the mass-affluent segment it knows so well but to operate at a more granular level within it. Instead of redefining itself, it could look at a finer segmentation of its core market. Is it really reaching everyone it could reach: men as well as women, older people as well as teenagers, children as well as adults? Looking at the multitude of sub-segments within its broad target segment should reveal many opportunities for growth. Gap offers another good example with its introduction of Baby Gap and Gap Kids to reach the children or younger siblings of its core customers.
So what is the right choice for our retailer? Only it can tell—but exploring each of these three growth paths at a granular level will give it a much better chance to pinpoint the most fertile ground for growth, avoid the temptation to opt for the “usual suspects,” and find the option that fits its capabilities and organization best.
Our analysis of the granular growth decomposition database showed that companies that fired on one or more cylinders achieved higher revenue growth and TRS performance than those that didn’t. In this chapter, we’ve seen how the growth MRI can help you understand this performance at the segment and sub-segment level. But what if you aren’t firing on one or more cylinders in some or most of your businesses? What can you do about it? How do you help your businesses to fire on more cylinders over time?
In part II, we’ll look at how you can fire on each of the three growth cylinders. We’ll then put the elements together to show a compelling way to set your overall growth direction.
NOTES
1 So called because its output resembles that from medical scanners.
2 Here, it is useful to think about the “seven degrees of freedom” concept introduced in M. A. Baghai, S. C. Coley, and D. White,
The Alchemy of Growth (Orion, London, 1999), pp. 51-60. It provides a framework for thinking about possible growth opportunities within a business at seven levels: selling existing products to existing customers; targeting new customers; introducing new products and services; trying new delivery approaches; reaching new geographies; changing the industry structure; and entering new competitive arenas.
3 We cite real GDP here so as to make a meaningful comparison of growth rates between countries. Throughout most of the rest of the book, we cite nominal output growth at the country level to facilitate comparisons with industry revenue growth rates within that country.