Introduction: Grow or go
“Should I stay or should I go?”
The Clash, 1982
• Over the long term, growth really matters to performance . . .
• . . . and to survival too: we found that companies delivering growth rates below GDP during one economic cycle were five times more likely to disappear before the next
• It is possible for a large company to sustain above-average growth and value creation over two economic cycles
• Many companies that were challenged during one cycle managed to recover during the next
• The most difficult thing is to sustain performance in the absence of growth
WE BEGIN BY focusing on a simple question: can the largest of large companies as defined by revenue hope to sustain growth over significant periods of time?
Let’s start our look at growth by going back in time and identifying the 100 largest companies in the United States in 1984.
1 We chose to look at the United States because it offers the richest stock of data on some of the biggest companies in the world, and the eighties because they are recent enough to yield meaningful performance data, yet distant enough to give us a view that spans two distinct business cycles: 1984-94 and 1994-2004. We prefer to use business cycles rather than decades or arbitrary periods of time; although different industries face different circumstances, we can be sure that the companies we’re analyzing are at least on a similar footing in terms of broad economic context if we observe them through two cycles. We’ll examine two indicators of performance over this period: revenue growth and shareholder value creation, as measured by total return to shareholders (TRS).
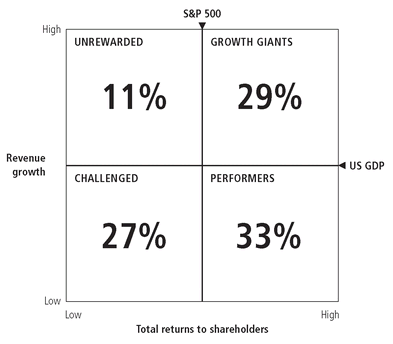
The first step is to look at company performance during the first economic cycle. We grouped our sample by value creation and by revenue growth in the two-by-two matrix illustrated in Figure
I.1, using the S&P 500 market index and US GDP as the breakpoints.
Using the market index to split the sample by value creation makes it easy to answer the practical question, “Would a shareholder rather have invested in this company or in an index fund?”
Using GDP to split the sample by revenue growth provides a point of reference to the wider economy. By measuring whether a company is gaining or losing in relation to the economy as a whole, we can understand the nature of the challenges it may face: for example, a company that grows more slowly than GDP may face a price/cost squeeze.
A company’s performance during the first cycle from 1984 to 1994 determines where it fits in the matrix. The upper-right quadrant contains those companies that have outperformed in both revenue growth and TRS (the “growth giants”). The lower-right quadrant contains those companies that have lagged in revenue growth but outperformed in value creation (the “performers”). The lower-left quadrant contains those companies that have lagged in both dimensions (the “challenged”). Finally, the upper-left quadrant contains those companies that have outperformed in revenue growth but lagged in value creation (the “unrewarded”).
Share of sample by category based on 1984-94 performance
Let’s look at each of these quadrants in turn.
Perseverance among the growth giants
At the end of the first business cycle in 1994, 29 percent of the companies in our sample qualified as growth giants. They outperformed both the economy and the stock market in terms of revenue and value creation. The median growth giant delivered shareholder returns with a compound annual growth rate (CAGR) of about 18 percent and revenue growth with a CAGR of 9 percent. Any investor would naturally be thrilled with this performance.
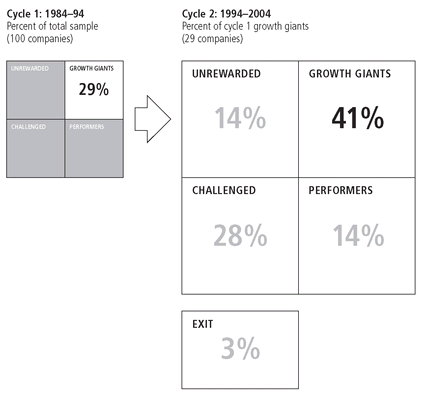
Even more impressively, if we jump to 2004 and the end of the second economic cycle, two in five of these companies (41 percent, to be precise) persisted in their performance (Figure
I.2). That is, they outperformed the economy and the market index in both revenue growth and value creation for another complete cycle.
How they fared in the second cycle
Decline among the performers
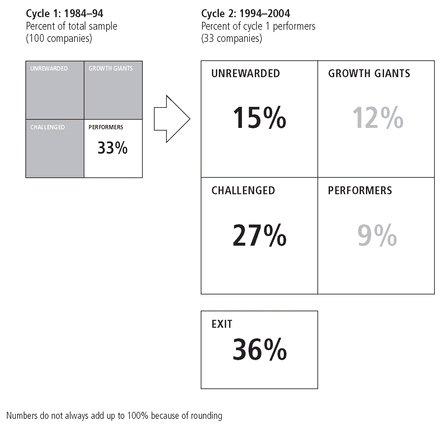
Our next group of companies, the performers, managed to reward their shareholders at growth-giant levels for the first economic cycle even though their revenue base grew more slowly than the wider economy. However, their fortunes took a turn for the worse during the second cycle (Figure
I.3). Only 9 percent or three companies out of the 33—Southern Company, Consolidated Edison, and ITT—managed to sustain the combination of continued value creation with low revenue growth through to 2004.
So what happened to the rest? Just over a third exited, most through acquisition, their boards having decided that being bought was a better deal for shareholders than continuing to operate independently. This meant that the exit rate of the performers was 12 times that of the growth giants. Nine companies (27 percent) continued to grow slowly and were unable to continue rewarding their shareholders in line with the broader market; they became “challenged” (with below-average growth and below-average shareholder value) in the next economic cycle.
How they fared in the second cycle
Another 27 percent managed to boost their revenue growth rates. Among these, four companies (Burlington Northern Santa Fe, Exxon Mobil, ConocoPhillips, and Chevron) managed to become growth giants in the next cycle by consolidating their position through M&A. The remaining five companies found revenue growth but failed to deliver commensurate shareholder value during the cycle, and joined the “unrewarded” category.
What this means is that being a performer is a tough act to sustain over the long term. Although a large company can drive value for a time by enhancing its operating performance, it will eventually hit a wall if it fails to deliver revenue growth, and will either see its returns decline or find itself an acquisition target.
The performers intrigued us. In the first cycle, they seemed rock-solid: predictable businesses with outsize returns. Without growth, though, their returns soon started to fade.
What about the companies that delivered below-average returns during the first cycle? Were they able to find growth and value creation during the next?
Resurgence among the challenged
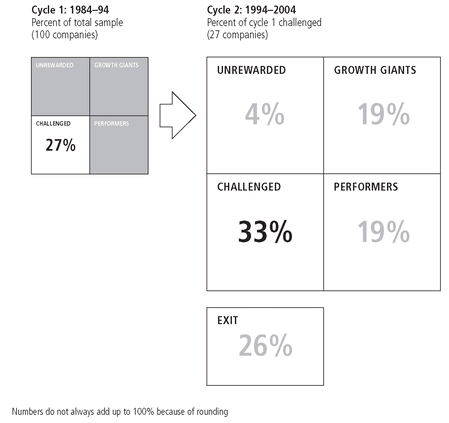
The companies in the challenged category lagged on both revenue and value creation in the first cycle, yet they actually outperformed the performers during the second cycle (Figure
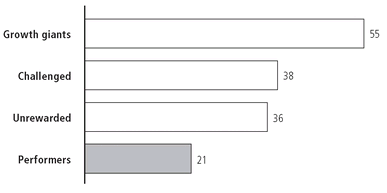
I.4). Thirty-eight percent of the challenged recovered and generated above-average shareholder returns in the second cycle, compared with only 21 percent of performers. This suggests that a performance crisis may be a better catalyst for growth than the complacency induced by achieving acceptable returns despite slow growth. As the Dutch saying goes, “Under pressure, everything becomes fluid.”
How they fared in the second cycle
Uncertainty among the unrewarded
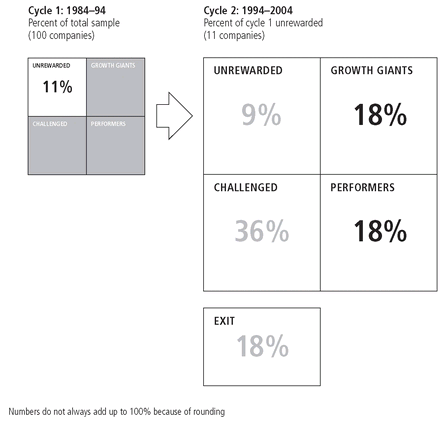
Now for the fourth group. The unrewarded companies grew faster than the US economy, but underperformed in terms of shareholder returns. More than a third of them (four companies) went on to achieve superior TRS performance during the second cycle (Figure
I.5). Another third slipped into the challenged category; 18 percent were acquired; and, notably, just 9 percent remained in the unrewarded category. Although it’s hard to draw strong conclusions from only 11 performance trajectories, they do indicate that unrewarded companies tend not to stay that way but get shifted into other groups over time.
How they fared in the second cycle
Growth, survival, and value creation
What broad insights can we draw from this look at long-term performance?
First, growth really does matter, and not just to a company’s performance, but to its very survival. Strikingly, a company that grew more slowly than GDP for the first economic cycle was five times more likely to disappear as a going concern before the end of the next cycle than a company that expanded more rapidly. This is particularly interesting in light of the fact that the survival rates of high-TRS and low-TRS companies are quite similar. Clearly, growth and not TRS is the differentiator here.
Moreover, companies with above-average revenue growth during the first cycle, whether or not it was accompanied by superior value creation, were more likely to exhibit above-average TRS during the next cycle. Two-fifths of the first-cycle growth giants sustained their performance in both revenue and value creation through the second cycle, and more than half (55 percent) continued creating value at a high rate. Interestingly, both the challenged and unrewarded companies had a better chance of surviving and achieving high TRS during the second cycle than the performers did. It was the performers that faced the worst odds (Figure
I.6).
Share of companies that outperformed market in TRS in cycle 2 (1994-2004), percent
Why is this the case? Although surprising at first sight, the plight of the performers stands to reason when you think about it: during the first cycle many of these companies competed in industry sectors that were growing slowly (or “lacking a tailwind,” as we put it). These sectors consolidated during the next cycle.
Most of the performers that were not acquired continue to struggle with low revenue and earnings growth. Because of the nature of the segments in which they participate, they aren’t in a position to capture enough gains solely by reducing costs or restructuring to compensate for the lack of top-line growth. Growth could come only if they were to embark on an acquisition program or change their business mix. In terms of our two-by-two matrix, there was a big shift to the left in the second cycle as expectations for future value creation in the form of TRS declined.
You might ask if this phenomenon is confined to the United States. The answer is no; we see similar patterns elsewhere.
In Europe, too, sustained revenue growth is the key to long-term value creation. Companies that are growing slowly have underperformed the market over a ten- to twenty-year timeframe. Slow growers are less likely to be acquired, partly because most of the region’s M&A has taken place in the sectors where the action is, such as pharmaceuticals. Another reason, perhaps, is that the consolidation of companies across individual countries has yet to happen in full force. Over time, we can expect it to increase, particularly given the fragmentation of sectors by country. As private equity becomes ever more important it could accelerate this trend, especially at the point of exit.
In Asia, performance and growth are linked in much the same way. Where we can obtain reliable data extending back over two business cycles, we have performed the same analysis on the largest companies in major markets such as Japan, Australia, Taiwan, India, Malaysia, Indonesia, Hong Kong, and Korea. In nearly all of them, as in the US, very few companies manage to outperform the market across two business cycles without growing faster than GDP. The main difference, with the exception of Australia and, increasingly, Japan, is that Asia’s M&A markets are less developed so that the penalty for underperformance is less likely to be exit via acquisition.
Time to go?
Companies that don’t increase their top line eventually hit a “TRS wall” and often become targets for acquisition. Even the largest companies may well find themselves grappling with fundamental “grow or go” decisions.
This is not to say that companies should make staying independent their overriding objective. The value of selling is often underestimated. Exit through acquisition can be the right strategy, and often creates great value for shareholders. Our analysis of challenged companies shows that of those that chose to sell, the ones that did best were those that delivered shareholder returns comparable to those of performers and growth giants, and sold out early rather than late.
Among US “local exchange” telecom operators in the period after divestiture,
2 two of the companies that chose to sell, namely Ameritech and BellSouth, have outperformed the companies that survived to see 2007, namely the “new AT&T” (the renamed SBC Communications) and Verizon (which began life as Bell Atlantic). It’s interesting to note that Ameritech, one of the first to sell, did best of all for its shareholders by selling in 1999, taking advantage of market timing as investor enthusiasm for all things telecom pushed valuations to unprecedented heights. The overall picture is somewhat more complex than it may appear, however. The new AT&T has enjoyed an exceptional 34 percent TRS in the past year and has assembled a set of assets through M&A over the years that give it a broad leadership position in the US telecom industry.
Selling may or may not be the right thing to do, but companies would be well advised to bear it in mind as a viable option for at least part of their portfolio. After studying the relationship between growth and value creation in great detail, we have come to the conclusion that companies face a stark choice: they must either grow or go.
• Our analysis of the sources of TRS highlights revenue growth, operating margins, distributions of cash to shareholders, and changes in expectations of returns as the key determinants of long-term value creation.
• There are two ways to grow: fast growth with stable or improving operating margins, or moderate growth with improving operating margins.
• In the absence of growth, there are two ways to go and still create value: by returning significant amounts of capital or exiting through acquisition.
• Over the long term, any other course of action is likely to produce below-average returns.
For those of you who would like to understand the case for growth in greater depth, we have included two appendices that explain the analysis in more detail.
Finally, we should note that growth does not necessarily come at the expense of increased risk. High-growth companies don’t exhibit higher beta or volatility than low-growth companies.
3 Indeed, in a dynamic global marketplace, standing still is likely to be the riskier strategy in the long term.
NOTES
1 The sample was derived from the top 100 companies by market capitalization and the top 100 by revenue. Seventy-five of the companies in our sample belonged to both lists; the rest came in roughly equal numbers from each one.
2 On 1 January 1984, AT&T’s local operations were split into seven independent regional Bell operating companies or “baby Bells”: v, Bell Atlantic, BellSouth, NYNEX, Pacific Telesis, Southwestern Bell, and US West.
3 To shed some light on this question, we analyzed the relationship between growth and market risk. We calculated the average beta (the sensitivity of a single stock or entire portfolio to broad market movements) for the four categories of companies in our database, as well as the share-price volatility. We found no significant difference overall between lower- and higher-growth companies in terms of beta or volatility.
