6
PROJECT SCHEDULE MANAGEMENT
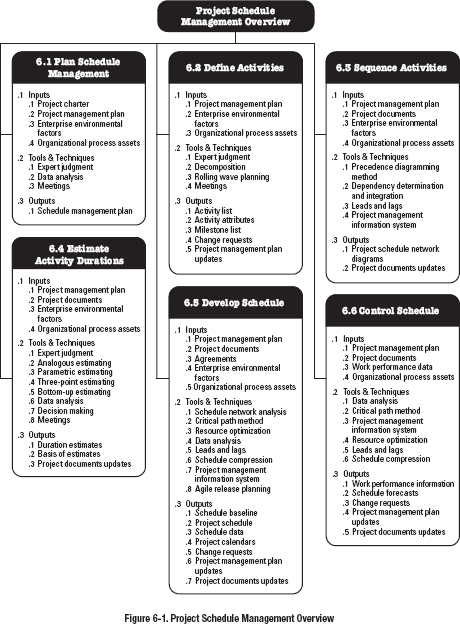
Project Schedule Management includes the processes required to manage the timely completion of the project. The Project Schedule Management processes are:
6.1 Plan Schedule Management—The process of establishing the policies, procedures, and documentation for planning, developing, managing, executing, and controlling the project schedule.
6.2 Define Activities—The process of identifying and documenting the specific actions to be performed to produce the project deliverables.
6.3 Sequence Activities—The process of identifying and documenting relationships among the project activities.
6.4 Estimate Activity Durations—The process of estimating the number of work periods needed to complete individual activities with the estimated resources.
6.5 Develop Schedule—The process of analyzing activity sequences, durations, resource requirements, and schedule constraints to create the project schedule model for project execution and monitoring and controlling.
6.6 Control Schedule—The process of monitoring the status of the project to update the project schedule and manage changes to the schedule baseline.
Figure 6-1 provides an overview of the Project Schedule Management processes. The Project Schedule Management processes are presented as discrete processes with defined interfaces while, in practice, they overlap and interact in ways that cannot be completely detailed in the PMBOK® Guide.
KEY CONCEPTS FOR PROJECT SCHEDULE MANAGEMENT
Project scheduling provides a detailed plan that represents how and when the project will deliver the products, services, and results defined in the project scope and serves as a tool for communication, managing stakeholders’ expectations, and as a basis for performance reporting.
The project management team selects a scheduling method, such as critical path or an agile approach. Then, the project-specific data, such as the activities, planned dates, durations, resources, dependencies, and constraints, are entered into a scheduling tool to create a schedule model for the project. The result is a project schedule. Figure 6-2 provides a scheduling overview that shows how the scheduling method, scheduling tool, and outputs from the Project Schedule Management processes interact to create a schedule model.
For smaller projects, defining activities, sequencing activities, estimating activity durations, and developing the schedule model are so tightly linked that they are viewed as a single process that can be performed by a person over a relatively short period of time. These processes are presented here as distinct elements because the tools and techniques for each process are different. Some of these processes are presented more fully in the Practice Standard for Scheduling [2].
When possible, the detailed project schedule should remain flexible throughout the project to adjust for knowledge gained, increased understanding of the risk, and value-added activities.

TRENDS AND EMERGING PRACTICES IN PROJECT SCHEDULE MANAGEMENT
With high levels of uncertainty and unpredictability in a fast-paced, highly competitive global marketplace where long term scope is difficult to define, it is becoming even more important to have a contextual framework for effective adoption and tailoring of development practices to respond to the changing needs of the environment. Adaptive planning defines a plan but acknowledges that once work starts, the priorities may change and the plan needs to reflect this new knowledge.
Some of the emerging practices for project scheduling methods include but are not limited to:
- Alterative scheduling with a backlog. This is a form of rolling wave planning based on adaptive life cycles, such as the agile approach for product development. The requirements are documented in user stories that are then prioritized and refined just prior to construction, and the product features are developed using time-boxed periods of work. This approach is often used to deliver incremental value to the customer or when multiple teams can concurrently develop a large number of features that have few interconnected dependencies. This scheduling method is appropriate for many projects as indicated by the widespread and growing use of adaptive life cycles for product development. The benefit of this approach is that it welcomes changes throughout the development life cycle.
- On-demand scheduling. This approach, typically used in a Kanban system, is based on the theory-of-constraints and pull-based scheduling concepts from lean manufacturing to limit a team's work in progress in order to balance demand against the team's delivery throughput. On-demand scheduling does not rely on a schedule that was developed previously for the development of the product or product increments, but rather pulls work from a backlog or intermediate queue of work to be done immediately as resources become available. On-demand scheduling is often used for projects that evolve the product incrementally in operational or sustainment environments, and where tasks may be made relatively similar in size and scope or can be bundled by size and scope.
TAILORING CONSIDERATIONS
Because each project is unique, the project manager may need to tailor the way Project Schedule Management processes are applied. Considerations for tailoring include but are not limited to:
- Life cycle approach. What is the most appropriate life cycle approach that allows for a more detailed schedule?
- Resource availability. What are the factors influencing durations (such as the correlation between available resources and their productivity)?
- Project dimensions. How will the presence of project complexity, technological uncertainty, product novelty, pace, or progress tracking (such as earned value, percentage complete, red-yellow-green (stop light) indicators) impact the desired level of control?
- Technology support. Is technology used to develop, record, transmit, receive, and store project schedule model information and is it readily accessible?
For more specific information regarding scheduling, refer to the Practice Standard for Scheduling [16].
CONSIDERATIONS FOR AGILE/ADAPTIVE ENVIRONMENTS
Adaptive approaches use short cycles to undertake work, review the results, and adapt as necessary. These cycles provide rapid feedback on the approaches and suitability of deliverables, and generally manifest as iterative scheduling and on-demand, pull-based scheduling, as discussed in the section on Key Trends and Emerging Practices in Project Schedule Management.
In large organizations, there may be a mixture of small projects and large initiatives requiring long-term roadmaps to manage the development of these programs using scaling factors (e.g., team size, geographical distribution, regulatory compliance, organizational complexity, and technical complexity). To address the full delivery life cycle for larger, enterprise-wide systems, a range of techniques utilizing a predictive approach, adaptive approach, or a hybrid of both, may need to be adopted. The organization may need to combine practices from several core methods, or adopt a method that has already done so, and adopt a few principles and practices of more traditional techniques.
The role of the project manager does not change based on managing projects using a predictive development life cycle or managing projects in adaptive environments. However, to be successful in using adaptive approaches, the project manager will need to be familiar with the tools and techniques to understand how to apply them effectively.
6.1 PLAN SCHEDULE MANAGEMENT
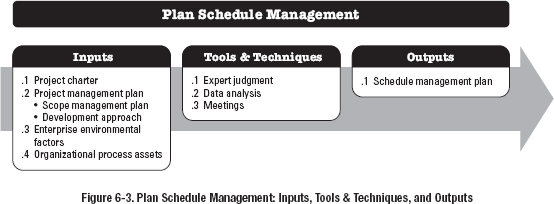
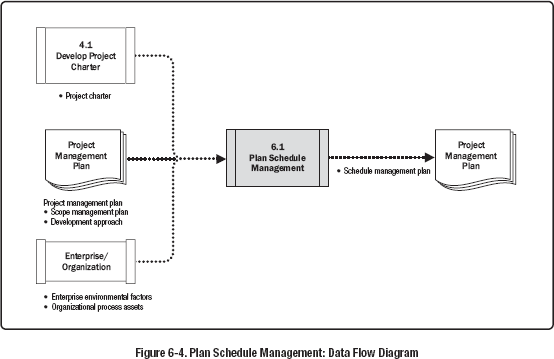
Plan Schedule Management is the process of establishing the policies, procedures, and documentation for planning, developing, managing, executing, and controlling the project schedule. The key benefit of this process is that it provides guidance and direction on how the project schedule will be managed throughout the project. This process is performed once or at predefined points in the project. The inputs, tools and techniques, and outputs of the process are depicted in Figure 6-3. Figure 6-4 depicts the data flow diagram for the process.
6.1.1 PLAN SCHEDULE MANAGEMENT: INPUTS
6.1.1.1 PROJECT CHARTER
Described in Section 4.1.3.1. The project charter defines the summary milestone schedule that will influence the management of the project schedule.
6.1.1.2 PROJECT MANAGEMENT PLAN
Described in Section 4.3.2.1. Project management plan components include but are not limited to:
- Scope management plan. Described in Section 5.1.3.1. The scope management plan describes how the scope will be defined and developed, which will provide information on how the schedule will be developed.
- Development approach. Described in Section 4.2.3.1. The product development approach will help define the scheduling approach, estimating techniques, scheduling tools, and techniques for controlling the schedule.
6.1.1.3 ENTERPRISE ENVIRONMENTAL FACTORS
The enterprise environmental factors that can influence the Plan Schedule Management process include but are not limited to:
- Organizational culture and structure,
- Team resource availability and skills and physical resource availability,
- Scheduling software,
- Guidelines and criteria for tailoring the organization's set of standard processes and procedures to satisfy the specific needs of the project, and
- Commercial databases, such as standardized estimating data.
6.1.1.4 ORGANIZATIONAL PROCESS ASSETS
The organizational process assets that can influence the Plan Schedule Management process include but are not limited to:
- Historical information and lessons learned repositories;
- Existing formal and informal schedule development, management- and control-related policies, procedures, and guidelines;
- Templates and forms; and
- Monitoring and reporting tools.
6.1.2 PLAN SCHEDULE MANAGEMENT: TOOLS AND TECHNIQUES
6.1.2.1 EXPERT JUDGMENT
Described in Section 4.1.2.1 Expertise should be considered from individuals or groups with specialized knowledge or training in previous, similar projects:
- Schedule development, management, and control;
- Scheduling methodologies (e.g., predictive or adaptive life cycle);
- Scheduling software; and
- The specific industry for which the project is developed.
6.1.2.2 DATA ANALYSIS
A data analysis technique that can be used for this process includes but is not limited to alternatives analysis. Alternatives analysis can include determining which schedule methodology to use, or how to combine various methods on the project. It can also include determining how detailed the schedule needs to be, the duration of waves for rolling wave planning, and how often it should be reviewed and updated. An appropriate balance between the level of detail needed to manage the schedule and the amount of time it takes to keep it up to date needs to be reached for each project.
6.1.2.3 MEETINGS
Project teams may hold planning meetings to develop the schedule management plan. Participants at these meetings may include the project manager, the project sponsor, selected project team members, selected stakeholders, anyone with responsibility for schedule planning or execution, and others as needed.
6.1.3 PLAN SCHEDULE MANAGEMENT: OUTPUTS
6.1.3.1 SCHEDULE MANAGEMENT PLAN
The schedule management plan is a component of the project management plan that establishes the criteria and the activities for developing, monitoring, and controlling the schedule. The schedule management plan may be formal or informal, highly detailed, or broadly framed based on the needs of the project, and includes appropriate control thresholds.
The schedule management plan can establish the following:
- Project schedule model development. The scheduling methodology and the scheduling tool to be used in the development of the project schedule model are specified.
- Release and iteration length. When using an adaptive life cycle, the time-boxed periods for releases, waves, and iterations are specified. Time-boxed periods are durations during which the team works steadily toward completion of a goal. Time-boxing helps to minimize scope creep as it forces the teams to process essential features first, then other features when time permits.
- Level of accuracy. The level of accuracy specifies the acceptable range used in determining realistic activity duration estimates and may include an amount for contingencies.
- Units of measure. Each unit of measurement (such as staff hours, staff days, or weeks for time measures, or meters, liters, tons, kilometers, or cubic yards for quantity measures) is defined for each of the resources.
- Organizational procedures links. The work breakdown structure (WBS) (Section 5.4) provides the framework for the schedule management plan, allowing for consistency with the estimates and resulting schedules.
- Project schedule model maintenance. The process used to update the status and record progress of the project in the schedule model during the execution of the project is defined.
- Control thresholds. Variance thresholds for monitoring schedule performance may be specified to indicate an agreed-upon amount of variation to be allowed before some action needs to be taken. Thresholds are typically expressed as percentage deviations from the parameters established in the baseline plan.
- Rules of performance measurement. Earned value management (EVM) rules or other physical measurement rules of performance measurement are set. For example, the schedule management plan may specify:
- Rules for establishing percent complete,
- EVM techniques (e.g., baselines, fixed-formula, percent complete, etc.) to be employed (for more specific information, refer to the Practice Standard for Earned Value Management [17]), and
- Schedule performance measurements such as schedule variance (SV) and schedule performance index (SPI) used to assess the magnitude of variation to the original schedule baseline.
- Reporting formats. The formats and frequency for the various schedule reports are defined.
6.2 DEFINE ACTIVITIES
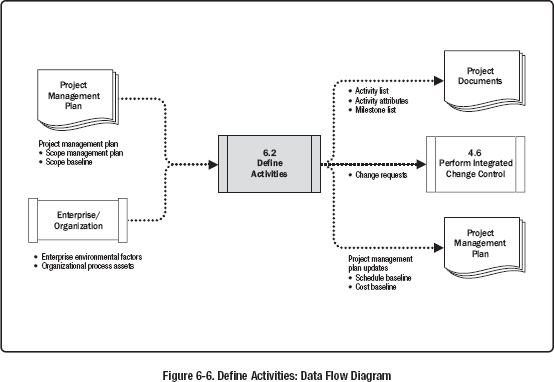
Define Activities is the process of identifying and documenting the specific actions to be performed to produce the project deliverables. The key benefit of this process is that it decomposes work packages into schedule activities that provide a basis for estimating, scheduling, executing, monitoring, and controlling the project work. This process is performed throughout the project. The inputs, tools and techniques, and outputs of this process are depicted in Figure 6-5. Figure 6-6 depicts the data flow diagram of the process.

6.2.1 DEFINE ACTIVITIES: INPUTS
6.2.1.1 PROJECT MANAGEMENT PLAN
Described in Section 4.2.3.1. Project management plan components include but are not limited to:
- Schedule management plan. Described in Section 6.1.3.1. The schedule management plan defines the schedule methodology, the duration of waves for rolling wave planning, and the level of detail necessary to manage the work.
- Scope baseline. Described in Section 5.4.3.1. The project WBS, deliverables, constraints, and assumptions documented in the scope baseline are considered explicitly while defining activities.
6.2.1.2 ENTERPRISE ENVIRONMENTAL FACTORS
Enterprise environmental factors that influence the Define Activities process include but are not limited to:
- Organizational cultures and structure,
- Published commercial information from commercial databases, and
- Project management information system (PMIS).
6.2.1.3 ORGANIZATIONAL PROCESS ASSETS
The organizational process assets that can influence the Define Activities process include but are not limited to:
- Lessons learned repository containing historical information regarding activity lists used by previous similar projects,
- Standardized processes,
- Templates that contain a standard activity list or a portion of an activity list from a previous project, and
- Existing formal and informal activity planning-related policies, procedures, and guidelines, such as the scheduling methodology, that are considered in developing the activity definitions.
6.2.2 DEFINE ACTIVITIES: TOOLS AND TECHNIQUES
6.2.2.1 EXPERT JUDGMENT
Described in Section 4.1.2.1. Expertise should be considered from individuals or groups with specialized knowledge of similar past projects and the work being performed.
6.2.2.2 DECOMPOSITION
Described in Section 5.4.2.2. Decomposition is a technique used for dividing and subdividing the project scope and project deliverables into smaller, more manageable parts. Activities represent the effort needed to complete a work package. The Define Activities process defines the final outputs as activities rather than deliverables, as done in the Create WBS process (Section 5.4).
The activity list, WBS, and WBS dictionary can be developed either sequentially or concurrently, with the WBS and WBS dictionary used as the basis for development of the final activity list. Each work package within the WBS is decomposed into the activities required to produce the work package deliverables. Involving team members in the decomposition can lead to better and more accurate results.
6.2.2.3 ROLLING WAVE PLANNING
Rolling wave planning is an iterative planning technique in which the work to be accomplished in the near term is planned in detail, while work further in the future is planned at a higher level. It is a form of progressive elaboration applicable to work packages, planning packages, and release planning when using an agile or waterfall approach. Therefore, work can exist at various levels of detail depending on where it is in the project life cycle. During early strategic planning when information is less defined, work packages may be decomposed to the known level of detail. As more is known about the upcoming events in the near term, work packages can be decomposed into activities.
6.2.2.4 MEETINGS
Meetings may be face-to-face, virtual, formal, or informal. Meetings may be held with team members or subject matter experts to define the activities needed to complete the work.
6.2.3 DEFINE ACTIVITIES: OUTPUTS
6.2.3.1 ACTIVITY LIST
The activity list includes the schedule activities required on the project. For projects that use rolling wave planning or agile techniques, the activity list will be updated periodically as the project progresses. The activity list includes an activity identifier and a scope of work description for each activity in sufficient detail to ensure that project team members understand what work is required to be completed.
6.2.3.2 ACTIVITY ATTRIBUTES
Activity attributes extend the description of the activity by identifying multiple components associated with each activity. The components for each activity evolve over time. During the initial stages of the project, they include the unique activity identifier (ID), WBS ID, and activity label or name. When completed, they may include activity descriptions, predecessor activities, successor activities, logical relationships, leads and lags (Section 6.3.2.3), resource requirements, imposed dates, constraints, and assumptions. Activity attributes can be used to identify the place where the work has to be performed, the project calendar the activity is assigned to, and the type of effort involved. Activity attributes are used for schedule development and for selecting, ordering, and sorting the planned schedule activities in various ways within reports
6.2.3.3 MILESTONE LIST
A milestone is a significant point or event in a project. A milestone list identifies all project milestones and indicates whether the milestone is mandatory, such as those required by contract, or optional, such as those based on historical information. Milestones have zero duration because they represent a significant point or event.
6.2.3.4 CHANGE REQUESTS
Described in Section 4.3.3.4. Once the project has been baselined, the progressive elaboration of deliverables into activities may reveal work that was not initially part of the project baselines. This may result in a change request. Change requests are processed for review and disposition through the Perform Integrated Change Control process (Section 4.6).
6.2.3.5 PROJECT MANAGEMENT PLAN UPDATES
Any change to the project management plan goes through the organization's change control process via a change request. Components that may require a change request for the project management plan include but are not limited to:
- Schedule baseline. Described in Section 6.5.3.1. Throughout the project, work packages are progressively elaborated into activities. This process may reveal work that was not part of the initial schedule baseline, necessitating a change to delivery dates or other significant schedule milestones that are part of the schedule baseline.
- Cost baseline. Described in Section 7.3.3.1. Changes to the cost baseline are incorporated in response to approved changes in schedule activities.
6.3 SEQUENCE ACTIVITIES
Sequence Activities is the process of identifying and documenting relationships among the project activities. The key benefit of this process is that it defines the logical sequence of work to obtain the greatest efficiency given all project constraints. This process is performed throughout the project. The inputs, tools and techniques, and outputs of this process are depicted in Figure 6-7. Figure 6-8 depicts the data flow diagram of the process.

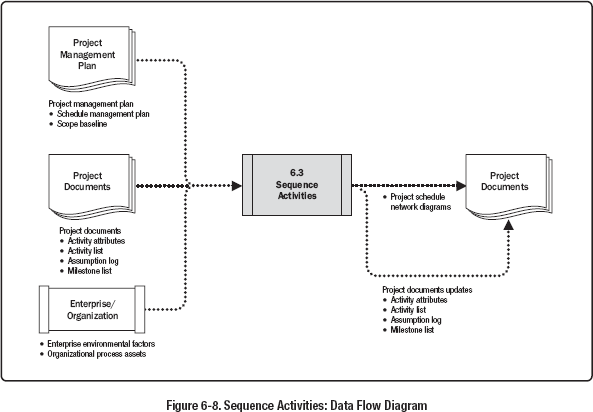
Every activity except the first and last should be connected to at least one predecessor and at least one successor activity with an appropriate logical relationship. Logical relationships should be designed to create a realistic project schedule. It may be necessary to use lead or lag time between activities to support a realistic and achievable project schedule. Sequencing can be performed by using project management software or by using manual or automated techniques. The Sequence Activities process concentrates on converting the project activities from a list to a diagram to act as a first step to publish the schedule baseline.
6.3.1 SEQUENCE ACTIVITIES: INPUTS
6.3.1.1 PROJECT MANAGEMENT PLAN
Described in Section 4.2.3.1. Project management plan components include but are not limited to:
- Schedule management plan. Described in Section 6.1.3.1. The schedule management plan defines the method used and the level of accuracy along with other criteria required to sequence activities.
- Scope baseline. Described in Section 5.4.3.1. The project WBS, deliverables, constraints, and assumptions documented in the scope baseline are considered explicitly while sequencing activities.
6.3.1.2 PROJECT DOCUMENTS
Project documents that can be considered as inputs for this process include but are not limited to:
- Activity attributes. Described in Section 6.2.3.2. Activity attributes may describe a necessary sequence of events or defined predecessor or successor relationships, as well as defined lead and lag and logical relationships between the activities.
- Activity list. Described in Section 6.2.3.1. The activity list contains all schedule activities required on the project that are to be sequenced. Dependencies and other constraints for these activities can influence the sequencing of the activities.
- Assumption log. Described in Section 4.1.3.2. Assumptions and constraints recorded in the assumption log may influence the way activities are sequenced, the relationship between activities, and the need for leads and lags, and may give rise to individual project risks that may impact the project schedule.
- Milestone list. Described in Section 6.2.3.3. The milestone list may have scheduled dates for specific milestones, which may influence the way activities are sequenced.
6.3.1.3 ENTERPRISE ENVIRONMENTAL FACTORS
The enterprise environmental factors that can influence the Sequence Activities process include but are not limited to:
- Government or industry standards,
- Project management information system (PMIS),
- Scheduling tools, and
- Organization work authorization systems.
6.3.1.4 ORGANIZATIONAL PROCESS ASSETS
The organizational process assets that can influence the Sequence Activities process include but are not limited to:
- Portfolio and program plans and project dependencies and relationships;
- Existing formal and informal activity planning-related policies, procedures, and guidelines, such as the scheduling methodology that is considered in developing logical relationships;
- Templates that can be used to expedite the preparation of networks for project activities. Related activity attributes information in templates can also contain additional descriptive information useful in sequencing activities; and
- Lessons learned repository containing historical information that can help optimize the sequencing process.
6.3.2 SEQUENCE ACTIVITIES: TOOLS AND TECHNIQUES
6.3.2.1 PRECEDENCE DIAGRAMMING METHOD
The precedence diagramming method (PDM) is a technique used for constructing a schedule model in which activities are represented by nodes and are graphically linked by one or more logical relationships to show the sequence in which the activities are to be performed.
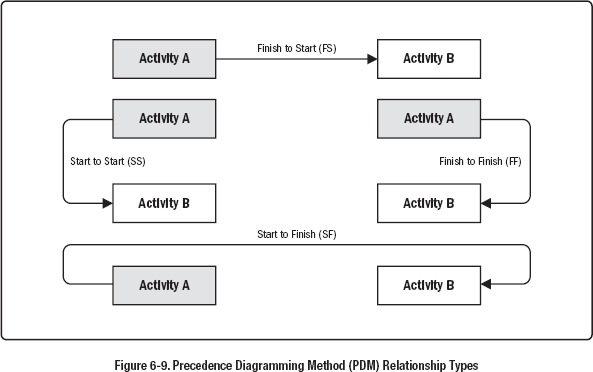
PDM includes four types of dependencies or logical relationships. A predecessor activity is an activity that logically comes before a dependent activity in a schedule. A successor activity is a dependent activity that logically comes after another activity in a schedule. These relationships are defined below and are illustrated in Figure 6-9:
- Finish-to-start (FS). A logical relationship in which a successor activity cannot start until a predecessor activity has finished. For example, installing the operating system on a PC (successor) cannot start until the PC hardware is assembled (predecessor).
- Finish-to-finish (FF). A logical relationship in which a successor activity cannot finish until a predecessor activity has finished. For example, writing a document (predecessor) is required to finish before editing the document (successor) can finish.
- Start-to-start (SS). A logical relationship in which a successor activity cannot start until a predecessor activity has started. For example, level concrete (successor) cannot begin until pour foundation (predecessor) begins.
- Start-to-finish (SF). A logical relationship in which a successor activity cannot finish until a predecessor activity has started. For example, a new accounts payable system (successor) has to start before the old accounts payable system can be shut down (predecessor).
In PDM, FS is the most commonly used type of precedence relationship. The SF relationship is very rarely used, but is included to present a complete list of the PDM relationship types.
Two activities can have two logical relationships at the same time (for example, SS and FF). Multiple relationships between the same activities are not recommended, so a decision has to be made to select the relationship with the highest impact. Closed loops are also not recommended in logical relationships.
6.3.2.2 DEPENDENCY DETERMINATION AND INTEGRATION
Dependencies may be characterized by the following attributes: mandatory or discretionary, internal or external (as described below). Dependency has four attributes, but two can be applicable at the same time in the following ways: mandatory external dependencies, mandatory internal dependencies, discretionary external dependencies, or discretionary internal dependencies.
- Mandatory dependencies. Mandatory dependencies are those that are legally or contractually required or inherent in the nature of the work. Mandatory dependencies often involve physical limitations, such as on a construction project, where it is impossible to erect the superstructure until after the foundation has been built, or on an electronics project, where a prototype has to be built before it can be tested. Mandatory dependencies are sometimes referred to as hard logic or hard dependencies. Technical dependencies may not be mandatory. The project team determines which dependencies are mandatory during the process of sequencing the activities. Mandatory dependencies should not be confused with assigning schedule constraints in the scheduling tool.
- Discretionary dependencies. Discretionary dependencies are sometimes referred to as preferred logic, preferential logic, or soft logic. Discretionary dependencies are established based on knowledge of best practices within a particular application area or some unusual aspect of the project where a specific sequence is desired, even though there may be other acceptable sequences. For example, generally accepted best practices recommend that during construction, the electrical work should start after finishing the plumbing work. This order is not mandatory and both activities may occur at the same time (in parallel), but performing the activities in sequential order reduces the overall project risk. Discretionary dependencies should be fully documented since they can create arbitrary total float values and can limit later scheduling options. When fast tracking techniques are employed, these discretionary dependencies should be reviewed and considered for modification or removal. The project team determines which dependencies are discretionary during the process of sequencing the activities.
- External dependencies. External dependencies involve a relationship between project activities and non-project activities. These dependencies are usually outside of the project team's control. For example, the testing activity in a software project may be dependent on the delivery of hardware from an external source, or governmental environmental hearings may need to be held before site preparation can begin on a construction project. The project management team determines which dependencies are external during the process of sequencing the activities.
- Internal dependencies. Internal dependencies involve a precedence relationship between project activities and are generally inside the project team's control. For example, if the team cannot test a machine until they assemble it, there is an internal mandatory dependency. The project management team determines which dependencies are internal during the process of sequencing the activities.
6.3.2.3 LEADS AND LAGS
A lead is the amount of time a successor activity can be advanced with respect to a predecessor activity. For example, on a project to construct a new office building, the landscaping could be scheduled to start 2 weeks prior to the scheduled punch list completion. This would be shown as a finish-to-start with a 2-week lead as shown in Figure 6-10. Lead is often represented as a negative value for lag in scheduling software.
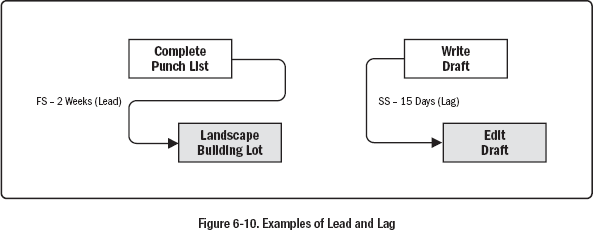
A lag is the amount of time a successor activity will be delayed with respect to a predecessor activity. For example, a technical writing team may begin editing the draft of a large document 15 days after they begin writing it. This can be shown as a start-to-start relationship with a 15-day lag as shown in Figure 6-10. Lag can also be represented in project schedule network diagrams as shown in Figure 6-11 in the relationship between activities H and I (as indicated by the nomenclature SS+10 (start-to-start plus 10 days lag) even though the offset is not shown relative to a timescale).
The project management team determines the dependencies that may require a lead or a lag to accurately define the logical relationship. The use of leads and lags should not replace schedule logic. Also, duration estimates do not include any leads or lags. Activities and their related assumptions should be documented.

6.3.2.4 PROJECT MANAGEMENT INFORMATION SYSTEM (PMIS)
Described in Section 4.3.2.2. Project management information systems includes scheduling software that has the capability to help plan, organize, and adjust the sequence of the activities; insert the logical relationships, lead and lag values; and differentiate the different types of dependencies.
6.3.3 SEQUENCE ACTIVITIES: OUTPUTS
6.3.3.1 PROJECT SCHEDULE NETWORK DIAGRAMS
A project schedule network diagram is a graphical representation of the logical relationships, also referred to as dependencies, among the project schedule activities. Figure 6-11 illustrates a project schedule network diagram. A project schedule network diagram is produced manually or by using project management software. It can include full project details, or have one or more summary activities. A summary narrative can accompany the diagram and describe the basic approach used to sequence the activities. Any unusual activity sequences within the network should be fully described within the narrative.
Activities that have multiple predecessor activities indicate a path convergence. Activities that have multiple successor activities indicate a path divergence. Activities with divergence and convergence are at greater risk as they are affected by multiple activities or can affect multiple activities. Activity I is called a path convergence, as it has more than one predecessor, while activity K is called a path divergence, as it has more than one successor.
6.3.3.2 PROJECT DOCUMENTS UPDATES
Project documents that may be updated as a result of carrying out this process include but are not limited to:
- Activity attributes. Described in Section 6.2.3.2. Activity attributes may describe a necessary sequence of events or defined predecessor or successor relationships, as well as defined lead and lag and logical relationships between the activities.
- Activity list. Described in Section 6.2.3.1. The activity list may be impacted by the change in relationships among the project activities during the sequencing activities.
- Assumption log. Described in Section 4.1.3.2. Assumptions and constraints recorded in the assumption log may need to be updated based on the sequencing, relationship determination, and leads and lags, and may give rise to individual project risks that may impact the project schedule.
- Milestone list. Described in Section 6.2.3.3. The scheduled dates for specific milestones may be impacted by changes in relationships among the project activities during the sequencing activities.
6.4 ESTIMATE ACTIVITY DURATIONS
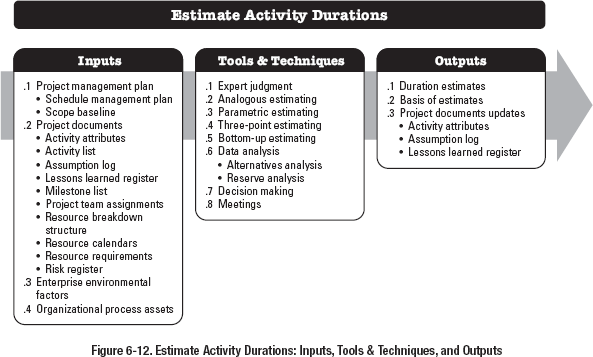
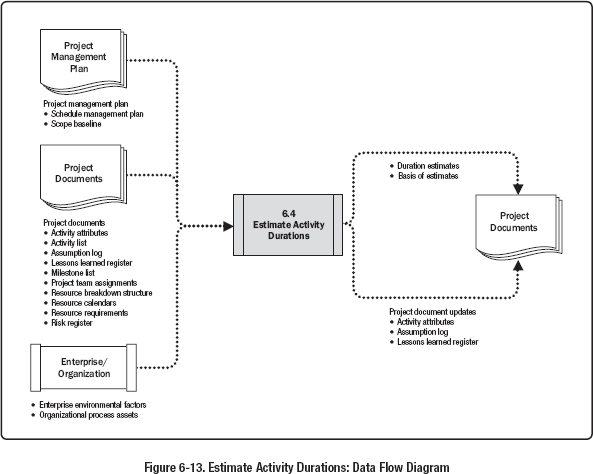
Estimate Activity Durations is the process of estimating the number of work periods needed to complete individual activities with estimated resources. The key benefit of this process is that it provides the amount of time each activity will take to complete. This process is performed throughout the project. The inputs, tools and techniques, and outputs of this process are depicted in Figure 6-12. Figure 6-13 depicts the data flow diagram of the process.
Estimating activity durations uses information from the scope of work, required resource types or skill levels, estimated resource quantities, and resource calendars. Other factors that may influence the duration estimates include constraints imposed on the duration, effort involved, or type of resources (e.g., fixed duration, fixed effort or work, fixed number of resources), as well as the schedule network analysis technique used. The inputs for the estimates of duration originate from the person or group on the project team who is most familiar with the nature of the work in the specific activity. The duration estimate is progressively elaborated, and the process considers the quality and availability of the input data. For example, as more detailed and precise data are available about the project engineering and design work, the accuracy and quality of the duration estimates improve.
The Estimate Activity Durations process requires an estimation of the amount of work effort required to complete the activity and the amount of available resources estimated to complete the activity. These estimates are used to approximate the number of work periods (activity duration) needed to complete the activity using the appropriate project and resource calendars. In many cases, the number of resources that are expected to be available to accomplish an activity, along with the skill proficiency of those resources, may determine the activity's duration. A change to a driving resource allocated to the activity will usually have an effect on the duration, but this is not a simple “straight-line” or linear relationship. Sometimes, the intrinsic nature of the work (i.e., constraints imposed on the duration, effort involved, or number of resources) will take a predetermined amount of time to complete regardless of the resource allocation (e.g., a 24-hour stress test). Other factors for consideration when estimating duration include:
- Law of diminishing returns. When one factor (e.g., resource) used to determine the effort required to produce a unit of work is increased while all other factors remain fixed, a point will eventually be reached at which additions of that one factor start to yield progressively smaller or diminishing increases in output.
- Number of resources. Increasing the number of resources to twice the original number of the resources does not always reduce the time by half, as it may increase extra duration due to risk, and at some point adding too many resources to the activity may increase duration due to knowledge transfer, learning curve, additional coordination, and other factors involved.
- Advances in technology. This may also play an important role in determining duration estimates. For example, an increase in the output of a manufacturing plant may be achieved by procuring the latest advances in technology, which may impact duration and resource needs.
- Motivation of staff. The project manager also needs to be aware of Student Syndrome—or procrastination—when people start to apply themselves only at the last possible moment before the deadline, and Parkinson's Law where work expands to fill the time available for its completion.
All data and assumptions that support duration estimating are documented for each activity duration estimate.
6.4.1 ESTIMATE ACTIVITY DURATIONS: INPUTS
6.4.1.1 PROJECT MANAGEMENT PLAN
Described in Section 4.2.3.1. Project management plan components include but are not limited to:
- Schedule management plan. Described in Section 6.1.3.1. The schedule management plan defines the method used, as well as the level of accuracy and other criteria required to estimate activity durations.
- Scope baseline. Described in Section 5.4.3.1. The scope baseline includes the WBS dictionary, which contains technical details that can influence the effort and duration estimates.
6.4.1.2 PROJECT DOCUMENTS
Project documents that can be considered as inputs for this process include but are not limited to:
- Activity attributes. Described in Section 6.2.3.2. Activity attributes may describe defined predecessor or successor relationships, as well as defined lead and lag and logical relationships between the activities that may impact duration estimates.
- Activity list. Described in Section 6.2.3.1. The activity list contains all schedule activities required on the project, which are to be estimated. Dependencies and other constraints for these activities can influence the duration estimates.
- Assumption log. Described in Section 4.1.3.2. Assumptions and constraints recorded in the assumption log may give rise to individual project risks that may impact the project schedule.
- Lessons learned register. Described in Section 4.4.3.1. Lessons learned earlier in the project with regard to effort and duration estimating can be applied to later phases in the project to improve the accuracy and precision of effort and duration estimates.
- Milestone list. Described in Section 6.2.3.3. The milestone list may have scheduled dates for specific milestones that may impact the duration estimates.
- Project team assignments. Described in Section 9.3.3.1. The project is staffed when the appropriate people have been assigned to the team.
- Resource breakdown structure. Described in Section 9.2.3.3. The resource breakdown structure provides a hierarchical structure of the identified resources by resource category and resource type.
- Resource calendars. Described in Section 9.2.1.2. The resource calendars influence the duration of schedule activities due to the availability of specific resources, type of resources, and resources with specific attributes. Resource calendars specify when and how long identified project resources will be available during the project.
- Resource requirements. Described in Section 9.2.3.1. The estimated activity resource requirements will have an effect on the duration of the activity, since the level to which the resources assigned to the activity meet the requirements will significantly influence the duration of most activities. For example, if additional or lower-skilled resources are assigned to an activity, there may be reduced efficiency or productivity due to increased communication, training, and coordination needs leading to a longer duration estimate.
- Risk register. Described in Section 11.2.3.1. Individual project risks may impact resource selection and availability. Updates to the risk register are included with project documents updates, described in Section 11.5.3.2, from Plan Risk Responses.
6.4.1.3 ENTERPRISE ENVIRONMENTAL FACTORS
The enterprise environmental factors that can influence the Estimate Activity Durations process include but are not limited to:
- Duration estimating databases and other reference data,
- Productivity metrics,
- Published commercial information, and
- Location of team members.
6.4.1.4 ORGANIZATIONAL PROCESS ASSETS
The organizational process assets that can influence the Estimate Activity Durations process include but are not limited to:
- Historical duration information,
- Project calendars,
- Estimating policies,
- Scheduling methodology, and
- Lessons learned repository.
6.4.2 ESTIMATE ACTIVITY DURATIONS: TOOLS AND TECHNIQUES
6.4.2.1 EXPERT JUDGMENT
Described in Section 4.1.2.1. Expertise should be considered from individuals or groups with specialized knowledge or training in the following topics:
- Schedule development, management, and control;
- Expertise in estimating; and
- Discipline or application knowledge.
6.4.2.2 ANALOGOUS ESTIMATING
Analogous estimating is a technique for estimating the duration or cost of an activity or a project using historical data from a similar activity or project. Analogous estimating uses parameters from a previous, similar project, such as duration, budget, size, weight, and complexity, as the basis for estimating the same parameter or measure for a future project. When estimating durations, this technique relies on the actual duration of previous, similar projects as the basis for estimating the duration of the current project. It is a gross value estimating approach, sometimes adjusted for known differences in project complexity. Analogous duration estimating is frequently used to estimate project duration when there is a limited amount of detailed information about the project.
Analogous estimating is generally less costly and less time-consuming than other techniques, but it is also less accurate. Analogous duration estimates can be applied to a total project or to segments of a project and may be used in conjunction with other estimating methods. Analogous estimating is most reliable when the previous activities are similar in fact and not just in appearance, and the project team members preparing the estimates have the needed expertise.
6.4.2.3 PARAMETRIC ESTIMATING
Parametric estimating is an estimating technique in which an algorithm is used to calculate cost or duration based on historical data and project parameters. Parametric estimating uses a statistical relationship between historical data and other variables (e.g., square footage in construction) to calculate an estimate for activity parameters, such as cost, budget, and duration.
Durations can be quantitatively determined by multiplying the quantity of work to be performed by the number of labor hours per unit of work. For example, duration on a design project is estimated by the number of drawings multiplied by the number of labor hours per drawing, or on a cable installation, the meters of cable multiplied by the number of labor hours per meter. If the assigned resource is capable of installing 25 meters of cable per hour, the duration required to install 1,000 meters is 40 hours (1,000 meters divided by 25 meters per hour).
This technique can produce higher levels of accuracy depending on the sophistication and underlying data built into the model. Parametric schedule estimates can be applied to a total project or to segments of a project, in conjunction with other estimating methods.
6.4.2.4 THREE-POINT ESTIMATING
The accuracy of single-point duration estimates may be improved by considering estimation uncertainty and risk. Using three-point estimates helps define an approximate range for an activity's duration:
- Most likely (tM). This estimate is based on the duration of the activity, given the resources likely to be assigned, their productivity, realistic expectations of availability for the activity, dependencies on other participants, and interruptions.
- Optimistic (tO). The activity duration based on analysis of the best-case scenario for the activity.
- Pessimistic (tP). The duration based on analysis of the worst-case scenario for the activity.
Depending on the assumed distribution of values within the range of the three estimates, the expected duration, tE, can be calculated. One commonly used formula is triangular distribution:
tE = (tO + tM + tP) / 3.
Triangular distribution is used when there is insufficient historical data or when using judgmental data. Duration estimates based on three points with an assumed distribution provide an expected duration and clarify the range of uncertainty around the expected duration.
6.4.2.5 BOTTOM-UP ESTIMATING
Bottom-up estimating is a method of estimating project duration or cost by aggregating the estimates of the lower-level components of the WBS. When an activity's duration cannot be estimated with a reasonable degree of confidence, the work within the activity is decomposed into more detail. The detail durations are estimated. These estimates are then aggregated into a total quantity for each of the activity's durations. Activities may or may not have dependencies between them that can affect the application and use of resources. If there are dependencies, this pattern of resource usage is reflected and documented in the estimated requirements of the activity.
6.4.2.6 DATA ANALYSIS
Data analysis techniques that can be used for this process include but are not limited to:
- Alternatives analysis. Alternatives analysis is used to compare various levels of resource capability or skills; scheduling compression techniques (described in Section 6.5.2.6); different tools (manual versus automated); and make, rent, or buy decisions regarding the resources. This allows the team to weigh resource, cost, and duration variables to determine an optimal approach for accomplishing project work.
- Reserve analysis. Reserve analysis is used to determine the amount of contingency and management reserve needed for the project. Duration estimates may include contingency reserves, sometimes referred to as schedule reserves, to account for schedule uncertainty. Contingency reserves are the estimated duration within the schedule baseline, which is allocated for identified risks that are accepted. Contingency reserves are associated with the known-unknowns, which may be estimated to account for this unknown amount of rework. The contingency reserve may be a percentage of the estimated activity duration or a fixed number of work periods. Contingency reserves may be separated from the individual activities and aggregated. As more precise information about the project becomes available, the contingency reserve may be used, reduced, or eliminated. Contingency should be clearly identified in the schedule documentation.
Estimates may also be produced for the amount of management reserve of schedule for the project. Management reserves are a specified amount of the project budget withheld for management control purposes and are reserved for unforeseen work that is within scope of the project. Management reserves are intended to address the unknown-unknowns that can affect a project. Management reserve is not included in the schedule baseline, but it is part of the overall project duration requirements. Depending on contract terms, use of management reserves may require a change to the schedule baseline.
6.4.2.7 DECISION MAKING
Described in Section 5.2.2.4. Decision-making techniques that can be used in this process include but are not limited to voting. One variation of the voting method that is often used in agile-based projects is called the fist of five (also called fist to five). In this technique, the project manager asks the team to show their level of support for a decision by holding up a closed fist (indicating no support) up to five fingers (indicating full support). If a team member holds up fewer than three fingers, the team member is given the opportunity to discuss any objections with the team. The project manager continues the fist-of-five process until the team achieves consensus (everyone holds up three or more fingers) or agrees to move on to the next decision.
6.4.2.8 MEETINGS
The project team may hold meetings to estimate activity durations. When using an agile approach, it is necessary to conduct sprint or iteration planning meetings to discuss prioritized product backlog items (user stories) and decide which of these items the team will commit to work on in the upcoming iteration. The team breaks down user stories to low-level tasks, with estimates in hours, and then validates that the estimates are achievable based on team capacity over the duration (iteration). This meeting is usually held on the first day of the iteration and is attended by the product owner, the Scrum team, and the project manager. The outcome of the meeting includes an iteration backlog, as well as assumptions, concerns, risks, dependencies, decisions, and actions.
6.4.3 ESTIMATE ACTIVITY DURATIONS: OUTPUTS
6.4.3.1 DURATION ESTIMATES
Duration estimates are quantitative assessments of the likely number of time periods that are required to complete an activity, a phase, or a project. Duration estimates do not include any lags as described in Section 6.3.2.3. Duration estimates may include some indication of the range of possible results. For example:
- A range of 2 weeks ± 2 days, which indicates that the activity will take at least 8 days and not more than 12 (assuming a 5-day work week); or
- A 15% probability of exceeding 3 weeks, which indicates a high probability—85%—that the activity will take 3 weeks or less.
6.4.3.2 BASIS OF ESTIMATES
The amount and type of additional details supporting the duration estimate vary by application area. Regardless of the level of detail, the supporting documentation should provide a clear and complete understanding of how the duration estimate was derived.
Supporting detail for duration estimates may include:
- Documentation of the basis of the estimate (i.e., how it was developed),
- Documentation of all assumptions made,
- Documentation of any known constraints,
- Indication of the range of possible estimates (e.g., ±10%) to indicate that the duration is estimated between a range of values),
- Indication of the confidence level of the final estimate, and
- Documentation of individual project risks influencing this estimate.
6.4.3.3 PROJECT DOCUMENTS UPDATES
Project documents that may be updated as a result of carrying out this process include but are not limited to:
- Activity attributes. Described in Section 6.2.3.2. Activity duration estimates produced during this process are documented as part of the activity attributes.
- Assumption log. Described in Section 4.1.3.2. This includes assumptions made in developing the duration estimate, such as resource skill levels and availability, as well as a basis of estimates for durations. Additionally, constraints arising out of the scheduling methodology and scheduling tool are also documented.
- Lessons learned register. Described in Section 4.4.3.1. The lessons learned register can be updated with techniques that were efficient and effective in developing effort and duration estimates.
6.5 DEVELOP SCHEDULE
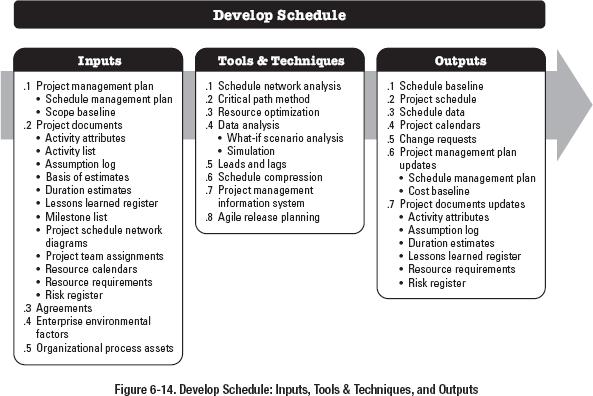
Develop Schedule is the process of analyzing activity sequences, durations, resource requirements, and schedule constraints to create a schedule model for project execution and monitoring and controlling. The key benefit of this process is that it generates a schedule model with planned dates for completing project activities. This process is performed throughout the project. The inputs, tools and techniques, and outputs of this process are depicted in Figure 6-14. Figure 6-15 depicts the data flow diagram of the process.

Developing an acceptable project schedule is an iterative process. The schedule model is used to determine the planned start and finish dates for project activities and milestones based on the best available information. Schedule development can require the review and revision of duration estimates, resource estimates, and schedule reserves to establish an approved project schedule that can serve as a baseline to track progress. Key steps include defining the project milestones, identifying and sequencing activities, and estimating durations. Once the activity start and finish dates have been determined, it is common to have the project staff assigned to the activities review their assigned activities. The staff confirms that the start and finish dates present no conflict with resource calendars or assigned activities on other projects or tasks and thus are still valid. The schedule is then analyzed to determine conflicts with logical relationships and if resource leveling is required before the schedule is approved and baselined. Revising and maintaining the project schedule model to sustain a realistic schedule continues throughout the duration of the project, as described in Section 6.7.
For more specific information regarding scheduling, refer to the Practice Standard for Scheduling.
6.5.1 DEVELOP SCHEDULE: INPUTS
6.5.1.1 PROJECT MANAGEMENT PLAN
Described in Section 4.2.3.1. Project management plan components include but are not limited to:
- Schedule management plan. Described in Section 6.1.3.1. The schedule management plan identifies the scheduling method and tool used to create the schedule and how the schedule is to be calculated.
- Scope baseline. Described in Section 5.4.3.1. The scope statement, WBS, and WBS dictionary have details about the project deliverables that are considered when building the schedule model.
6.5.1.2 PROJECT DOCUMENTS
Project documents that can be considered as inputs for this process include but are not limited to:
- Activity attributes. Described in Section 6.2.3.2. The activity attributes provide the details used to build the schedule model.
- Activity list. Described in Section 6.2.3.1. The activity list identifies the activities that will be included in the schedule model.
- Assumption log. Described in Section 4.1.3.2. Assumptions and constraints recorded in the assumption log may give rise to individual project risks that may impact the project schedule.
- Basis of estimates. Described in Section 6.4.3.2. The amount and type of additional details supporting the duration estimate vary by application area. Regardless of the level of detail, the supporting documentation should provide a clear and complete understanding of how the duration estimate was derived.
- Duration estimates. Described in Section 6.4.3.1. The duration estimates contain the quantitative assessments of the likely number of work periods that will be required to complete an activity. This will be used to calculate the schedule.
- Lessons learned. Described in Section 4.4.3.1. Lessons learned earlier in the project with regard to developing the schedule model can be applied to later phases in the project to improve the validity of the schedule model.
- Milestone list. Described in Section 6.2.3.3. The milestone list has scheduled dates for specific milestones.
- Project schedule network diagrams. Described in Section 6.3.3.1. The project schedule network diagrams contain the logical relationships of predecessors and successors that will be used to calculate the schedule.
- Project team assignments. Described in Section 9.3.3.1. The project team assignments specify which resources are assigned to each activity.
- Resource calendars. Described in Sections 9.2.1.2. The resource calendars contain information on the availability of resources during the project.
- Resource requirements. Described in Section 9.2.3.1. The activity resource requirements identify the types and quantities of resources required for each activity used to create the schedule model.
- Risk register. Described in Section 11.2.3.1. The risk register provides the details of all identified risks, and their characteristics, that affect the schedule model. Risk information relevant to the schedule is reflected in schedule reserves using the expected or mean risk impact.
6.5.1.3 AGREEMENTS
Described in Section 12.2.3.2. Vendors may have an input to the project schedule as they develop the details of how they will perform the project work to meet contractual commitments.
6.5.1.4 ENTERPRISE ENVIRONMENTAL FACTORS
The enterprise environmental factors that can influence the Develop Schedule process include but are not limited to:
- Government or industry standards, and
- Communication channels.
6.5.1.5 ORGANIZATIONAL PROCESS ASSETS
The organizational process assets that can influence the Develop Schedule process include but are not limited to:
- Scheduling methodology containing the policies governing schedule model development and maintenance, and
- Project calendar(s).
6.5.2 DEVELOP SCHEDULE: TOOLS AND TECHNIQUES
6.5.2.1 SCHEDULE NETWORK ANALYSIS
Schedule network analysis is the overarching technique used to generate the project schedule model. It employs several other techniques such as critical path method (described in Section 6.5.2.2), resource optimization techniques (described in Section 6.5.2.3), and modeling techniques (described in Section 6.5.2.4). Additional analysis includes but is not limited to:
- Assessing the need to aggregate schedule reserves to reduce the probability of a schedule slip when multiple paths converge at a single point in time or when multiple paths diverge from a single point in time, to reduce the probability of a schedule slip.
- Reviewing the network to see if the critical path has high-risk activities or long lead items that would necessitate use of schedule reserves or the implementation of risk responses to reduce the risk on the critical path.
Schedule network analysis is an iterative process that is employed until a viable schedule model is developed.
6.5.2.2 CRITICAL PATH METHOD
The critical path method is used to estimate the minimum project duration and determine the amount of schedule flexibility on the logical network paths within the schedule model. This schedule network analysis technique calculates the early start, early finish, late start, and late finish dates for all activities without regard for any resource limitations by performing a forward and backward pass analysis through the schedule network, as shown in Figure 6-16. In this example, the longest path includes activities A, C, and D, and therefore the sequence of A-C-D is the critical path. The critical path is the sequence of activities that represents the longest path through a project, which determines the shortest possible project duration. The longest path has the least total float—usually zero. The resulting early and late start and finish dates are not necessarily the project schedule; rather they indicate the time periods within which the activity could be executed, using the parameters entered in the schedule model for activity durations, logical relationships, leads, lags, and other known constraints. The critical path method is used to calculate the critical path(s) and the amount of total and free float or schedule flexibility on the logical network paths within the schedule model.
On any network path, the total float or schedule flexibility is measured by the amount of time that a schedule activity can be delayed or extended from its early start date without delaying the project finish date or violating a schedule constraint. A critical path is normally characterized by zero total float on the critical path. As implemented with the precedence diagramming method sequencing, critical paths may have positive, zero, or negative total float depending on the constraints applied. Positive total float is caused when the backward pass is calculated from a schedule constraint that is later than the early finish date that has been calculated during forward pass calculation. Negative total float is caused when a constraint on the late dates is violated by duration and logic. Negative float analysis is a technique that helps to find possible accelerated ways of bringing a delayed schedule back on track. Schedule networks may have multiple near-critical paths. Many software packages allow the user to define the parameters used to determine the critical path(s). Adjustments to activity durations (when more resources or less scope can be arranged), logical relationships (when the relationships were discretionary to begin with), leads and lags, or other schedule constraints may be necessary to produce network paths with a zero or positive total float. Once the total float and the free float have been calculated, the free float is the amount of time that a schedule activity can be delayed without delaying the early start date of any successor or violating a schedule constraint. For example the free float for Activity B, in Figure 6-16, is 5 days.

6.5.2.3 RESOURCE OPTIMIZATION
Resource optimization is used to adjust the start and finish dates of activities to adjust planned resource use to be equal to or less than resource availability. Examples of resource optimization techniques that can be used to adjust the schedule model due to demand and supply of resources include but are not limited to:
- Resource leveling. A technique in which start and finish dates are adjusted based on resource constraints with the goal of balancing the demand for resources with the available supply. Resource leveling can be used when shared or critically required resources are available only at certain times or in limited quantities, or are over-allocated, such as when a resource has been assigned to two or more activities during the same time period (as shown in Figure 6-17), or there is a need to keep resource usage at a constant level. Resource leveling can often cause the original critical path to change. Available float is used for leveling resources. Consequently, the critical path through the project schedule may change.
- Resource smoothing. A technique that adjusts the activities of a schedule model such that the requirements for resources on the project do not exceed certain predefined resource limits. In resource smoothing, as opposed to resource leveling, the project's critical path is not changed and the completion date may not be delayed. In other words, activities may only be delayed within their free and total float. Resource smoothing may not be able to optimize all resources.

6.5.2.4 DATA ANALYSIS
Data analysis techniques that can be used for this process include but are not limited to:
- What-if scenario analysis. What-if scenario analysis is the process of evaluating scenarios in order to predict their effect, positive or negative, on project objectives. This is an analysis of the question, “What if the situation represented by scenario X happens?” A schedule network analysis is performed using the schedule to compute the different scenarios, such as delaying a major component delivery, extending specific engineering durations, or introducing external factors, such as a strike or a change in the permit process. The outcome of the what-if scenario analysis can be used to assess the feasibility of the project schedule under different conditions, and in preparing schedule reserves and response plans to address the impact of unexpected situations.
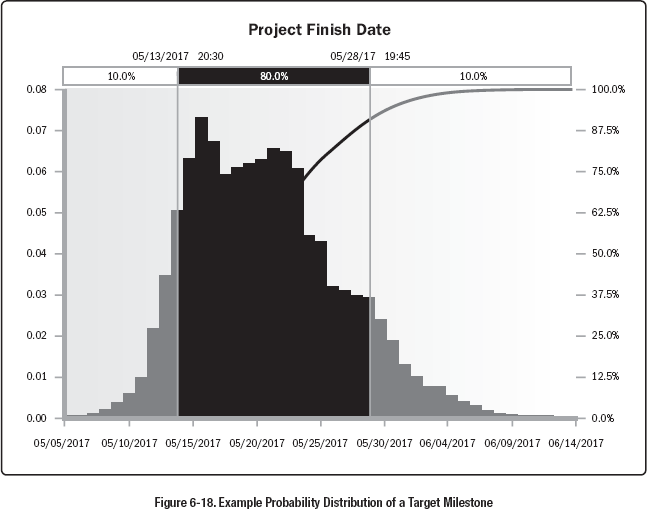
- Simulation. Simulation models the combined effects of individual project risks and other sources of uncertainty to evaluate their potential impact on achieving project objectives. The most common simulation technique is Monte Carlo analysis (see Section 11.4.2.5), in which risks and other sources of uncertainty are used to calculate possible schedule outcomes for the total project. Simulation involves calculating multiple work package durations with different sets of activity assumptions, constraints, risks, issues, or scenarios using probability distributions and other representations of uncertainty (see Section 11.4.2.4). Figure 6-18 shows a probability distribution for a project with the probability of achieving a certain target date (i.e., project finish date). In this example, there is a 10% probability that the project will finish on or before the target date of May 13, while there is a 90% probability of completing the project by May 28.
For more information on how Monte Carlo simulation is used for schedule models, see the Practice Standard for Scheduling.
6.5.2.5 LEADS AND LAGS
Described in Section 6.3.2.3. Leads and lags are refinements applied during network analysis to develop a viable schedule by adjusting the start time of the successor activities. Leads are used in limited circumstances to advance a successor activity with respect to the predecessor activity, and lags are used in limited circumstances where processes require a set period of time to elapse between the predecessors and successors without work or resource impact.
6.5.2.6 SCHEDULE COMPRESSION
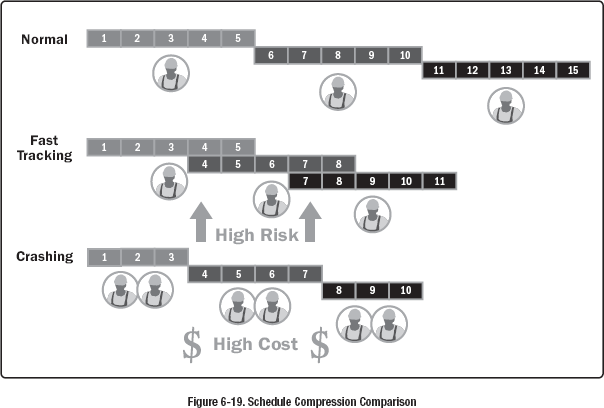
Schedule compression techniques are used to shorten or accelerate the schedule duration without reducing the project scope in order to meet schedule constraints, imposed dates, or other schedule objectives. A helpful technique is the negative float analysis. The critical path is the one with the least float. Due to violating a constraint or imposed date, the total float can become negative. Schedule compression techniques are compared in Figure 6-19 and include:
- Crashing. A technique used to shorten the schedule duration for the least incremental cost by adding resources. Examples of crashing include approving overtime, bringing in additional resources, or paying to expedite delivery to activities on the critical path. Crashing works only for activities on the critical path where additional resources will shorten the activity's duration. Crashing does not always produce a viable alternative and may result in increased risk and/or cost.
- Fast tracking. A schedule compression technique in which activities or phases normally done in sequence are performed in parallel for at least a portion of their duration. An example is constructing the foundation for a building before completing all of the architectural drawings. Fast tracking may result in rework and increased risk. Fast tracking only works when activities can be overlapped to shorten the project duration on the critical path. Using leads in case of schedule acceleration usually increases coordination efforts between the activities concerned and increases quality risk. Fast tracking may also increase project costs.
6.5.2.7 PROJECT MANAGEMENT INFORMATION SYSTEM (PMIS)
Described in Section 4.3.2.2. Project management information systems include scheduling software that expedites the process of building a schedule model by generating start and finish dates based on the inputs of activities, network diagrams, resources, and activity durations.
6.5.2.8 AGILE RELEASE PLANNING
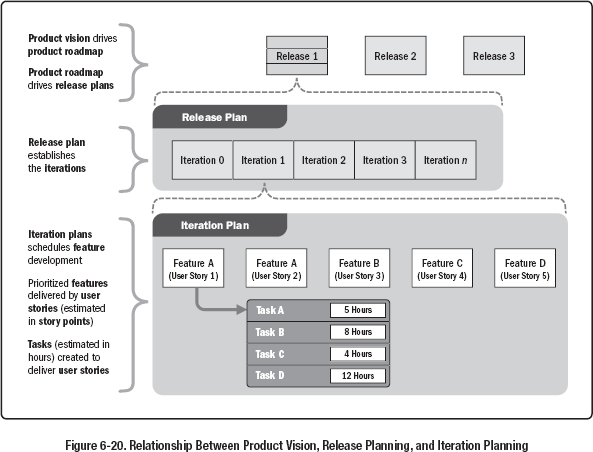
Agile release planning provides a high-level summary timeline of the release schedule (typically 3 to 6 months) based on the product roadmap and the product vision for the product's evolution. Agile release planning also determines the number of iterations or sprints in the release, and allows the product owner and team to decide how much needs to be developed and how long it will take to have a releasable product based on business goals, dependencies, and impediments.
Since features represent value to the customer, the timeline provides a more easily understood project schedule as it defines which feature will be available at the end of each iteration, which is exactly the depth of information the customer is looking for.
Figure 6-20 shows the relationship among product vision, product roadmap, release planning, and iteration planning.
6.5.3 DEVELOP SCHEDULE: OUTPUTS
6.5.3.1 SCHEDULE BASELINE
A schedule baseline is the approved version of a schedule model that can be changed only through formal change control procedures and is used as a basis for comparison to actual results. It is accepted and approved by the appropriate stakeholders as the schedule baseline with baseline start dates and baseline finish dates. During monitoring and controlling, the approved baseline dates are compared to the actual start and finish dates to determine if variances have occurred. The schedule baseline is a component of the project management plan.
6.5.3.2 PROJECT SCHEDULE
The project schedule is an output of a schedule model that presents linked activities with planned dates, durations, milestones, and resources. At a minimum, the project schedule includes a planned start date and planned finish date for each activity. If resource planning is done at an early stage, the project schedule remains preliminary until resource assignments have been confirmed and scheduled start and finish dates are established. This process usually occurs no later than the completion of the project management plan (Section 4.2.3.1). A target project schedule model may also be developed with a defined target start and target finish for each activity. The project schedule may be presented in summary form, sometimes referred to as the master schedule or milestone schedule, or presented in detail. Although a project schedule model can be presented in tabular form, it is more often presented graphically, using one or more of the following formats:
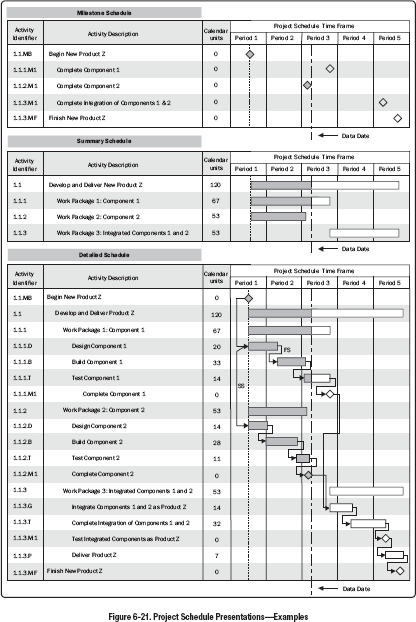
- Bar charts. Also known as Gantt charts, bar charts represent schedule information where activities are listed on the vertical axis, dates are shown on the horizontal axis, and activity durations are shown as horizontal bars placed according to start and finish dates. Bar charts are relatively easy to read and are commonly used. Depending on the audience, float can be depicted or not. For control and management communications, the broader, more comprehensive summary activity is used between milestones or across multiple interdependent work packages and is displayed in bar chart reports. An example is the summary schedule portion of Figure 6-21 that is presented in a WBS-structured format.
- Milestone charts. These charts are similar to bar charts, but only identify the scheduled start or completion of major deliverables and key external interfaces. An example is the milestone schedule portion of Figure 6-21.
- Project schedule network diagrams. These diagrams are commonly presented in the activity-on-node diagram format showing activities and relationships without a time scale, sometimes referred to as a pure logic diagram, as shown in Figure 6-11, or presented in a time-scaled schedule network diagram format that is sometimes called a logic bar chart, as shown for the detailed schedule in Figure 6-21. These diagrams, with activity date information, usually show both the project network logic and the project's critical path schedule activities. This example also shows how each work package is planned as a series of related activities. Another presentation of the project schedule network diagram is a time-scaled logic diagram. These diagrams include a time scale and bars that represent the duration of activities with the logical relationships. They are optimized to show the relationships between activities where any number of activities may appear on the same line of the diagram in sequence.
Figure 6-21 shows schedule presentations for a sample project being executed, with the work in progress reported through as-of date or status date. For a simple project schedule model, Figure 6-21 reflects schedule presentations in the forms of (1) a milestone schedule as a milestone chart, (2) a summary schedule as a bar chart, and (3) a detailed schedule as a project schedule linked bar chart diagram. Figure 6-21 also visually shows the relationships among the different levels of detail of the project schedule.
6.5.3.3 SCHEDULE DATA
The schedule data for the project schedule model is the collection of information for describing and controlling the schedule. The schedule data includes, at a minimum, the schedule milestones, schedule activities, activity attributes, and documentation of all identified assumptions and constraints. The amount of additional data varies by application area. Information frequently supplied as supporting detail includes but is not limited to:
- Resource requirements by time period, often in the form of a resource histogram;
- Alternative schedules, such as best-case or worst-case, not resource-leveled or resource-leveled, or with or without imposed dates; and
- Applied schedule reserves.
Schedule data could also include such items as resource histograms, cash-flow projections, order and delivery schedules, or other relevant information.
6.5.3.4 PROJECT CALENDARS
A project calendar identifies working days and shifts that are available for scheduled activities. It distinguishes time periods in days or parts of days that are available to complete scheduled activities from time periods that are not available for work. A schedule model may require more than one project calendar to allow for different work periods for some activities to calculate the project schedule. The project calendars may be updated.
6.5.3.5 CHANGE REQUESTS
Described in Section 4.3.3.4. Modifications to the project scope or project schedule may result in change requests to the scope baseline, and/or other components of the project management plan. Change requests are processed for review and disposition through the Perform Integrated Change Control process (Section 4.6). Preventive actions may include recommended changes to eliminate or reduce the probability of negative schedule variances.
6.5.3.6 PROJECT MANAGEMENT PLAN UPDATES
Any change to the project management plan goes through the organization's change control process via a change request. Components that may require a change request for the project management plan include but are not limited to:
- Schedule management plan. Described in Section 6.1.3.1. The schedule management plan may be updated to reflect a change in the way the schedule was developed and will be managed.
- Cost baseline. Described in Section 7.3.3.1. Changes to the cost baseline are incorporated in response to approved changes in scope, resources, or cost estimates. In some cases, cost variances can be so severe that a revised cost baseline is needed to provide a realistic basis for performance measurement.
6.5.3.7 PROJECT DOCUMENTS UPDATES
Project documents that may be updated as a result of carrying out this process include but are not limited to:
- Activity attributes. Described in Section 6.2.3.2. Activity attributes are updated to include any revised resource requirements and any other revisions generated by the Develop Schedule process.
- Assumption log. Described in Section 4.1.3.2. The assumption log may be updated with changes to assumptions in duration, resource utilization, sequencing, or other information that is revealed as a result of developing the schedule model.
- Duration estimates. Described in Section 6.4.3.1. The number and availability of resources, along with the activity dependencies can result in a change to the duration estimates. If the resource-leveling analysis changes the resource requirements, then the duration estimates will likely need to be updated as well.
- Lessons learned register. Described in Section 4.4.3.1. The lessons learned register can be updated with techniques that were efficient and effective in developing the schedule model.
- Resource requirements. Described in Section 9.2.3.1. Resource leveling can have a significant effect on preliminary estimates for the types and quantities of resources required. If the resource-leveling analysis changes the resource requirements, then the resource requirements are updated.
- Risk register. Described in Section 11.2.3.1. The risk register may need to be updated to reflect opportunities or threats perceived through scheduling assumptions.
6.6 CONTROL SCHEDULE
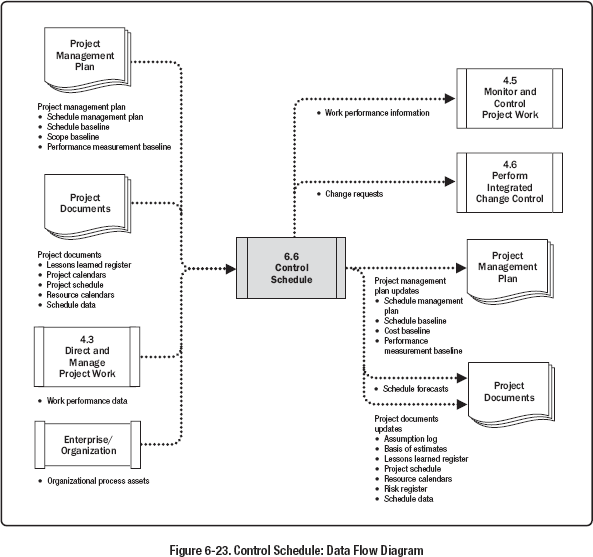
Control Schedule is the process of monitoring the status of the project to update the project schedule and managing changes to the schedule baseline. The key benefit of this process is that the schedule baseline is maintained throughout the project. This process is performed throughout the project. The inputs, tools and techniques, and outputs of this process are depicted in Figure 6-22. Figure 6-23 depicts the data flow diagram of the process.

Updating the schedule model requires knowing the actual performance to date. Any change to the schedule baseline can only be approved through the Perform Integrated Change Control process (Section 4.6). Control Schedule, as a component of the Perform Integrated Change Control process, is concerned with:
- Determining the current status of the project schedule,
- Influencing the factors that create schedule changes,
- Reconsidering necessary schedule reserves,
- Determining if the project schedule has changed, and
- Managing the actual changes as they occur.
When an agile approach is used, Control Schedule is concerned with:
- Determining the current status of the project schedule by comparing the total amount of work delivered and accepted against the estimates of work completed for the elapsed time cycle;
- Conducting retrospectives (scheduled reviews to record lessons learned) for correcting processes and improving, if required;
- Reprioritizing the remaining work plan (backlog);
- Determining the rate at which the deliverables are produced, validated, and accepted (velocity) in the given time per iteration (agreed-upon work cycle duration, typically 2 weeks or 1 month);
- Determining that the project schedule has changed; and
- Managing the actual changes as they occur.
When work is being contracted, regular and milestone status updates from contractors and suppliers are a means of ensuring the work is progressing as agreed upon to ensure the schedule is under control. Scheduled status reviews and walkthroughs should be done to ensure the contractor reports are accurate and complete.
6.6.1 CONTROL SCHEDULE: INPUTS
6.6.1.1 PROJECT MANAGEMENT PLAN
Described in Section 4.2.3.1. Project management plan components include but are not limited to:
- Schedule management plan. Described in Section 6.1.3.1. The schedule management describes the frequency that the schedule will be updated, how reserve will be used, and how the schedule will be controlled.
- Schedule baseline. Described in Section 6.5.3.1. The schedule baseline is compared with actual results to determine if a change, corrective action, or preventive action is necessary.
- Scope baseline. Described in Section 5.4.3.1. The project WBS, deliverables, constraints, and assumptions documented in the scope baseline are considered explicitly when monitoring and controlling the schedule baseline.
- Performance measurement baseline. Described in Section 4.2.3.1. When using earned value analysis the performance measurement baseline is compared to actual results to determine if a change, corrective action, or preventive action is necessary.
6.6.1.2 PROJECT DOCUMENTS
Project documents that can be considered as inputs for this process include but are not limited to:
- Lessons learned register. Described in Section 4.4.3.1. Lessons learned earlier in the project can be applied to later phases in the project to improve schedule control.
- Project calendars. Described in Section 6.5.3.4. A schedule model may require more than one project calendar to allow for different work periods for some activities to calculate the schedule forecasts.
- Project schedule. Described in Section 6.5.3.2. Project schedule refers to the most recent version with notations to indicate updates, completed activities, and started activities as of the indicated date.
- Resource calendars. Described in Section 9.2.1.2. Resource calendars show the availability of team and physical resources.
- Schedule data. Described in Section 6.5.3.3. Schedule data will be reviewed and updated in the Control Schedule process.
6.6.1.3 WORK PERFORMANCE DATA
Described in Section 4.3.3.2. Work performance data contains data on project status such as which activities have started, their progress (e.g., actual duration, remaining duration, and physical percent complete), and which activities have finished.
6.6.1.4 ORGANIZATIONAL PROCESS ASSETS
The organizational process assets that can influence the Control Schedule process include but are not limited to:
- Existing formal and informal schedule control-related policies, procedures, and guidelines;
- Schedule control tools; and
- Monitoring and reporting methods to be used.
6.6.2 CONTROL SCHEDULE: TOOLS AND TECHNIQUES
6.6.2.1 DATA ANALYSIS
Data analysis techniques that can be used for this process include but are not limited to:
- Earned value analysis. Described in Section 7.4.2.2. Schedule performance measurements such as schedule variance (SV) and schedule performance index (SPI) are used to assess the magnitude of variation to the original schedule baseline.
- Iteration burndown chart. This chart tracks the work that remains to be completed in the iteration backlog. It is used to analyze the variance with respect to an ideal burndown based on the work committed from iteration planning (see Section 6.4.2.8). A forecast trend line can be used to predict the likely variance at iteration completion and take appropriate actions during the course of the iteration. A diagonal line representing the ideal burndown and daily actual remaining work is then plotted. A trend line is then calculated to forecast completion based on remaining work. Figure 6-24 is an example of an iteration burndown chart.

- Performance reviews. Performance reviews measure, compare, and analyze schedule performance against the schedule baseline such as actual start and finish dates, percent complete, and remaining duration for work in progress.
- Trend analysis. Described in Section 4.5.2.2. Trend analysis examines project performance over time to determine whether performance is improving or deteriorating. Graphical analysis techniques are valuable for understanding performance to date and for comparing to future performance goals in the form of completion dates.
- Variance analysis. Variance analysis looks at variances in planned versus actual start and finish dates, planned versus actual durations, and variances in float. Part of variance analysis is determining the cause and degree of variance relative to the schedule baseline (see Section 6.5.3.1), estimating the implications of those variances for future work to completion, and deciding whether corrective or preventive action is required. For example, a major delay on any activity not on the critical path may have little effect on the overall project schedule, while a much shorter delay on a critical or near-critical activity may require immediate action.
- What-if scenario analysis. Described in Section 6.5.2.4. What-if scenario analysis is used to assess the various scenarios guided by the output from the Project Risk Management processes to bring the schedule model into alignment with the project management plan and approved baseline.
6.6.2.2 CRITICAL PATH METHOD
Described in Section 6.5.2.2. Comparing the progress along the critical path can help determine schedule status. The variance on the critical path will have a direct impact on the project end date. Evaluating the progress of activities on near critical paths can identify schedule risk.
6.6.2.3 PROJECT MANAGEMENT INFORMATION SYSTEM (PMIS)
Described in Section 4.3.2.2. Project management information systems include scheduling software that provides the ability to track planned dates versus actual dates, to report variances to and progress made against the schedule baseline, and to forecast the effects of changes to the project schedule model.
6.6.2.4 RESOURCE OPTIMIZATION
Described in Section 6.5.2.3. Resource optimization techniques involve the scheduling of activities and the resources required by those activities while taking into consideration both the resource availability and the project time.
6.6.2.5 LEADS AND LAGS
Adjusting leads and lags is applied during network analysis to find ways to bring project activities that are behind into alignment with the plan. For example, on a project to construct a new office building, the landscaping can be adjusted to start before the exterior work of the building is completed by increasing the lead time in the relationship, or a technical writing team can adjust the start of editing the draft of a large document immediately after the document is written by eliminating or decreasing lag time.
6.6.2.6 SCHEDULE COMPRESSION
Schedule compression techniques (see Section 6.5.2.6) are used to find ways to bring project activities that are behind into alignment with the plan by fast tracking or crashing the schedule for the remaining work.
6.6.3 CONTROL SCHEDULE: OUTPUTS
6.6.3.1 WORK PERFORMANCE INFORMATION
Described in Section 4.5.1.3. Work performance information includes information on how the project work is performing compared to the schedule baseline. Variances in the start and finish dates and the durations can be calculated at the work package level and control account level. For projects using earned value analysis, the (SV) and (SPI) are documented for inclusion in work performance reports (see Section 4.5.3.1).
6.6.3.2 SCHEDULE FORECASTS
Schedule updates are forecasts of estimates or predictions of conditions and events in the project's future based on information and knowledge available at the time of the forecast. Forecasts are updated and reissued based on work performance information provided as the project is executed. The information is based on the project's past performance and expected future performance based on corrective or preventive actions. This can include earned value performance indicators, as well as schedule reserve information that could impact the project in the future.
6.6.3.3 CHANGE REQUESTS
Described in Section 4.3.3.4. Schedule variance analysis, as well as reviews of progress reports, results of performance measures, and modifications to the project scope or project schedule, may result in change requests to the schedule baseline, scope baseline, and/or other components of the project management plan. Change requests are processed for review and disposition through the Perform Integrated Change Control process (Section 4.6). Preventive actions may include recommended changes to eliminate or reduce the probability of negative schedule variances.
6.6.3.4 PROJECT MANAGEMENT PLAN UPDATES
Any change to the project management plan goes through the organization's change control process via a change request. Components that may require a change request for the project management plan include but are not limited to:
- Schedule management plan. Described in Section 6.1.3.1. The schedule management plan may be updated to reflect a change in the way the schedule is managed.
- Schedule baseline. Described in Section 6.5.3.1. Changes to the schedule baseline are incorporated in response to approved change requests related to change in project scope, resources, or activity duration estimates. The schedule baseline may be updated to reflect changes caused by schedule compression techniques or performance issues.
- Cost baseline. Described in Section 7.3.3.1. Changes to the cost baseline are incorporated in response to approved changes in scope, resources, or cost estimates.
- Performance measurement baseline. Described in Section 4.2.3.1. Changes to the performance measurement baseline are incorporated in response to approved changes in scope, schedule performance, or cost estimates. In some cases, the performance variances can be so severe that a change request is put forth to revise the performance measurement baseline to provide a realistic basis for performance measurement.
6.6.3.5 PROJECT DOCUMENTS UPDATES
Project documents that may be updated as a result of carrying out this process include but are not limited to:
- Assumption log. Described in Section 4.1.3.2. Schedule performance may indicate the need to revise assumptions on activity sequencing, durations, and productivity.
- Basis of estimates. Described in Section 6.4.3.2. Schedule performance may indicate the need to revise the way duration estimates were developed.
- Lessons learned register. Described in Section 4.4.3.1. The lessons learned register can be updated with techniques that were effective in maintaining the schedule, causes of variances, and corrective actions that were used to respond to schedule variances.
- Project schedule. An updated project schedule (see Section 6.5.3.2) will be generated from the schedule model populated with updated schedule data to reflect the schedule changes and manage the project.
- Resource calendars. Described in Section 9.2.1.2. Resource calendars are updated to reflect changes to the utilization of resource calendars that were the result of optimizing resources, schedule compression, and corrective or preventive actions.
- Risk register. Described in Section 11.2.3.1. The risk register and risk response plans within it, may be updated based on the risks that may arise due to schedule compression techniques.
- Schedule data. Described in Section 6.5.3.3. New project schedule network diagrams may be developed to display approved remaining durations and approved modifications to the schedule. In some cases, project schedule delays can be so severe that a new target schedule with forecasted start and finish dates is needed to provide realistic data for directing the work, measuring performance, and measuring progress.