Chapter 5
Price Analysis and Forecasts
Adapted from material published in Unsafe Haven, September 20111
One of the most defining characteristics of a bubble is the parabolic shape of the rise in prices as the bubble develops and reaches a peak. Prices can rise at an extremely steep angle and show increases of hundreds of percent before the bubble bursts and prices fall. The problem, however, is that what is considered to be “parabolic” or “extreme” price movement is left to the discretion of investors—what one person considers outrageous price rises may not satisfy the criteria of another person. Plus, a person involved in the bubble may think that there is plenty more parabolic rise left in the underlying asset to justify the investment. In other words, most people don't know when the price will stop rising, and their gambling-like behavior will lead them to justify parabolic price rises in order to not “miss out” on the even sharper price rise that is, in their minds, upcoming.
Parabolic rises tend to be followed by disastrous falls. If gold prices have been in a parabolic rise, they are setting up for a major fall. But the question that may be hardest to answer is “Exactly where are we in this bubble?” If we have already seen the most intense price rises and the most euphoric phases of the bubble, now would definitely be a dangerous time to invest; but if the “speculative mania” phase, which pushes prices to stratospheric extremes, is still not here, prices could soar even more. A final blow-off phase may still be upon us.
Gold Bubble Anatomy: Is a Parabolic Spike Coming?
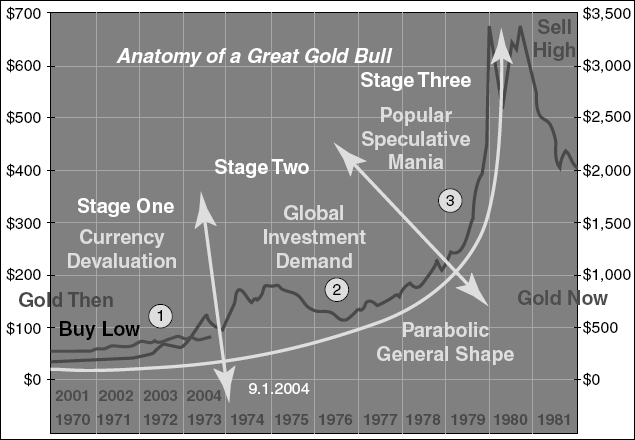
Looking at the anatomy of a bubble and a diagram of its progression, we can track how the gold bubble has developed, grown, and approaches its ultimate peak. Compare the progression of a theoretical bubble to our current gold bubble, shown in Figure 5.1.
Figure 5.1 (A) Stages of a Bubble 2 and (B) a Gold Bubble
Sources: (A) Jean-Paul Rodrigue; (B) www.kitco.com.
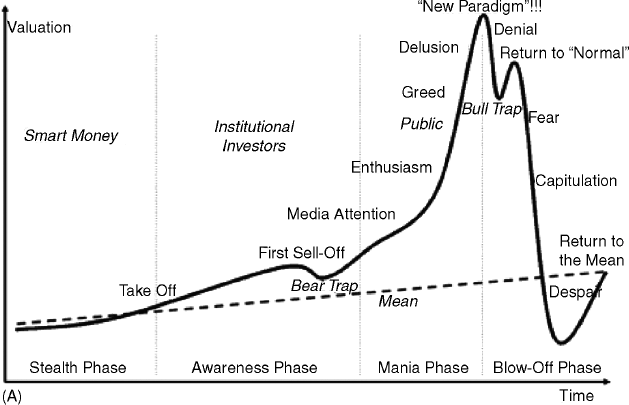
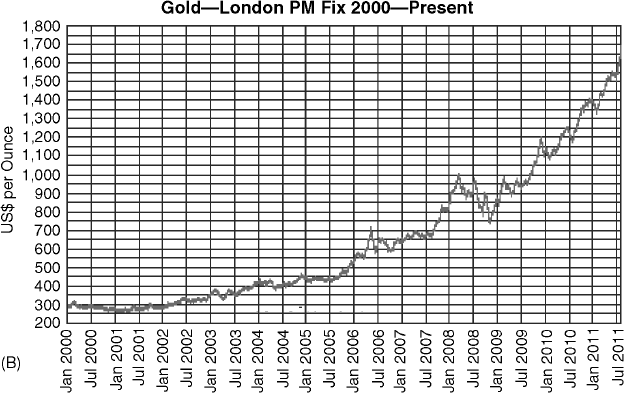
If we compare the anatomy of the theoretical bubble to gold prices since 2000, we can see very similar price movement. And if we compare the specific phases of bubbles by matching the proper examples in the case of gold, we can better identify where we currently stand within the bubble.
Matching up the stages of the bubble to the progression of gold prices, 2000 to 2003 was the “Stealth Phase,” during which the “Smart Money” investors bought gold. Smart Money investors generally precede the major price movement by being the first to catch on to a strong investment theme. They in turn lead the rest of the investment community to do as they did, and invest. Price increases during the Stealth Phase, but nowhere nearly as steeply as it does in the later stages.
With the introduction of the first gold ETF in March 2003 and then the largest gold ETF (GLD) in late 2004, the bubble transitioned to the “Awareness Phase” as large institutional investors such as mutual funds, hedge funds, banks, and others invested in gold. This phase also saw a selloff in 2008 that may have scared some investors away but did not end the bull market in gold.
Most gold bugs would argue that gold has not yet progressed through the parabolic “Mania Phase” since mass public attention over gold has not yet appeared. But with gold having made the front page of many magazines and newspapers (including the Wall Street Journal); rising to the forefront of financial news and media (CNBC, Fox Business, etc.); becoming the focus of a TV show (Gold Rush Alaska); inviting a tsunami of “We Buy Gold” stores; and welcoming euphoric price targets reaching $15,000 an ounce—it is hard to truly argue that we have not already seen the public engage in media attention, enthusiasm, greed, and possibly delusion on the way to the gold bubble peak.
If we were to update Figure 5.2, to match it with the gold bubble of 1970 to 1980, it appears that our current gold bubble fits almost perfectly together with the stages of the bubble. 2000 through 2004 was the smart money and beginning of the currency devaluation; 2005 through 2008 was the global investment demand phase triggered by the introduction of gold ETFs and other institutional investment; and from the 2008 bottom until 2011 we may be in the midst of a popular speculative mania, led by the media and the common investor, and approaching a final peak before the upcoming collapse. Though a final parabolic blow-off (which could see rapid price increases) is possible, the dangers of the subsequent bubble collapse and the rapidity with which prices will suddenly plummet make investing in gold highly risky and ill-advised for average and sophisticated investors alike.
Gold's Place in History: Elliott Waves
Must we, from this appalling and repeated record, draw once more the despairing conclusion that the only thing man learns from history is that man learns nothing from history?3
—Hazlitt
The price of gold may fall to its long-term average—well below $700 an ounce.
Looking further back in time, in order to see where the current gold bubble stands in the big picture of history, could help us predict when the top may come as well as the magnitude of the upcoming price collapse.
Stocks and commodities do not move straight in one direction; they swing up and down as optimism and pessimism take hold at different times and various magnitudes. In fact, the market's progression unfolds in waves, or “patterns of directional movement,”4 and may actually be fairly predictable. Since people are ultimately the source of price movement in stocks and commodities as they buy and invest, it is human behavior that guides the change in prices that takes place over time. And because human behavior, especially regarding investments, involves an alternation between optimism and pessimism, fear and greed, growth and decay, knowing where the mass psyche currently stands reveals a lot of information as to the current position within the up-and-down cycle. In other words, if we can assess the intensity of human optimism or pessimism at a given point, we can predict future price moves.
The Elliott Wave Principle
In 1978 Robert R. Prechter Jr. and A. J. Frost released their revolutionary book The Elliott Wave Principle, based on the 1930s works of Ralph Nelson Elliott. Applying a mathematical pattern that exists in nature—from pine cones to hurricanes to DNA—Prechter and Frost proved how “the same law that shapes living creatures and galaxies is inherent in the spirit and activities of men en masse.” And since the stock market is “the most meticulously tabulated reflector of mass psychology in the world,”5 applying the Elliott Wave Principle to the stock market produces a very accurate recording of mass investor psychology and trends. Using this method, Prechter called the 1982 bottom in stocks before the tremendous bull market that ensued; he also predicted the 2000 top that marked the beginning of the “Lost Decade,” and has been warning about a deflationary period that will see the Dow Jones drop well below its current level.
Gold undoubtedly has a massive psychological and emotional component among investors and people all over the world. Gold is not only used for jewelry or coins; it has become a go-to store of value and protection against worst-case scenarios. Its role as a “fear hedge” makes its psychological effects distinctively clear. Since gold is an historical reflector of mass psychology, the Elliott Wave Principle is an ideal match for explaining gold price movement and predicting its future course. But in order to apply the Elliott Wave Principle to gold, we must first understand how the principle works.
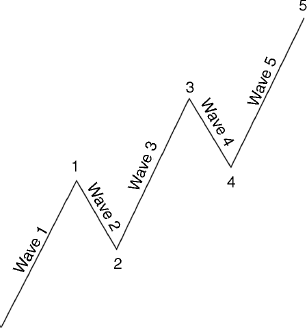
The market progresses in cycles of growth and decay, ups and downs. To the Elliott Wave practitioner, ups and downs are considered waves. The Wave Principle points to a five-wave structure of growth—with waves 1, 3, and 5 contributing to the rise in prices, and waves 2 and 4 moving counter to the trend, as a pause before the next price rise (see Figure 5.3). The Elliott Wave states that “progress takes place in a ‘three steps forward, two steps back’ fashion, a form that nature prefers.”6
Figure 5.3 The Basic Pattern
Source: A. J. Frost and Robert R. Prechter Jr., Elliott Wave Principle: Key to Market Behavior, 10th ed. (Gainesville, GA: New Classics Library, 2005), 22.
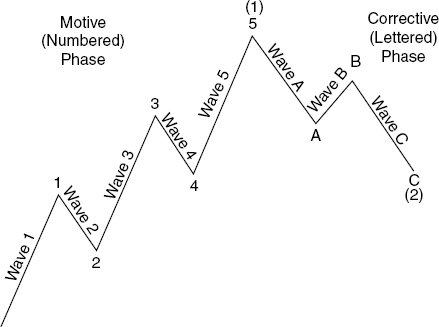
After reaching the end of the growth—or “motive”—phase that ends at the peak of wave 5, the market must then correct itself before continuing its upward direction. That “corrective” phase takes form in a three-wave structure, as opposed to the five-wave structure in the growth phase. Instead of the number format of waves 1 to 5 in the growth phase, the corrective phase is labeled A-B-C, with waves A and C contributing to the decline and wave B moving countertrend between the declines of waves A and C (see Figure 5.4).
Figure 5.4 Motive and Corrective Phases
Source: A. J. Frost and Robert R. Prechter Jr., Elliott Wave Principle: Key to Market Behavior, 10th ed. (Gainesville, GA: New Classics Library, 2005), 23.
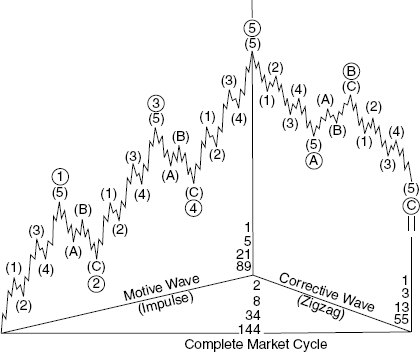
Moreover, the Elliott Wave Principle shows that each wave can then be broken up into subdividing waves in fractal form, so that waves exist in all time-frames—from minutes to days to weeks to months to years and even to millennia (see Figure 5.5).
Suffice it to say that the Elliott Wave Principle has much more to it than this book can present. I will, however, present you with my wave count for gold.
Figure 5.5 Complete Wave Broken Down into Fractals
Source: A. J. Frost and Robert R. Prechter Jr., Elliott Wave Principle: Key to Market Behavior, 10th ed. (Gainesville, GA: New Classics Library, 2005), 25.
Elliott Wave Principle Applied to Gold
Our first question when applying the Wave Principle is “where exactly does the motive, or growth, phase begin?” Once we find the beginning of the move, we can count the waves and assess our current position within the pattern. In simple terms, where is the bottom and how close are we to the top?
1968 to 1999
In a long-term view, we can trace the beginning of the gold price move either to 1934, when the government raised the fixed-price of gold from $20.67 an ounce to $35 an ounce, or to 1968 when the gold price began to respond to supply and demand factors rather than a fixed price. 1968 is more likely, since the structural factors of a free-flowing market price are likely to have enabled the gold bubble. Regardless of whether 1934 or 1968 was the beginning (though I think 1968 is more likely), the 1980 high of $850 an ounce clarifies our count, as we will soon see.
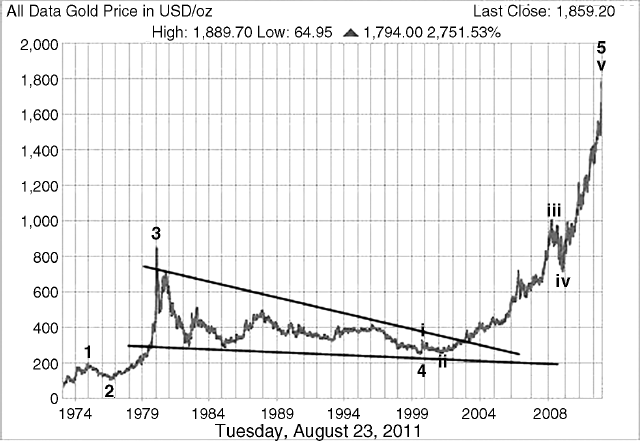
Assuming the 1968 bottom was the beginning of our long-term gold bull market, we must now count the highs and lows of the five-wave structure leading to 2011 (see Figure 5.6). First waves are generally small in comparison to ensuing waves, since they are the initial bursts that launch further price moves. In our case, the first wave can be seen from 1968 to 1975, where gold prices rose from $35 an ounce to $185.25 an ounce (February 24, 1975). In the ensuing wave 2, however, prices dropped from $185.25 an ounce to $103.50 an ounce (August 25, 1976)—a fairly deep correction of 44 percent. Following the wave 2 correction, gold saw an extremely sharp increase from the 1976 low to the $850 an ounce peak of 1980. Prices had increased from just above $100 an ounce to $850 an ounce in little over three years—a nearly 750 percent increase!
After reaching the $850 an ounce peak in 1980, however, gold prices entered a bear market that lasted nearly 20 years until 1999, and prices dropped to nearly $250 an ounce. Then came our current gold bull market, starting in 1999, with prices rising from a $252.80 an ounce low to over $1,900 an ounce in August 2011.
Putting it together, wave 1 lasted from 1968 to 1975, wave 2 corrected prices until 1976, wave 3 carried prices back up until 1980, and wave 4 corrected prices until 1999. So far, it appears that the four waves starting in 1968 fit very well with the long-term picture of gold prices. In fact, our wave count fits perfectly with Elliott Wave rules and guidelines. Firstly, wave 2 never moves beyond the start of wave 1; since the count begins at $35 an ounce and wave 2 corrected to $103.50 an ounce, this rule stands. Secondly, wave 3 is never the shortest wave; since wave 3 was approximately a $750 move (750 percent) in comparison to a move of approximately $160 (450 percent) for wave 1, wave 3 is automatically not the shortest wave (in absolute dollar terms) and this rule fits as well. Thirdly, wave 4 never moves beyond the end of wave 1; since the top of wave 1 was $185.25 an ounce and the bottom of wave 4 was $252.80 an ounce, the two waves did not overlap and this rule fits as well. Furthermore, the nearly 20-year bear market in gold from 1980 to 1999 formed a large triangle pattern. Since the Elliott Wave guidelines state that “wave 4 is usually a flat, triangle, or flat combination,” the wave 4 triangle from 1980 to 1999 fits in very well with the long-term picture.7
This brings us to our current gold bull market, from 1999 to now. If our wave count is correct, the move from 1999 to now is the fifth and final wave before a massive correction. And since many clues point to a gold bubble, the alignment of the wave counts with my claims for an upcoming collapse should add further strength to my argument. In fact, the nearly $1,700 move from the $252.80/oz bottom in 1999 to the August 2011 high near $1,900 an ounce points to a final extended wave that fits in perfectly with Elliott Wave rules. If the 1980 top to the 1999 bottom was a wave 4 triangle correction, our claims are further backed by the Elliott Wave Principle:
A triangle always occurs in a position prior to the final actionary wave in the pattern of one larger degree, i.e., as wave four in an impulse.8
Since the fifth wave from 1999 to now is the largest in dollar terms, the preceding fourth wave triangle predicted our current massive fifth wave:
Post-triangle advancing impulses in commodities at degrees above Intermediate are usually the longest wave in the sequence.9
Moreover, Elliott Wave rules and guidelines point to extended fifth waves in commodity bull markets:
Extended fifths are quite common in major bull markets in commodities.10
Commodity bull market extensions, moreover, often appear following a triangle in the fourth wave position. Thus, while post-triangle thrusts in the stock market are often “swift and short,” triangles in commodity bull markets of large degree often precede extended blowoffs.11
It is therefore not surprising that our bull market in gold since 1999 has been so extended and so dramatic. The problem, however, is that not only are we currently in the fifth and final wave, but corrections following extended fifth waves are usually massive:
Fifth wave extensions, truncated fifths, and ending diagonals all imply the same thing: dramatic reversal ahead.12
From the evidence above, it is almost perfectly clear that we are currently in the fifth and final wave. But in order to predict when gold prices will reach the top, we must first apply the Wave Principle to the subdivisions of this final wave.
1999 to Now
We have established that 1999 until now has been the extended fifth and final wave of the gold bull market. This final move has been accompanied by arguments that “things are different this time,” that the world is coming to an end, that gold will be the only source of value, and that gold serves as protection from almost any turmoil that may be upcoming. However, once again the investor psychology and behavior fits in perfectly with Elliott Wave Principles:
Fifth wave advances in the stock market are propelled by hope, while fifth wave advances in commodities are propelled by a comparatively dramatic emotion, fear: fear of inflation, fear of drought, fear of war.13
The fifth wave in gold has coincided with the “Lost Decade” in stocks. Understandably so, since the 2000 peak in stocks, gold has soared (see Figure 5.7).
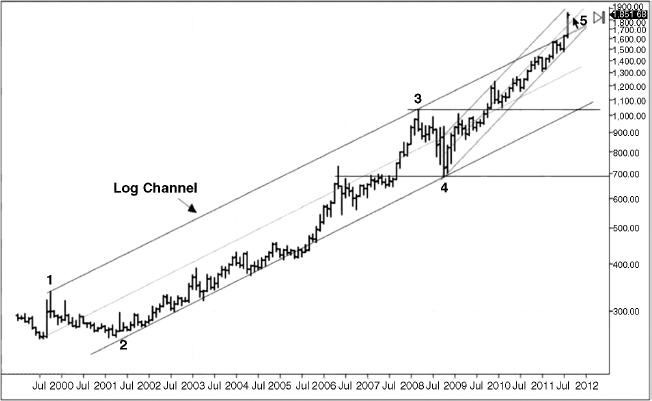
Within our current fifth wave, we can point out the subdividing waves. From the 1999 bottom, we can see wave 1 and wave 2, with wave 2 forming a very deep correction of wave 1—retracing 95.67 percent of wave 1. Once again our wave count conforms to theory, as the deep retracement formed by wave 2 fits in with the Elliott Wave Principles:
As a rough estimate, about half of first waves are part of the “basing” process and thus tend to be heavily corrected by wave two.14
From the wave 2 bottom on April 2, 2001, prices rose from $255.95 an ounce to $1,011.25 an ounce (March 17, 2008) before correcting back down to $681 an ounce (October 2008). The $750 move up and the ensuing $300 correction can be labeled as waves 3 and 4. Not only are waves 2 and 4 the most visible price corrections on the chart, but they also follow a very important Elliott Wave guideline:
Wave 4 will almost always be a different corrective pattern than wave 2.15
Since wave 2 was more of a gradual, sideways correction than the much sharper decline of wave 4, this “alternation” between corrective waves 2 and 4 stands as further evidence that we are currently in the fifth wave (starting in late 2008) of a larger fifth wave (starting in 1999). And while this current final fifth wave may extend and even end in a parabolic “blow-off” that sees prices shoot up for a period of time, it will ultimately end in disaster as many investors lose a huge percentage of their investments as prices collapse. Some investors may be able to monitor their gold investments and may even see significant profits. But the majority of investors who fail to closely monitor prices, or simply fail to sell their gold before the peak, will see significant losses.
Price Target for Gold Collapse
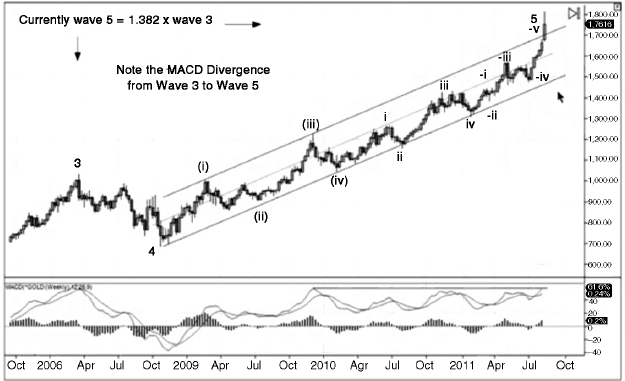
Since gold prices are up from $681 in October 2008 to over $1,900 by August 2011, the tremendous $1,200-plus rise since the wave 4 bottom in October 2008 (of the larger fifth wave that began in 1999) makes our current fifth and final wave the longest wave within our current gold bull market and also signals a “Fifth Wave Extension” (see Figure 5.8).
Figure 5.8 Wave Extensions
Source: A. J. Frost and Robert R. Prechter Jr., Elliott Wave Principle: Key to Market Behavior, 10th ed. (Gainesville, GA: New Classics Library, 2005), 69.
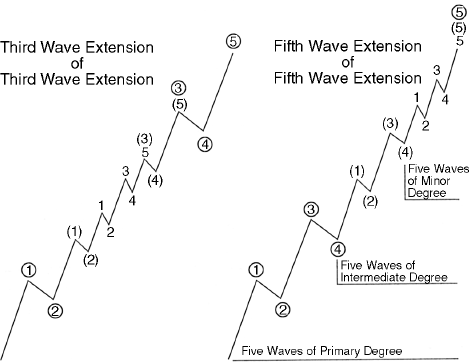
Since large commodity bull markets tend to show extended fifth waves (as opposed to extended third waves in stocks), the extension of a fifth wave in our gold bull market (see Figure 5.9) fits in very well with our outlook.
The Elliott Wave Principle even offers a measurement for the upcoming correction: an extended fifth wave is usually followed by a sharp correction that finds support at the low of wave 2 of the extension (Figure 5.10).16
Figure 5.10 Price Target Following Extended Waves
Source: A. J. Frost and Robert R. Prechter Jr., Elliott Wave Principle: Key to Market Behavior, 10th ed. (Gainesville, GA: New Classics Library, 2005), 69.
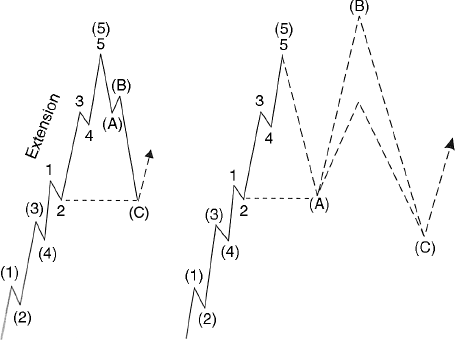
Applying the Elliott Wave target, gold prices should drop to and find support near the $1,000 to $1,200 range, to wave 2 of the extension. However, if the entire move since 1999 has been a fifth wave of a larger wave count dating back to 1968, prices may drop to the low of wave 2 of our larger fifth wave (starting in 1999)—a much steeper plunge to the low of $252.80 an ounce.
Moreover, the existence of a speculative bubble in gold makes the upcoming price collapse much more dangerous. Since the implosion of a bubble tends to drag prices down even below long-term averages, as panicked investors overreact to the downside, we can forecast prices to drop to levels near gold's long-term mean ($500 to $700) and below.
Prices don't collapse and bottom out in a straight-downwards move though. Once a peak is reached, prices will fall sharply in spurts and bursts; but there are many ups and downs along the way. The ups and downs may be opportunities for experienced or expert traders to buy and sell. But the most important thing to remember is: once the bubble pops, the trend is down.
Time cannot predict price changes by itself. But time relationships and durations between critical junctures in markets frequently reflect Fibonacci measurements and sequences. Applying Fibonacci time relationships to important years or periods can help us predict critical turning points in the future, especially if they coincide with wave counts or price targets.
The process involves first compiling a list of the important dates in the history of the market or investment theme and then adding Fibonacci sequences to the critical dates to see if a time relationship exists. First, let's compile the list of important dates in gold's history:
1934 Fixed price of gold is raised
1968 Beginning of free-market gold prices
1975 Peak of wave 1 of the larger gold bull market
1976 Bottom of wave 2
January 21, 1980 $850 an ounce, peak of wave 3
July 20, 1999 Bottom of wave 4, beginning of final wave 5
October 5, 1999 Peak of wave 1 within the larger wave 5
April 2, 2001 Bottom of wave 2 within the larger wave 5
March 17, 2008 Peak of wave 3 within the larger wave 5
October 24, 2008 Bottom of wave 4 within the larger wave 5
Next, we apply the Fibonacci sequence to the above dates to see if any time relationship appears:
1, 2, 3, 5, 8, 13, 21, 34, 55, 89, 144, 233, 377
(The sequence is formed by adding each number to the preceding number to derive the third number—for example, 1 + 2 = 3, 2 + 3 = 5, 3 + 5 = 8, and so on.)
There are certainly a number of Fibonacci relationships I have missed, but here are some I have found:
| 1934 to 1968 | → | 34 years |
| 1968 to 1980 | → | 12 years (13 +/– 1) |
| 1968 to 2001 | → | 33 years (34 +/– 1) |
| 1980 to 2001 | → | 21 years |
| 1999 to 2012 | → | 13 years |
| 1968 to 1980 | → | 144 months |
| January 21, 1980 to July 20, 1999 | → | 234 months (233 +/– 1) |
| July 20, 1999 to July 2011 | → | 144 months |
| 1968 to July 20, 1999 | → | 378 months (377 +/– 1) |
| January 21, 1980 to July 2011 | → | 378 months (377 +/– 1) |
Based on the above time relationships, it appears that 1968, 1980, 1999, and 2001 were significant years. The fact that these years coincide with our wave count and also display a measurable time relationship to each other highly increases the probability that our analysis is correct. Moreover, if we use these important years and project Fibonacci relationships into the future, we may be able to predict the upcoming turning points.
2023 (+/– 2) appears to be a significant year, though it is quite far away (1934 + 89 = 2023; 1968 + 55 = 2023; 2001 + 21 = 2022).
July 2011 also shows significant time relationships with the 1999 bottom and 1980 top. Since deviations of +/– 1 are allowed for durations of 21 and 34; deviations of +/– 2 for 55 and 89; and deviations of +/– 3 for 144, 233, and 377, July 2011 +/– 3 months could be a target for the top. In other words, the top may be reached between July and October 2011.
In addition to wave counts, technical analysis, and the multitude of reasons why gold is showing signs of an upcoming drop, gold's pattern of popularity and weakness during specific times of the year could reveal when gold prices have a high probability of falling. Otherwise known as “seasonality,” the strength or weakness of an underlying asset or investment during specific time periods throughout the year can provide a considerable amount of momentum behind future price moves. If we really are nearing the peak of the gold bubble, when is the likely time for prices to begin to fall?
Interestingly, since our current gold bubble starting in 1999 is part of a larger gold bubble that began in 1968, we must compare yet differentiate between the seasonality patterns of both time frames. The gold boom of the 1970s encompassed a largely different set of circumstances—especially much higher inflation rates, which spurred the buying of gold as an inflationary hedge. Moreover, the gold bear market from 1980 to 1999 has affected the seasonality pattern in a much different way from our current bull market from 1999 to now. Therefore, we must look at seasonality patterns for two time periods—from the late 1960s and early 1970s to now, and from 1999 to now.
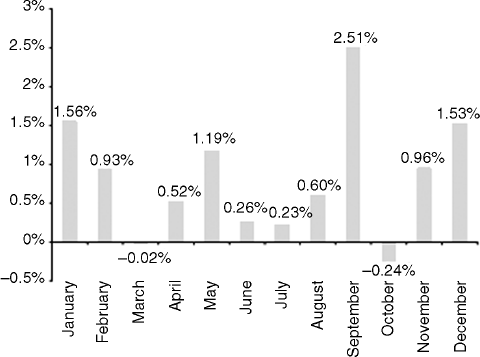
Figure 5.11 Gold Seasonality, January 1969 to July 2010 (average monthly returns)
Source: Bloomberg, Seeking Alpha.
Our current gold bull market, starting in 1999, has been very strong near year-end (see Table 5.1). Out of the 12 years from 1999 to 2010, gold prices reached their highs six times in December, once in September, once in October, and once in November. Only 3 out of 12 years saw highs in the months before September—a February high in 2000, May high in 2006, and March high in 2008. As for the lows of the year—four times in January, two times in February, two times in April, one time in May, one time in July, and two times in October. As opposed to the yearly highs, yearly lows have been reached in the first half of the year, with half of the lows in January and February. Based on seasonality for the past 12 years, gold prices could see increasing strength as we enter year-end. However, the peaks and bursting of bubbles generally come almost unexpectedly and at the worst time for investors. If that is the case, the gold bubble could actually begin to collapse at what has been the most popular time during this bull market. Year-end will be either a strong push upward or a reversal of direction to mark the end of higher prices.
Table 5.1 Gold Seasonality, 1999 to 2010.
Source: Kitco, Bloomberg, Erste Group Research.
| Year Low | Year High | |
| 1999 | July 20 | October 5 |
| 2000 | October 27 | February 7 |
| 2001 | April 2 | September 17 |
| 2002 | January 4 | December 27 |
| 2003 | April 7 | December 31 |
| 2004 | May 10 | December 2 |
| 2005 | February 8 | December 12 |
| 2006 | January 5 | May 12 |
| 2007 | January 10 | November 8 |
| 2008 | October 24 | March 17 |
| 2009 | January 15 | December 2 |
| 2010 | February 5 | December 6 |
Looking at seasonality in gold prices from 1969 to 201017 (see Figure 5.11), we can see that September is the strongest month in terms of average monthly returns and October is the weakest. March through August tend to be quieter than the early months and year-end.
As Figure 5.12 shows, the late summer season has been very strong for gold and gold stocks since 2001, with consistent gains for 10 years.
Figure 5.12 Late Summer Rally for Gold and Gold Stocks Note: 2001 to 2003: TSE Gold and Precious Metals Index; 2004 to 2006: S&P/TSX Gold Index; 2007 to Present: S&P/TSX Global Gold Index.
Source: Bloomberg, Bank of America, Merrill Lynch Global Research.
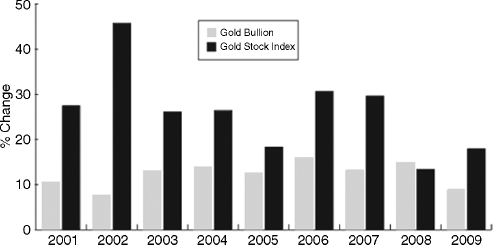
We have passed the late-summer period that has been historically very strong for gold. Gold performed very well in August and beginning of September 2011, and may have reached a peak. If weakness emerges near year-end, the chances of a reversal are much more likely.
By tracing the gold bubble back to 1934, 1968, and 1999, we have presented a study of the anatomy of a bubble and the dire consequences that may soon befall gold. After presenting the various stages of a typical bubble, we have come to the conclusion that the gold bubble is likely intensely engrossed in the “mania” phase already and is near the peak. Aside from the long list of clues pointing to the overspeculative behavior generally associated with the popular mania phase, we have supported our claims of a gold bubble with a very thorough analysis of the technicals and price action in gold since 1968, when gold prices began responding to supply/demand factors rather than a fixed price. Applying the Elliott Wave Principle to gold, we have also put the gold bubble in historical perspective, pointing out that our current bull market in gold since 1999 is the longest and final wave of a larger bull market in gold starting in 1968. The gold bubble is at or near a peak, and is strongly confirmed by many Elliott Wave guidelines.
Moreover, based on its long-term average, gold is way beyond fair value. Instead of $1,900 an ounce, reasonable gold prices should be closer to $500 to $700 an ounce. Supported by Fibonacci time relationships and seasonality patterns, the likelihood that a peak in gold has already formed or rapidly approaching is almost certain. The possibility of a final blow-off phase is still not ruled out, but the risks in gold are enormous. Now is not the time to buy gold.
