Chapter 6
What Does Gold Depend On?
Gold's future is highly dependent on the direction of the stock market, U.S. dollar, and global economies. Since gold's tremendous run has coincided with a period of volatile markets and sharp declines in stocks, a continuation of the gold bull market may hinge upon the persistent weakness in stocks and economies. Gold's popularity as a “fear hedge” has greatly benefited from weak markets and concerns over the future sustainability of the economic recovery. At the same time, however, gold prices have risen the most when stock prices increased as well. In other words, even though gold is viewed as a safe haven from falling stock prices, its growing correlation with stocks makes it increasingly likely that gold will move in the same direction as the stock market. Since gold is a commodity, it benefits from economic expansions that see rising asset prices; recessions, on the other hand, cause asset and commodity prices to fall, which should bring a decline in gold.
As I see it, gold's future direction relies on two main possible scenarios. The first—rising stock prices—could benefit gold, as asset prices continue rising and as gold benefits from continued commodity price increases. The major problem with rising stock prices, however, is that gold has soared due to fears over falling stock prices. Since many investors and institutions bought gold due to expectations of falling stock markets, a rising stock market would likely convince many gold investors to exit the gold trade and invest in stocks instead, as faith in the stock market returns. Rising stock prices would therefore end gold's run, as stability in stocks resumes.
A second scenario—falling stock prices—would likely hurt gold as well. Though gold is touted as a safe haven that would benefit from falling stock prices, it has become so overvalued and speculative that it would likely fall together with falling stock prices. As we've mentioned, gold is still a commodity, and is likely to fall as asset prices decline. At the same time, gold has seen nearly all of its gains during economic expansions and rising stock prices; falling stocks are actually a threat to gold. Moreover, gold has benefited from massive currency devaluation and excess liquidity. If stock prices fall, recession takes hold, or a liquidity crunch materializes, gold prices are more likely to fall as deflationary pressures bring asset prices down. Gold is increasingly correlated with stocks and benefits from increasing stock prices. Falling stock markets would therefore hurt gold.
I currently favor the outlook of a renewed recession and falling stock prices. This chapter will present the factors pointing to falling stocks, a rising U.S. dollar, and the fate of emerging markets—factors which the gold theme is highly dependent on and which signal a very likely drop in gold prices.
Herd Mentality in the Stock Market
A compelling piece of evidence that the market is full of euphoria: over 90 percent of analyst ratings were “buy” or “outperform” as of May 2011 (see Figure 6.1). This decisive number of bullish analyst opinion undoubtedly spurs extra excitement and optimism among investors, which in turn results in increased buying, until the point where buyers run out or reality sets in. When over 90 percent of analysts prepare for a well-performing market, investors should prepare for the worst-performing market.
Figure 6.1 Consensus Analyst Ratings for the Stocks in the S&P 500
Source: Business Insider, Bloomberg, Catalpa Capital Advisers (May 2011).

If those analysts are right—and the market continues to rise—gold will fall, since the fear in the markets will subside and economies will get back on track. But more likely, markets will fall and gold will follow. Gold will not be able to fulfill its role as a safe haven; it will fall together with a dropping market. Its failure to act as protection, as people had hoped, will cause them to sell gold. Gold will not serve as protection during an upcoming recession.
Analysts are not the only market participants displaying a heavy dose of euphoria. By December 2010, the total Short Interest for the S&P 500 (which measures bearish bets on stocks) was back down to 2007 levels.1 With short interest at 2007 levels (see Figure 6.2), investors have signaled that they are as bullish as they were near the 2007 stock market peak. And since we are nowhere near 2007 levels in terms of economic strength, such a signal is a warning of excess and unwarranted optimism.
My response to a bullish investor is as follows.
The market is up about 100 percent from the 2009 lows. China and emerging markets are showing weakness. A large part of U.S. investments are based on growing emerging countries continuing to perform well. China and others will begin to fall as asset bubbles within their countries begin to pop. Credit will then dry up, and investors will sell in a panic. The falling emerging markets will cause investors to realize that any investment relying on Chinese and emerging market growth is no longer a good investment. Commodities will then fall since emerging market growth is much lower than expected. U.S. markets will inevitably be dragged into the turmoil, since the United States hasn't truly fixed its own economic and financial problems of the past decade. The risks are too large and the hurdles too numerous to be bullish right now.
Are We Headed for Another Great Depression?
Originally published March 11, 2011: “What Can the Great Depression Teach Us about Our Great Recession?,” Seeking Alpha.2
Is the massive market rally of the past two years just a temporary recovery that has tricked many investors to jump back into stocks right before the next plunge? And how can the Great Depression reveal what may happen to the markets this year, more than 80 years later?
As we enter the third year of what has been a very impressive “bull” market, many are left wondering whether this incredible run of as much as 100 percent on the S&P 500 can continue—and for how long. Yet while the economy seems to have rebounded very strongly off its early 2009 lows, accompanied by improving fundamentals, increased company earnings, and a more optimistic consumer, many investors fail to at least consider the thought that this entire “recovery” could, in fact, be just an extreme overreaction to the 2008 market crash. In other words, the huge rally we have seen in the global stock markets since early 2009 could be just a temporary recovery and pause before the next—and possibly worse—market decline.
It was only recently that the fear of an economic “double dip”—a plunge back down to recession—intensely gripped the markets. The “flash crash,” BP oil spill, European troubles, high unemployment, and potential derailment of the economy all posed a severe threat to the viability of our recovery. Yet while many parts of the economy seem to have been improving, there are still so many issues surfacing daily that most of the world is basically ignoring. I am not saying that all these issues are guaranteed to pull us back into recession, but with such a huge rebound in stocks accompanied by so many potential derailers, it is not so far-fetched to at least consider the possibilities of the tremendous upcoming turmoil.
The issues now: huge government debt, credit crisis, European troubles, high insider selling, Middle East turmoil, surging oil prices that threaten to hurt the economy, soaring commodity prices, surfacing inflation, uncertainty about the Fed's QE2 and QE3, billions of dollars of toxic assets on the balance sheets of many banks, emerging market weakness since the end of 2010, real estate bubbles from China to Singapore, rationalization of fundamentals and a strong complacency that things will continue to be just as positive as they have been, a very slowly improving unemployment picture, and perhaps one of the most telling points—the average investor is finally getting back in, and maybe right at the end of the rally.
So why should investors at least consider the possibility of a double dip? What are the potential scenarios if this tremendous market rally was, in fact, a fool's rally? And what can the Great Depression teach us about our current situation?
First, we must understand what a fool's rally is. Otherwise known as a dead cat bounce, the fool's rally is a corrective bounce or temporary rebound that follows a severe decline in an individual stock or broader market. Following a severe decline, stocks and markets can sometimes see sharp bounces off the lows as a rapid overreaction to the downside is followed by an overreactive bounce to the upside. In other words, a market crashes quickly and sharply but rebounds temporarily as much of the bad news takes some time to fully sink in.
This phenomenon has been termed the dead cat bounce based on the saying that “even a dead cat will bounce if dropped from high enough.”
The dead cat bounce is just a temporary recovery, however.
The scenario follows five stages: (1) the market drops sharply; (2) after an extreme downturn, the market recovers as some investors buy up what they consider to be “value” stocks; (3) the market cannot make it all the way back up to where it started its down move, however, because the economy is nowhere near as healthy as it was; (4) the investors who have pulled their money out of the stock market or who have missed the recovery now jump back in, thinking the market is going back up; and (5) since this has been a dead cat bounce, and therefore is merely a corrective rebound before the dead cat falls back down, many investors were tricked into thinking the recovery was underway—but the market enters the next phase of decline or recession. A double dip takes place.
Think of a tennis ball dropped from the top of a building: as it drops, it gains momentum, hits the ground, and bounces up—but the bounce cannot be as high as its original point. And following that bounce, it will ultimately be pulled back down by gravity. So too with the dead cat bounce—the market drops from above, falls sharply, hits the “ground,” bounces back up (but not as high), and ultimately falls back down.
I bring the Great Depression up because it is one of the best examples of a dead cat bounce. We often think of the Wall Street Crash of 1929 as the biggest event of the Great Depression, and perhaps also consider it to be the biggest drop in the market. But the Crash of 1929 was just the beginning. The following describes how the dead cat bounce played out in the Great Depression.
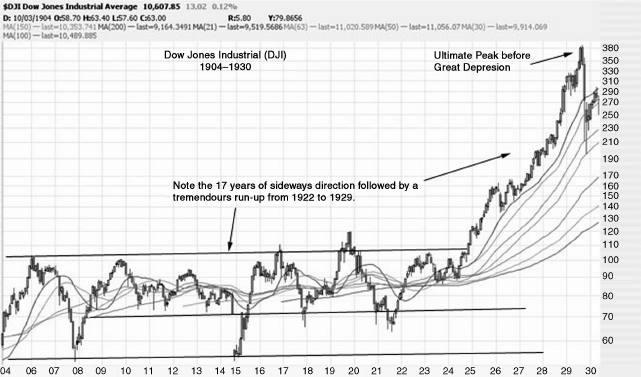
Following 17 years of sideways movement beginning in 1904, the market finally embarked on an uptrend from 1921 to the ultimate peak of 1929 (see Figure 6.3).
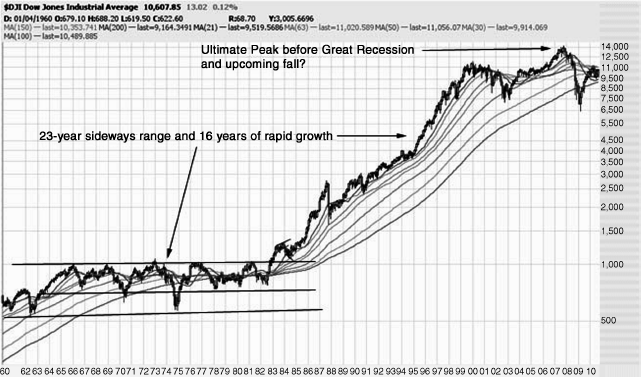
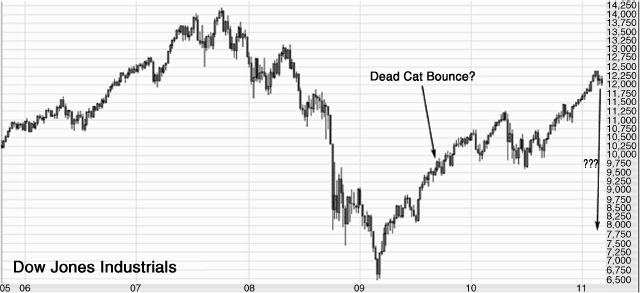
Compare Figure 6.3 to what we have recently seen in our market, shown in Figure 6.4.
Like the Dow from 1904 to 1921, the Dow of 1960 to 1983 was also stuck in a long sideways trend. It eventually broke out above the 1,000 level in 1983 and began one of the greatest bull markets we have ever seen. Like the 1929 top before the Great Depression, the 2007 peak marked the top before the Great Recession we find ourselves in. Figures 6.2 and 6.3 look eerily similar, and make dismissing the relationship between the Great Depression and Great Recession almost a fool's move.
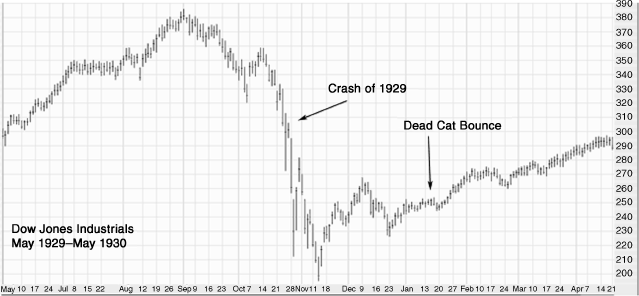
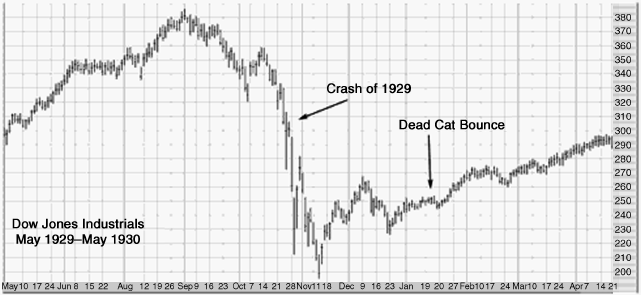
Now take a look at Figure 6.5, showing the 1929 stock market crash.
After reaching a peak of 380-plus, the Dow tumbled to under 200 as the Crash of 1929 sent markets into a free-fall. Following the Crash, a dead cat bounce took place—raising the market approximately 50 percent.
Compare the Wall Street Crash/dead cat bounce scenario just described with our recent market (2006 to 2011), as shown in Figure 6.6.
After a bull market from 2003 to the end of 2007, the Dow reached a peak of over 14,000. As the housing market collapsed, so did the stock market—sending the Dow below 6,500. As in the Dow of 1929 to 1930, a potential dead cat bounce has followed since 2009.
The question remains—what followed the dead cat bounce of 1929 to 1930, and will our market follow the same course? Figure 6.7 shows how it played out in 1930.
Figure 6.7 What Followed the Dead Cat Bounce of 1929 to 1930
Source: thinkorswim, Chart Prophet LLC.
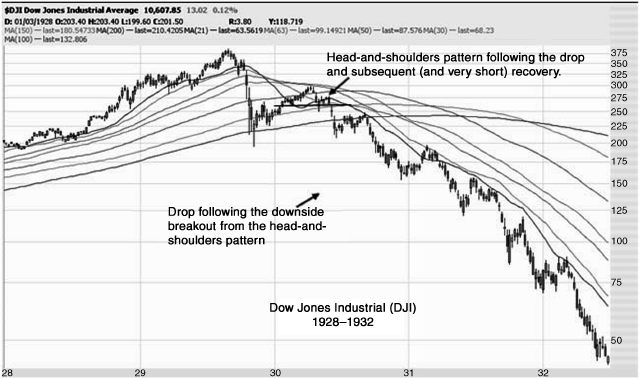
The Crash of 1929 was almost negligible in comparison to the Great Depression that followed. The crash sent the Dow tumbling from 380 to 200, and was followed by a dead cat bounce that recovered over 50 percent of the value lost in the crash; but the real damage was done beginning in April 1930 and lasting until late 1932, when the Dow toppled from nearly 300 to less than 50—a loss of over 83 percent.
The dead cat bounce in 1929 and 1930 was just a corrective overreaction to the steep plunge that the Crash of 1929 brought to the market. But as we can see, the crash and the ensuing bounce were nothing compared to the huge drop that followed and carried through until the end of the Great Depression.
We now find ourselves in perhaps a similar situation—a market that saw a very impressive bull run for years, and reached a lofty top followed by a severe downturn in 2008 and early 2009. It has since shown signs of improving, and many investors and economists are optimistic about the future—thinking the worst is behind us. But with so many negative and potentially devastating issues constantly surfacing, can it be that we are in the middle of a dead cat bounce before reality sets in and the market plunges back down into recession? I do not yet know the answer to that question, but with the very strong similarities between our market and that of the Great Depression, it would be very wise to at least pay attention.
Has the 500-Point Drop Confirmed a Great Depression 2.0?
This section is based on two articles, originally published August 5, 2011 and October 26, 2011: “Has the 500-Point Drop Confirmed a Great Depression 2.0?”3 and “Stocks Are Approaching a Brick Wall?,”4 Seeking Alpha.
After a two-year or longer “bull” market, the nearly 5 percent drop in the broad S&P 500 on August 5, 2011, may be confirmation that the bear market has resumed, and that round two of the recession is on its way.
The majority of the world is either optimistic or unsure about the future of the global economy. But with so many hurdles in the way and warning signals that point to a slowing, if not collapsing, global economy, the prudent and rational investor would be extremely wise to protect his or her portfolio, if not pull out of stocks completely.
After essentially crashing from late 2007 to early 2009 and losing nearly 60 percent of its value, the stock market (as represented by the S&P 500) bounced back and more than doubled from March 2009 to early May 2011. However, even though the “recovery” powerfully carried stocks back toward the 2007 all-time highs, the stock market failed to make new highs. The failure to make new highs is a warning sign that we have yet to truly recover, regardless of the relative improvements since the depths of the recession. Even worse, the tremendous upward thrust in the stock market could have been just an illusion of recovery right before the next—and worse—recession and stock market crash.
The two-year or longer “bull market” and “recovery” from the 2009 lows could be just a sharp bounce and counterreaction to the deadly economic situation the world is actually in. The bad news takes time to fully sink in, and this fact has allowed markets to rise on hopes of a sustainable recovery. Instead, the “recovery” in stocks and economies may have been just a pause before reality sets in and markets resume their downtrend.
As we warned in March 2011, this fake rally in stocks and economies may have been a fool's rally or a dead cat bounce—a sharp countertrend rally before the market falls back into recession. Even more, this dead cat bounce we have witnessed is very similar to the fake rally that took place following the stock market crash of 1929—before the Great Depression entered its worst stages. In other words, unless we resume the uptrend in stocks and sustain new highs, the global economy may be doomed to follow in a similar path to the Great Depression.
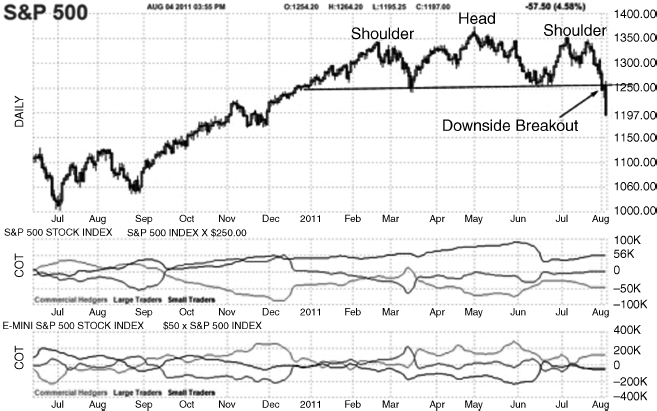
Forming a large head-and-shoulders reversal pattern since the beginning of 2011, the S&P 500, Dow Jones Industrial Average, and many other market sectors and stocks may have capitulated in August—signaling the beginning of a renewed downturn (see Figure 6.8).
Breaking down through the “neckline” (drawn under the head-and-shoulders pattern), the stock market has likely resumed its downtrend and confirmed an upcoming recession. We warned readers to get out of stocks on August 5.
Since the head-and-shoulders pattern is one of the best signs of a peak in stocks, long-term investors would be greedy and stupid (excuse my honesty) in staying invested. Yes, there is still a chance the market makes new highs; but why take such a huge risk after a 100 percent (or greater) move from the 2009 lows, when bad news continues to emerge, and when stocks just underwent one of the sharpest drops ever in August? The wise decision would be to pull out of stocks until we get some more clarity.
To emphasize how risky it would be to buy stocks at this point, take a look at Figure 6.9. The similarity between the “textbook” head-and-shoulders pattern and our actual, real-world situation (seen in Figure 6.10) is shockingly uncanny.
Figure 6.9 Textbook Head-and-Shoulders with Pullback
Source: Charles D. Kirkpatrick and Julie R. Dahlquist, Technical Analysis (Upper Saddle River, NJ: FT Press, 2007), 333.
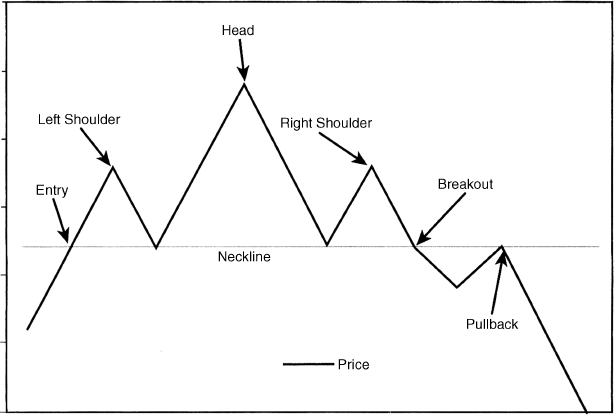
If, in fact, the S&P 500 has just formed and broken down from a head-and-shoulders top, an upcoming drop could be severe, and could usher in a very serious recession. To make matters worse, the tremendous bounce in October (which has been the best month for the Dow Jones in 10 years) may have tricked many investors to jump back into stocks right before the next plunge. Many investors who just read the headlines and see “Stock Market Posts Best Gains in 10 Years” have jumped back in without realizing that even with the best month in years, the stock market is still down. If the head-and-shoulders pattern plays out, this tremendous bounce in October has just been a “pullback” to the neckline of the pattern—right before resuming the downtrend. We expect stocks to fail at the maximum range between 1,275 and 1,300 on the S&P 500 and between 12,250 and 12,500 on the Dow. If prices break through and sustain above, the head-and-shoulders pattern may be nullified. But regardless, the risks of going long at these levels are tremendous.
Figure 6.11 S&P 500 Approaches Break-Even Resistance
Source: Yahoo! Finance.
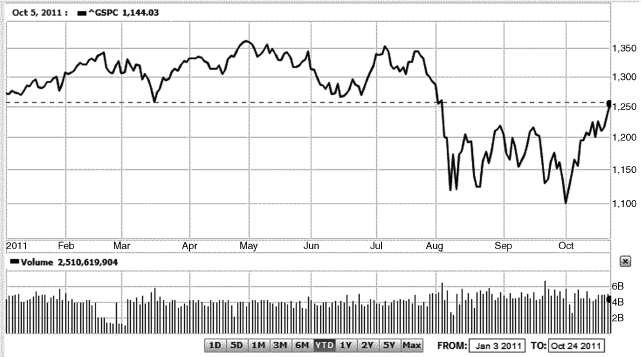
Even if you don't believe in technical analysis and chart patterns, here's a reason why we still may be approaching a very strong barrier: the bottom of the head-and-shoulders pattern that we pointed out happens to coincide almost perfectly with the level at which the stock market began in 2011 (see Figure 6.12). In other words, we are approaching the level where stocks began the year. Why is this such a big deal? Because as stocks approach that level, many investors and funds will begin to pull out of the market in order to break even. Considering we are approaching this break-even level from below, it could act as very strong resistance. Prices may break above, but why take such a huge risk when we are right at that level and chances are greater that stocks will fail.
Comparing Figures 6.12 and 6.13, we can see that the market since the 2007 top is eerily similar to the market of the Great Depression.
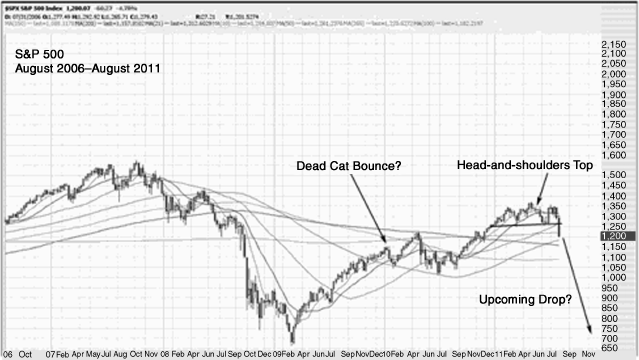
The Crash of 1929 was nothing compared to the Great Depression that ensued. The dead cat bounce from November 1929 to May 1930 was just a temporary pause and trap before the next drop. If our current market from 2006 to 2011 is anything like the market preceding the Great Depression (see Figure 6.14), we may be setting up for a huge upcoming recession.
Figure 6.14 Head-and-Shoulders Pattern Tops the Dead Cat Bounce of 1929 to 1930 before the Great Depression
Source: thinkorswim, Chart Prophet LLC.
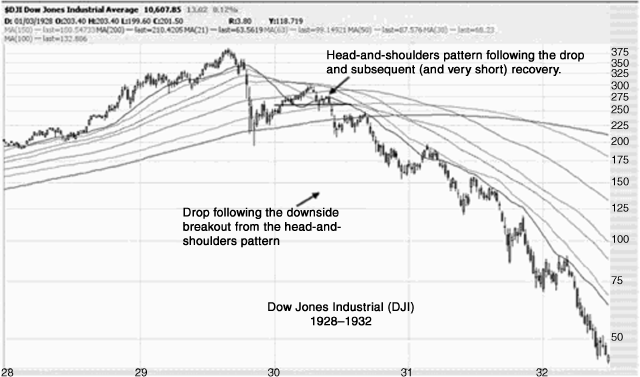
I'd prefer not to be such a doomsayer, but with our market currently behaving so similarly to that of the Great Depression, I can't help but at least present the possibilities.
Market Cycle Predicts Recession
Originally published April 18, 2011: “Sector Rotation: How Energy and Consumer Staples May Reveal a Contraction,” Seeking Alpha.5
Paying close attention to which sectors are outperforming other sectors or the overall market can tell us a lot about which phase of the economic cycle we are currently in—and where we may be heading.
As the economic recovery and expansion progresses, leadership within and among the various market sectors and industries can tell us a lot about how the economy is truly behaving. Depending on the relatively defensive or aggressive nature of investors at a specific time, the economic and business environment, and numerous other factors such as interest rates, forecasted growth, and the overall cause-and-effect nature of what has become a “global” marketplace, certain sectors outperform others at specific stages of the economic cycle. And the outperformance of certain sectors over others may actually be predictable!
Sector rotation is not a new concept. The idea that some companies do better than others in certain economic environments is well established. For example, cyclical companies whose profits seesaw together with the strength or weakness of the economy perform much better during economic expansions that see a healthy, strong consumer with increased spending power to buy their products. At the same time, noncyclical companies whose profits remain relatively unaffected by the ups and downs—due to the fact that their products are essential to consumers regardless of the economic environment—show much steadier performance throughout the economic cycle. Cyclical and noncyclical are far from being the only two sectors in the market (as financials, utilities, energy, basic materials, technology, and others exist as well), but the ability to monitor and compare the performance of the specific sectors and industries at various times may help us find future winners, improve asset allocation decisions, and even predict future market moves.
The rotation between the different market sectors is even predictable (see Figure 6.15).
Figure 6.15 How Market Sectors Perform during the Business Cycle
Source: Sam Stovall, Standard & Poor's Guide to Sector Investing, (New York: McGraw-Hill, 1995).
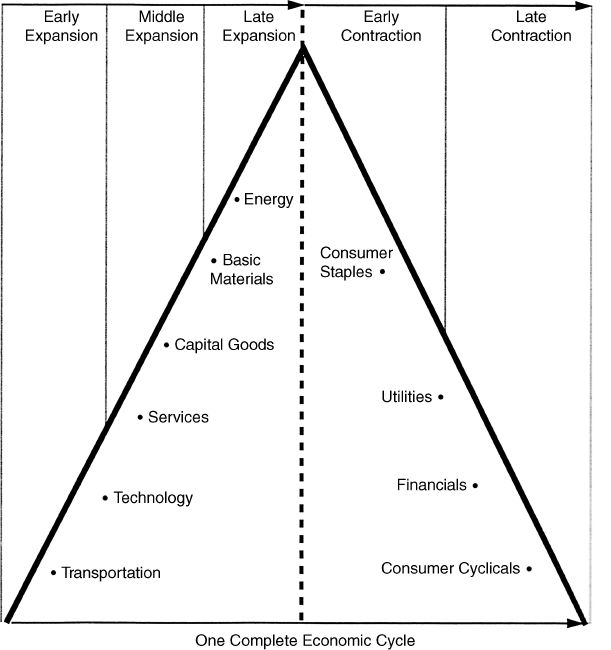
As you can see, different sectors outperform the others depending on the stage of the economic cycle. Based on the chart, the beginning of an economic recovery sees transportation and technology stocks outperforming others due to a pickup in economic activity, an increased need to physically deliver more products, and higher investment and expenditure on new technologies for the new business cycle. The cycle continues from early expansion to middle expansion and, finally, to late expansion—with different sectors dominating as the economy recovers, grows, and approaches an economic contraction. As the cycle then enters the contraction phases (early and late), other sectors stand to benefit. And the cycle repeats.
So Where in the Cycle Are We Now?
Following a huge economic contraction and the onset of the Great Recession from late 2007 to early 2009, markets have rebounded tremendously—with the S&P 500 seeing returns of over 100 percent from the 2009 lows. But after nearly two years of historically record-breaking performance, many signs of potential trouble ahead are brewing. And according to the sector rotation theories we have discussed and presented, our current position within the economic cycle may have approached the end of the expansionary phase.
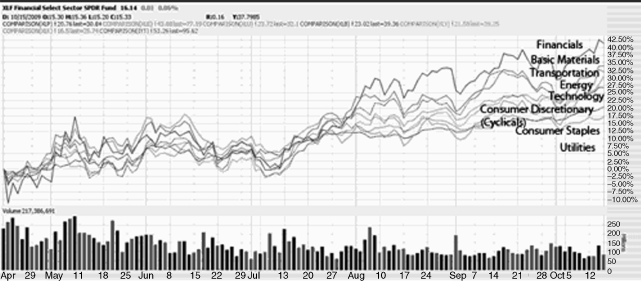
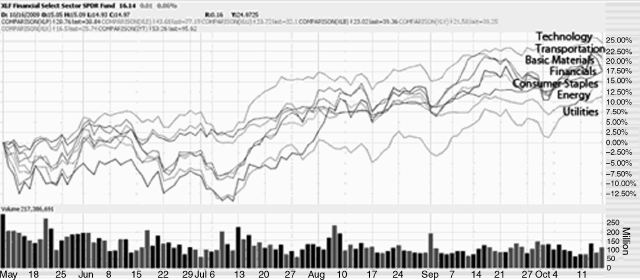
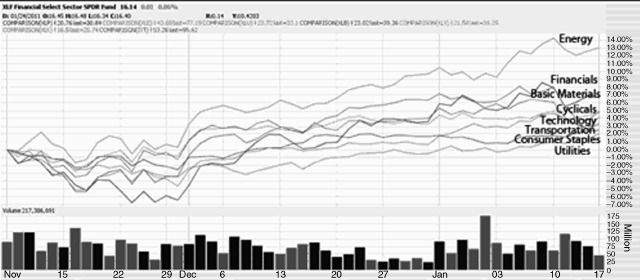
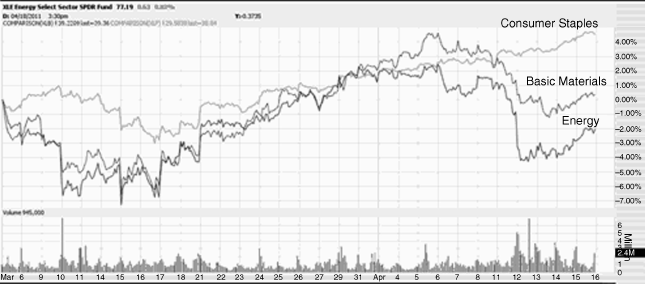
Following the huge economic contraction of 2008 and early 2009, we can see in Figure 6.16 that the financial and consumer discretionary (cyclicals) sectors led the way in early-to-mid 2009 as the economy was transitioning from late contraction to early expansion (note how these two sectors outperformed the others). The technology and transportation sectors also led the way since mid-2010, as the economic expansion continued (Figure 6.17). But starting in November 2010, energy and basic materials have outperformed the rest of the market, with energy massively outperforming the other sectors by 6 to 11 percentage points (Figure 6.18).
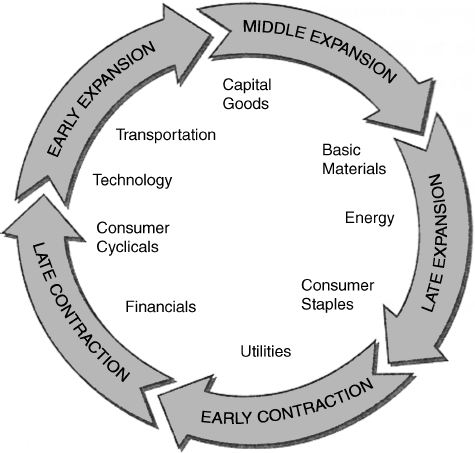
The massive outperformance of energy over the broader market over the course of five to six months may serve as a very important warning signal of a potential end to the expansionary cycle in the economy. Due to rising energy prices and the buildup of increasing inflationary pressures, the energy sector usually outperforms at the end of the cycle (see Figure 6.19). If the sector rotation theory is correct about the order of sector performance throughout the economic cycle, the onset of outperformance by the basic materials and energy sectors signals we have entered the late expansion phase and are nearing a contraction.
Figure 6.19 Sector Rotation and the Economic Cycle
Source: John J. Murphy, Intermarket Analysis (Hoboken, N.J.: John Wiley & Sons), p. 200.
Actionable Investing Strategies
If the sector rotation is correct, then we can expect consumer staples (XLP) and utilities (XLU) to outperform in the next phase of the cycle. In fact, if we see consumer staples and utilities outperforming, it may even be signaling the beginning of the contractionary phase in our economic cycle—and the potential beginnings of a new recession.
The first sign of a transition in sector strength, according to this theory, is the gradual weakening of the leading sectors and the strengthening of the next sector in line. In our case, the weakening of the energy sector in comparison to the consumer staples sector is our first sign of such a change.
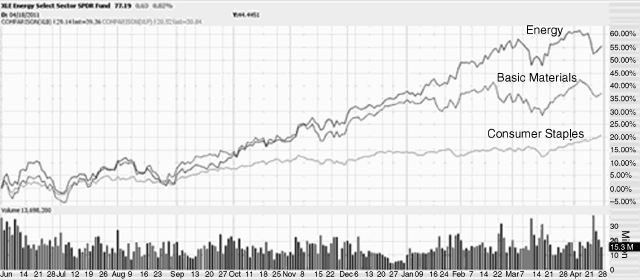
From June 2010 until early 2011, energy and basic materials far outperformed the consumer staples sector, seen in Figure 6.20
However, since early March 2011, consumer staples have been outperforming both basic materials and energy, as seen in Figure 6.21
Such a shift in market leadership not only signals the need for a new investing strategy, but may also point to the beginnings of an economic contraction. Consumer staples stocks are generally safe stocks, and see heavy investor interest when economic downturns are on the horizon; since consumer staples companies (such as Procter & Gamble [PG], Phillip Morris [PM], Wal-Mart [WMT], and Coca-Cola [KO]) sell products that consumers must buy regardless of the economic condition, investors use these stocks as safe-havens and protection from the harmful effects that recessions have on most other companies. An increase in relative performance of the staples (XLP) in comparison to the other sectors, then, may be a signal that investors are beginning to decrease their risk exposure and that they may even be expecting a market downturn.
Our recommendation in April 2011 was to invest in the consumer staples sector. Investors could do so by either investing in the broad consumer staples ETFs (XLP) or through individual companies within the sector such as Procter & Gamble (PG), Molson Coors (TAP), General Mills (GIS), Kraft (KFT), and CVS (CVS) among others. The consumer staples not only offer relative protection in case of an economic downturn, but would also provide investors with income from dividends, because many consumer staples companies pay out dividends to shareholders. If our analysis is correct, the outperformance of the consumer staples not only provided a good investment opportunity, but also signaled the onset of an upcoming economic contraction. Slowing economic growth worldwide will mean falling stock prices, a decreased demand for commodities, and likely a drop in gold and other “safe” plays.
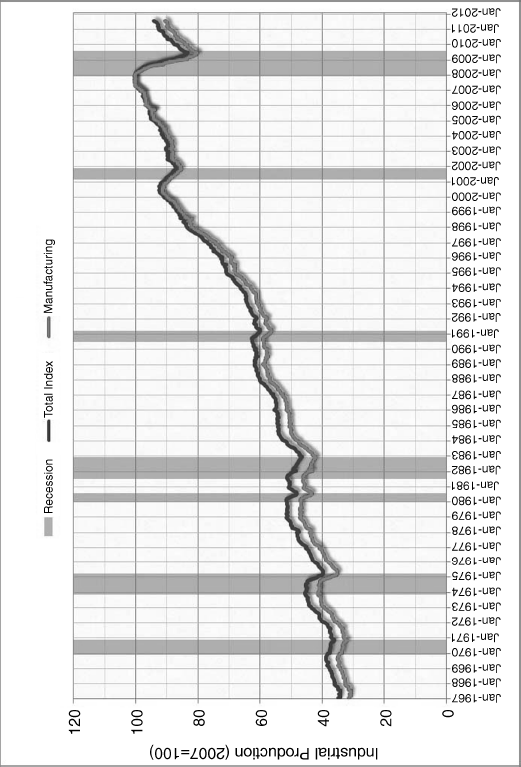
Another indicator that we may be nearing a contractionary phase: our economic recovery has been accompanied by a sharp pullback in industrial production after a steep drop during the recent Great Recession, but it is still below the late 2007 to early 2008 peak (see Figure 6.22). Company profits may be at record highs, but the country's industrial production and manufacturing are still about 10 percent lower than they were a few years ago.
Originally published October 19, 2011: “Are ETFs To Blame For Overspeculation, Record-Correlations, and a Potential Crash?,” Seeking Alpha.6
ETFs are huge enablers for soaring stock and commodity prices. And like their mutual fund predecessors, ETFs may have encouraged mass overspeculation that will ultimately result in a stock-market crash.
ETF investing continues to be a top choice for diversification, targeted exposure, and specific strategies; but ETFs have caused such mass speculation and have inflated prices to such an extent, that their intended benefits may actually be void and nullified by the tremendous risks and unintended consequences that they have posed. ETFs have increased speculation, massively inflated stock and commodity prices, and may be responsible for the unprecedented and hugely risky correlations across all stocks, sectors, and markets.
ETF Overview
Exchange traded funds (ETFs) are a revolutionary financial innovation, and provide many benefits for both individuals and institutions. Bought and sold much like stocks, ETFs are listed on exchanges and can be traded throughout the day. Like mutual funds, ETFs aim at providing diversification and exposure to a wider range of individual stocks or assets. Unlike mutual funds, however, ETFs can be traded all day, since their prices are instantaneously adjusted. Moreover, ETFs are cheaper and easier to invest in than mutual funds.
ETF Uses
ETFs represent a portfolio of individual stocks, and provide an enormous number of uses—from tracking broad stock indices (like the S&P 500 [SPY] or Russell 2000 [IWM], for example), to investing in specific themes or sectors (like technology [XLK], financials [XLF], housing [XHB]), to providing exposure to emerging markets and individual countries (emerging markets [EEM], China [FXI], Brazil [EWZ], etc.), to currency investment (U.S. dollar [UUP]), euro (FXE)), to volatility (VXX), to commodities (Oil [OIL], gold [GLD], natural gas [GAZ]), to bonds (TLT, TBT), and even to actively managed trading strategies. In other words, ETFs are exceptional tools for individuals and institutions to invest in commodities, sectors, countries, bonds, currencies, strategies, and just about any investment theme imaginable. ETFs provide a way for the average person to invest in a wide basket of stocks that he otherwise would not be able to.
ETFs offer many uses for portfolio strategy and asset allocation, including risk management and exposure to a wide range of markets and asset classes. They also provide a slew of reasons why investors should use them as part of their investment approach, including transparency, liquidity, diversification, and cost effectiveness.
ETF Industry
With so many innovative uses and benefits, it is no surprise that ETFs have grown at such a rapid and perhaps unprecedented pace. By May 2011, there were 2,747 ETFs offered by 142 ETF providers and traded on 49 exchanges—adding up to $1.446 trillion in assets! There were also plans to launch an additional 1,022 ETFs.8 With such a huge number of ETFs being traded, there is no doubt that ETFs have revolutionized stock market trading—the question now, however, is “How have ETFs affected markets?”
Massive ETF Growth
Since their introduction, ETFs have grown tremendously, from $0.8 billion in 1993 to nearly $1.5 trillion by May 2011 (see Figure 6.23). ETFs' popularity has soared largely because institutions have embraced them (see Figure 6.24). ETFs have also made it much easier and more accessible for individuals and institutions to invest in commodities (see Figure 6.25).
Figure 6.23 Global ETF and ETP Asset Growth Note: Data as of May 2011.
Source: Global ETF Research and Implementation Strategy Team, BlackRock, Bloomberg.
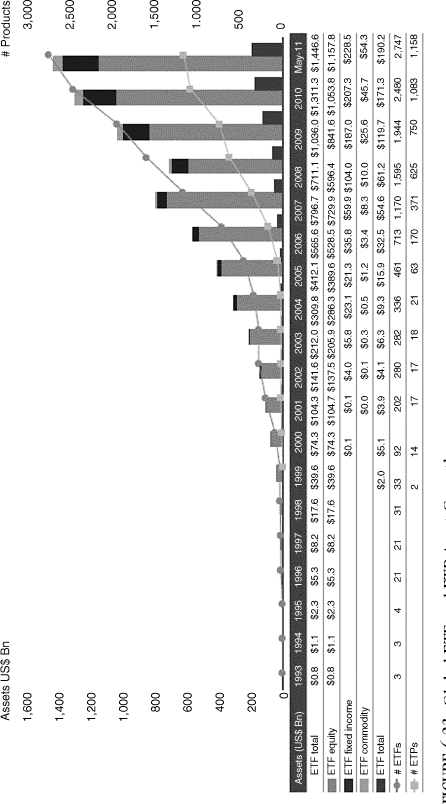
Figure 6.24 Growth in Institutional Users of ETFs
Source: Global ETF Research and Implementation Strategy Team, BlackRock, Bloomberg.
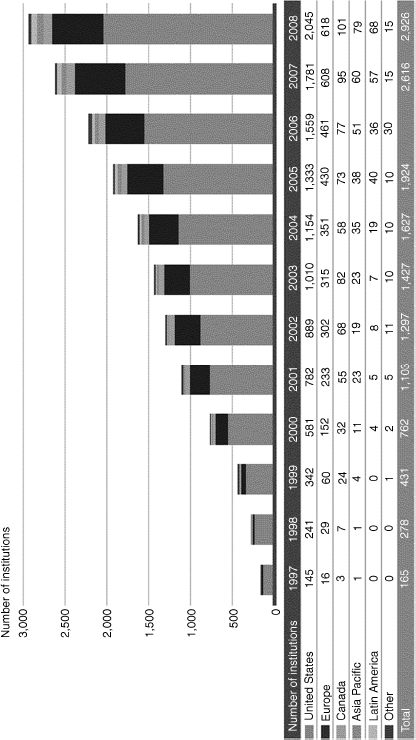
Figure 6.25 Global Commodity ETF and ETP Asset Growth Note: Data as of May 2011.
Source: Global ETF Research and Implementation Strategy Team, BlackRock, Bloomberg.
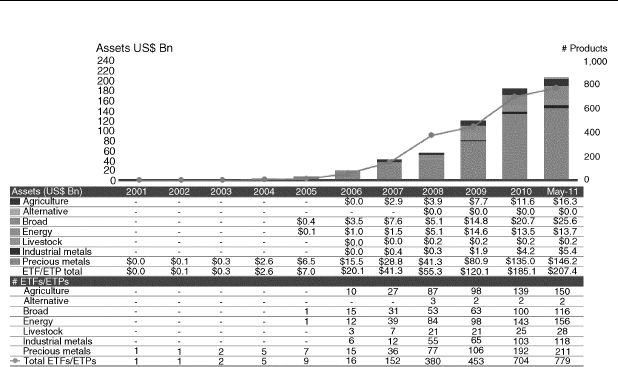
Prior to ETFs, investment in commodities such as oil, gold, grains, and others was limited to commodity traders, futures, or buying the physical commodities themselves. ETFs have provided a means for the common investor to buy these commodities from the comfort of his or her home, without any expertise or knowledge of the underlying asset. To make matters worse, the availability of these ETFs and the constant touting by the institutions that sell them, has greatly increased speculation in commodities and tremendously inflated prices. It is easy to understand why we've seen such massive rises in commodity prices over the past few years—investors have poured billions of dollars into commodity ETFs in order to profit from the shortage they expect, as China and emerging markets demand more and more commodities and raw materials for their growing economies. The major problem, however, is that it has become extremely hard to track exactly how much of this commodity price surge is due to real demand—as opposed to the inflated demand that ETFs have caused. In other words, commodity prices could be severely out of whack with reality and way beyond where they should be.
ETFs may have offered tremendous benefits when they were introduced, and still continue to offer investors a way to pick specific sectors, themes, individual commodities, and so forth, but we are at a point where ETFs may have created such investor frenzy and overinvestment, that current prices for stocks and commodities may be highly overextended—and set for a sharp pullback.
Mutual Funds versus ETFs
ETFs have essentially made mutual funds obsolete. For decades, mutual funds were the number-one way for investors to diversify and gain exposure to specific strategies and professional money managers. The introduction of the ETF, however, has made it easier, cheaper, and more effective to invest. Mutual funds have therefore seen large outflows over the past decade, as investors who were disillusioned by terrible mutual fund performance have pulled out their money. Investors simply have no good reason to keep their money in mutual funds when so many funds actually underperform and fail to beat the market while still charging high management fees. ETFs are cheaper, easier to buy and sell, and allow investors to bet on whatever they choose.
In the dot-com bubble era, stocks rose to extreme levels because investors were piling into technology stocks and, most important, mutual funds. Mutual funds were seeing huge inflows of new investors, and the money that came into these “diversified money managers” was then being invested into the stock market—sending stock prices even higher.
Eventually, after millions of investors piled their money into these mutual funds and the stock market in general, the dot-com bubble collapsed, the stock market fell, and mutual funds lost their investors billions of dollars. Average investors, professionals, people with retirement accounts like 401(k)s or IRAs, and others lost a large chunk of their investment value.
Mutual funds are essentially an investment fund led by one or more portfolio managers. These managers accept investments, trying to invest the funds appropriately in order to make their investors a profit. Most funds, however, charge a management fee just for investing. Even if the fund does not gain for the year, the manager may still get paid for managing the investors' money. The investor is actually worse off in the mutual fund than if he owned a stock of the broader market. In other words, the fund manager did worse than the overall market, when he was actually hired by the investor to beat the market.
It is no surprise, then, that mutual funds lost a lot of their appeal when the tech bubble burst and when NASDAQ and stock markets fell during 2000 to 2002. A new financial instrument was about to launch into mass popularity—the ETF. Since so many mutual fund managers couldn't beat the market, why should investors keep their money invested there? If investors just bet on the overall market they could've beat the mutual fund's returns. Yet there were few if any ways for investors to invest in the broad markets; investors would have to buy a very wide selection of stocks that represented the whole market, and track each of those positions to closely monitor the portfolio allocations. The average, and even the professional, trader simply doesn't have the means to buy so many stocks and monitor them closely. Yet diversified exposure to the overall market was still available mainly through mutual funds.
The innovation of ETFs, however, largely cuts out the middle man (portfolio manager), lowers fees, and allows investors to invest in broad themes and overall stock indices that track markets. In other words, if the mutual funds were failing to beat the market, why not just bet on the market? ETFs were invented to very closely track the overall markets or sectors by buying a proportional share of stocks to mirror an index or sector. Investors now had an investment vehicle that was pretty much automated, cutting out the costly middle man and eliminating poor investment choices. Instead, investors could now just “buy the market” and expect the 8 percent return that the market averaged per year, going back 60 or more years.
Irrational Exuberance in ETFs?
ETFs are undoubtedly an amazing innovation in investing, but may have also helped create overspeculation and unwarranted price increases in the underlying stocks and commodities. By offering an easy, cost-effective, and highly intriguing way of investing, ETFs have created the illusion that investing is less risky than it really is. ETFs have also massively boosted stock and commodity prices, as investors who were once not able to invest in certain stocks or commodities now bid up the prices of the underlying stocks and commodities by buying ETFs.
ETFs are huge enablers for soaring stock and commodity prices. And like their mutual fund predecessors, ETFs may have encouraged mass overspeculation that will ultimately result in a stock market crash.
In his award-winning and best-selling book Irrational Exuberance, Robert Shiller warned of massive stock market and housing bubbles. In the book, he points to a number of precipitating factors that have allowed stocks to become so dramatically overvalued. One of them was the growth of mutual funds. Unfortunately for us, the points Shiller made regarding mutual funds can easily be applied to ETFs. In other words, mutual funds caused the stock market overvaluation in the late 1990s, and ETFs may have caused the stock and commodity overvaluation over the past few years. If the similarities are a sign, we may be setting up for a sharp drop in stocks and commodities.
Referring to mutual funds, Shiller says:
Another reason for the funds' explosive growth is that they have paid for a great deal of advertising. Television shows, magazines, and newspapers frequently carry advertisements for them, and active investors receive unsolicited ads in the mail. Mutual funds encourage more naïve investors to participate in the market, by leading them to think that experts managing the funds will steer them away from pitfalls.9
Just like mutual funds, ETFs have grown so rapidly largely due to constant advertising on TV, magazines, newspapers, and the Internet. And just like mutual funds, ETFs encourage more naive investors to participate in the market by leading them to think that the “diversification” offered by these ETFs will steer them away from losses.
The proliferation of equity mutual funds has therefore focused public attention on the market, with the effect of encouraging speculative price movements in stock market aggregates, rather than in individual stocks.10
Somewhat different, but very much the same, ETFs appear to be offering “diversification” by investing in a wide range of stocks. However, this so-called “diversification” actually inflates the prices of a wide number of individual stocks—some of which may not be worthy of the investment. For example, an investor may choose an ETF that tracks “technology stocks.” His total investment is then divided among a number of different stocks that aim to represent “technology.” However, while the investor was aiming to gain exposure to technology stocks, he did not choose the individual stocks that made up the portfolio—some of his investment may have been invested in a “technology” stock that has no merit; in other words, some companies in an ETF are benefiting from a broader theme (like technology) when they aren't necessarily good investments.
Take “cloud computing” as an example. The cloud ETF (SKYY) was introduced for investors who would like to invest in cloud computing. Investors who wanted to capitalize on the popular theme would then buy SKYY. The money invested would then be allocated among a number of different individual stocks representing “cloud computing.” An investor would therefore expect the money invested to be allocated among strong cloud-related companies like Salesforce.com (CRM), F5 Networks (FFIV), and Amazon (AMZN). However, looking at the list of SKYY's holdings (Table 6.1), we can see how ETFs tremendously overinflate the prices of companies that don't deserve the investment.
Table 6.1 Top 10 Cloud ETF (SKYY) Holdings (Ranked by Market Cap)
Source: Richard Bloch, “SKYY: What's in the Cloud? Smaller Stocks That Pack a Lot of Punch,” July 7, 2011.11
| Company | Symbol | Weighting |
| Apple | APPL | 2.46% |
| Microsoft | MSFT | 2.55% |
| International Business Machines | IBM | 2.51% |
| GOOG | 3.27% | |
| Oracle | ORCL | 3.35% |
| Amazon.com | AMZN | 3.61% |
| Cisco Systems | CSCO | 3.23% |
| Hewlett-Packard | HPQ | 2.36% |
| SAP AG (ADR) | SAP | 3.18% |
| EMC Corporation | EMC | 3.32% |
| VMware | VMW | 3.49% |
| Wipro Ltd. (ADR) | WIT) | 0.78% |
| Salesforce.com | CRM | 3.50% |
| NetApp | NTAP | 3.42% |
| Juniper Networks | JNPR | 3.21% |
| Adobe Systems | ADBE | 0.80% |
| Netflix | NFLX | 3.53% |
| Check Point Software | CHKP | 0.87% |
| CA Inc. | CA | 0.86% |
| Teradata Corporation | TDC | 3.65% |
| BMC Software | BMC | 0.85% |
| F5 Networks | FFIV | 3.45% |
| Iron Mountain | IRM | 0.88% |
| Informatica | INFA | 3.53% |
| Rackspace Hostin | RAX | 3.52% |
| Akamai Technologies | AKAM | 3.35% |
| Polycom | PLCM | 0.92% |
| TIBCO Software | TIBX | 3.81% |
| Equinix | EQIX | 3.36% |
| Acme Packet | APKT | 3.42% |
| Open Text Corp | OTEX | 3.54% |
| Aruba Networks | ARUN | 3.71% |
| SuccessFactors | SFSF | 0.79% |
| SAVVIS | SVVS | 0.81% |
| Blackboard | BBBB | 3.47% |
| j2 Global Communications | JCOM | 0.83% |
| Financial Engines | FNGN | 0.90% |
| Rightnow Technologies | RNOW | 3.33% |
| OPNET Technologies | OPNT | 0.87% |
| NetScout Systems | NTCT | 0.70% |
The following are the best examples of ETF flaws: Why should Apple (AAPL) make up 2.46 percent of the ETF when Apple barely has any cloud exposure? Apple just introduced iCloud; when SKYY came out, Apple had almost no cloud capabilities. Then, Netflix (NFLX) is a media-based company and definitely not cloud-centric; even if Netflix did offer investors decent exposure to “cloud computing,” giving the stock a massive 3.53 percent weighting (more than the actual cloud companies like CRM or FFIV) is completely insane. Netflix (NFLX) and Apple (AAPL) are benefiting from the “cloud computing” theme when they don't really deserve it. ETFs therefore cause price increases in stocks that should not be taking place.
Another example is the homebuilders ETF (XHB). Investors buying XHB should expect to gain exposure to “homebuilders” like PulteGroup (PHM), Toll Brothers (TOL), DR Horton (DHI), and Lennar (LEN). However, looking at XHB's holdings (see Table 6.2), we can see that some of its biggest holdings aren't even homebuilding stocks! Instead, companies like Aaron's (AAN) and Tempur-pedic (TPX)—which sell electronics and mattresses—are allocated over 4 percent each. AAN and TPX are part of the portfolio since increased homebuilding will likely result in more buying of electronics and mattresses; but their correlation to homebuilding in no way justifies 4 percent allocations! While companies like AAN and TPX gain so much, the companies that really should be getting that investment (the actual homebuilders) are being ignored.
Table 6.2 Top 10 Holdings, Homebuilders ETF (XHB)—42.74 Percent of Total Assets.
Source: Yahoo! Finance.
| Company | Symbol | % Assets |
| Aaron's, Inc. Common Stock | AAN | 4.65 |
| Sherwin-Williams Company (The) | SHW | 4.56 |
| PulteGroup, Inc. Common Stock | PHM | 4.34 |
| Aaron's, Inc. Common Stock | AAN | 4.30 |
| A.O. Smith Corporation Common Stock | AOS | 4.24 |
| Simpson Manufacturing Company | SSD | 4.22 |
| Armstrong World Industries Inc. | AWI | 4.20 |
| Tempur-pedic International Inc. | TPX | 4.12 |
| Masco Corporation Common Stock | MAS | 4.07 |
| D.R. Horton, Inc. Common Stock | DHI | 4.04 |
Since ETFs aim to diversify within either the broad market or specific sectors, they push stock prices up with little regard sometimes as to whether all of these individual companies deserve the investment. In other words, ETFs also “encourage speculative price movements in stock market aggregates, rather than in individual stocks.” Yes, it is also true that ETFs allow for diversification by selecting specific sectors within the broad market; but, at the same time, even the sector-targeted ETFs are allocating the total investment capital among a number of individual stocks, some of which may not be individually worthy of the investment. It may just be much healthier for the market if investors chose individual stocks rather than trying to profit from a broader theme by investing through ETFs.
The emerging popular concept that mutual fund investing is sound, convenient, and safe has encouraged many investors who were once afraid of the market to want to enter it, thereby contributing to an upward thrust in the market.12
Likewise, ETFs with their “diversification” and “protection” benefits encouraged many investors who were afraid of investing in stocks to enter the market again, and also increased the downside risks by inflating prices and “contributing to an upward thrust in the market.”
This huge speculative growth in investment cannot be sustained forever. Eventually, stock prices must drop to accurately reflect economic conditions and future growth—not the extremely high expectations that investors have about the future. Recessions occur, growth cannot grow exponentially forever, and stock prices must fall to clean up some of the speculative excesses that these investment manias produce.
ETFs are a great innovative tool that allows individuals and fund managers to invest in a wide range of stocks while also making the process easier and more efficient; but ETFs have created so much speculation and unwarranted investment that they may be serving a very similar role to the market as mutual funds served in the late 1990s—before the markets tanked. ETFs have made it easier, but also tremendously riskier; their intended benefits may actually be void and nullified by the tremendous risks and unintended consequences they have posed.
Are ETFs to Blame for High Correlations?
Both ETFs and the growth of a “global economy” and interconnected markets are causes of the tremendous risks involved. Technology has advanced so rapidly, and financial instruments and derivatives are increasing the speed of trading as well as decreasing the transparency of what exactly is invested in. Investment leverage has increased tremendously, and banks and investors sometimes don't even know exactly what their money is invested in.
ETFs have increased “aggregate stock price movements” in which stocks move together more than ever before. Unlike in the past, when markets still had some independence and did not move so parallel to every other market, markets today are highly affected by what goes on around the globe. If the stock market in Asia falls, the U.S. stock markets will likely fall as well, and vice versa. Nothing displays this tremendous and unprecedented interconnectedness between markets, better than the extremely high correlations of the past year, seen in Figure 6.26.
Figure 6.26 S&P 500 Member Correlation (Average Rolling 50-Day)
Source: Business Insider (August 2011), tickersense.
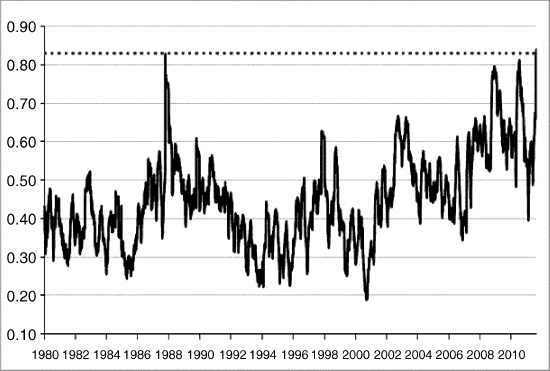
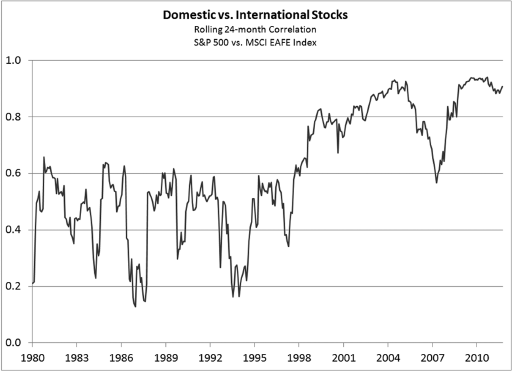
The buying of ETFs has caused stocks to move together, since investors and high-frequency-traders (HFTs) are buying and selling large groups of stocks simultaneously. By buying large groups of stocks through ETFs, investors have greatly increased the risks—if one part of the market falls, other sectors are likely to be affected as well. Correlations have reached a higher level than they did in 1987, before the massive stock market crash.
And while foreign stocks have historically provided diversification benefits to investors, the extreme correlations now present between stocks all over the world may completely cancel out those benefits (see Figure 6.27).
Conclusion
ETFs provide leverage, cost effectiveness, ease of investment, liquidity, and the ability to invest in a huge range of themes, markets, and sectors. But they also highly increase speculation in the broad markets (rather than just individual stocks); they inflate prices of all related companies, regardless of that company's real financial strength or weakness; and they present an “illusion of safety” when investors buy ETFs thinking they are getting “diversified” exposure with limited “market risk.”
It is time to watch our investments more closely, know exactly what our ETFs are invested in, and keep in mind that there has been an extraordinary amount of speculative money invested in all forms of ETFs. The stock market may have reached a peak, and an upcoming drop or recession can severely hurt investors as the value of their ETFs drops sharply.
Gold's massive rise has largely been fueled by the decade-long decline of the dollar and other currencies. Shaky economies and soaring debt have given fiat (paper) currencies the stigma of being highly risky and increasingly on the verge of becoming worthless as a measure of value.
With highly volatile markets over the past decade, and increasing fears regarding economic stability and future growth, it is no surprise that currencies have seen huge declines in relation to gold since the turn of the century (see Figure 6.28).
And with a strong negative correlation between gold and the dollar, we can expect the future of both asset classes to move, for the most part, in opposite directions (see Figure 6.29). In essence, the future of gold may be highly dependent on the strength or weakness of the U.S. dollar. While the dollar appears to be eternally doomed, the extreme despair and loss of hope for the dollar may be signaling a bottom and upcoming recovery. And that recovery in the dollar could be very bad news for gold.
Figure 6.29 Twenty Years of the U.S. Dollar and Gold
Sources: StockCharts.com, Seeking Alpha/Doug Short.

Dollar “Demise” Looks Overblown
Originally published April 26, 2011: “Dollar ‘Demise’ Looks Overblown: Betting on a Short-Term Bounce or Medium-Term Recovery,” Seeking Alpha.13
After plunging over 15 percent since June 2010, the U.S. dollar may be set for a short-term bounce if not a medium-term recovery.
With massive and extreme pessimism regarding the dollar and fiat currencies in general, driven by escalating fears over potential U.S. government debt defaults, soaring inflation, irresponsible money printing by the Fed, and the possible overthrow of the dollar as the global reserve currency, fears of the “demise of the dollar” may be overblown.
The dollar's strength or weakness has a much larger effect than many realize. It affects the stock market, bonds, commodity prices, debt levels, inflation, consumer confidence and behavior, foreign currencies, and even global policy. It is therefore crucial that investors, economists, analysts, politicians, and just about everyone else monitor the U.S. dollar's movement and potential effects on markets, economies, policies, gas and food prices, standards of living, and numerous other factors.
Negative versus Positive Views on the Dollar
The negative outlook for the dollar has plenty of strong fundamental reasons as support, particularly these five.
1. U.S. government debt is massive, leading Standard & Poor's to downgrade U.S. debt.
2. A downgrade of U.S. credit from its top-notch AAA rating by Standard & Poor's could trigger massive selling of U.S. dollars by countries worldwide, as well as a huge hit for the United States as it loses its first-class financial-strength status.
3. No end can be seen to U.S. dollar devaluation due to massive money printing by the Fed. As long as the Fed continues to print money, the dollar is expected to continue to drop. And since no clear sign has been given regarding the end of money printing, the dollar could drop more.
4. Rising inflation, seen in commodity and food prices yet largely ignored by the Fed, will further devalue the dollar.
5. The end of the dollar as world reserve currency could take place if the above-mentioned possibilities materialize. The end of the dollar as a “safe-haven” could quickly cause the dollar to plummet as world economies move out of the U.S. dollar to diversify their reserves. One large source of potential trouble: China holds between 65 and 75 percent of its reserves in U.S. dollars; a lowered rating or simply the decision to diversify could severely hurt the dollar.
The positive outlook for the dollar is largely based on extreme pessimism and overblown fears, as illustrated in these five possibilities.
1. Bad news and inflation fears already priced in? With nearly everyone believing the dollar is hopeless, and even running to hard assets such as gold or silver to protect themselves from a dollar collapse, the big drop in the dollar may have already taken place. If much of the bad news is already factored into the price, the dollar may be near a bottom.
2. The end of QE2 and effective Quantitative Easing will strengthen the dollar, as the Fed ceases to buy treasuries and dollar devaluation ends.
3. Tighter monetary policy in response to soaring energy and commodity prices will ease inflationary concerns and, in turn, strengthen the dollar. The Fed has already shown some signs of future rate hikes, which would bring an end to the easy monetary policy that has severely weakened the dollar.
4. Increased dollar buying by countries in an attempt to slow down their own currency appreciation could strengthen the dollar. As a number of currencies have seen tremendous appreciation while the dollar has fallen, some countries are finding their strong currencies to be detrimental to trade and future growth. By buying the U.S. dollar then, some countries could attempt to slow down their own currencies.
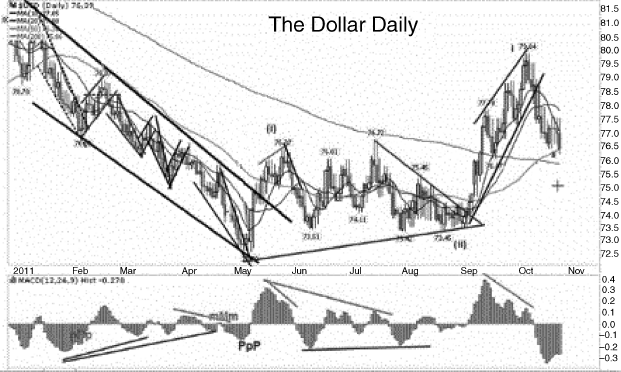
5. Chart technicals are showing a potential upcoming bounce or reversal.
Looking at Figure 6.30, a long-term chart of the U.S. dollar dating back to 2001, we can see the big drop. Yet even though the dollar has dropped significantly over the past 10 years, it may be heading for an explosive breakout to the upside. The chart above shows that while the dollar has dropped, the MACD has been rising—a positive divergence while the dollar is in a downtrend could signal a reversal. In other words, the drop has occurred on increasingly contradictory momentum and the dollar may start to rise.
Moreover, while gold has soared and while dollar-bears have been calling for the collapse of the dollar, the dollar has not made a new low since 2008! If we just listen to commentary or news, we would think the dollar is the worst it's ever been; but the dollar is still above the 2008 lows and may actually be in the midst of a recovery.
Dollar Comeback Marks Gold's Demise
Not only has the dollar failed to make new lows since 2008 (which should quell some of the “dollar demise” arguments), but it appears that the very strong recent surge in the dollar signals the beginning of a new uptrend for the currency and a renewed downtrend for stocks and commodities.
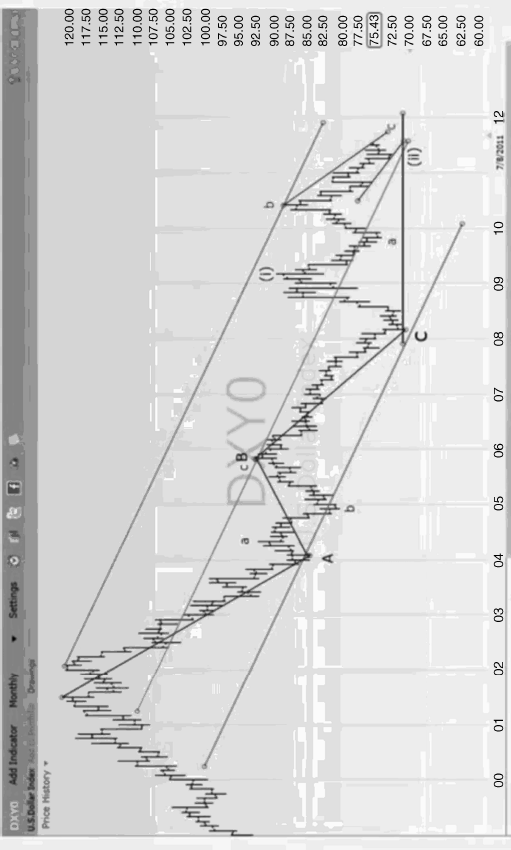
According to two Elliott Wave views of the dollar (see Figures 6.31 and 6.32), we may be setting up for a sharp dollar rally very soon. In fact, since we have not made new lows in the dollar index since early 2008, the 2008 low may be the long-term bottom. Unless we see new lows below the 2008 lows, the dollar's gyrations since the early 2009 highs may have just been a correction before the next (and larger) leg up. And the dollar strength will prove to be highly jeopardizing for the gold theme.
Perhaps one of the biggest determinants of the future direction of the stock market, commodities, and emerging markets, the U.S. dollar's comeback points to a deflationary period generally accompanied by falling stock prices and recessions. The majority of the world has been extremely negative on the future of the U.S. dollar, with many even calling for the dollar's collapse. Understandably so, the dollar has been so greatly devalued due to excessive money-printing by the U.S. government that it has been hard to argue for the dollar. This, in turn, has fueled the massive rally in stocks, commodities, gold, and foreign currencies, as the falling dollar was seen as a sign of mounting inflationary pressures that would justify rising prices in just about every asset class.
However, as we warned in late April 2011, the dollar's “demise” is overblown. Instead, the extreme pessimism over the dollar, the slowdown in emerging markets, and the deflationary period that will accompany the upcoming recession all point to a dollar recovery. Rather than a period of soaring inflation and dollar collapse, we continue to expect global economic slowdown and a dollar recovery. The U.S. economy and the dollar are still not healthy in almost all cases, but the relative strength of the United States and the dollar over the now-struggling emerging markets and foreign currencies (Euro included) will help the dollar outperform, signaling deflation and falling stock and commodity prices.
The collapse of the emerging markets, especially China, India, and Brazil, will have a huge ripple effect on the rest of the world's economies, and will plunge most countries back into a global recession.
One of the major drivers of the markets over the past two years has been the “unstoppable” and highly promising future of the emerging markets—especially China. As millions of inhabitants in emerging countries begin to enter the developed world and middle class, their consumption habits and their effect on the economies of countries all over the globe increases. And as millions of people contribute to the growth of China, India, and other countries, they will require extra food, energy sources such as gasoline and oil, cotton for their increased consumption and clothing needs, industrial metals for their new cars and technology, and many other materials that a growing and evolving population needs.
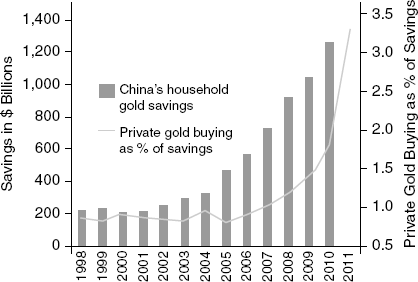
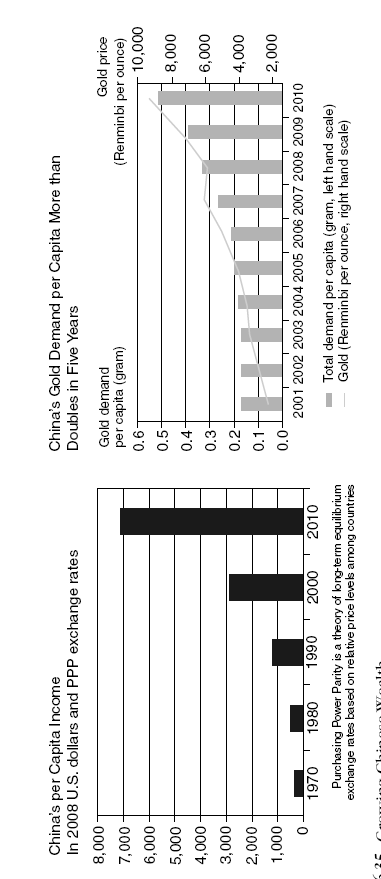
China's massive growth has also fueled the gold bubble, seen in Figure 6.33. According to the data presented below, Chinese demand for gold has grown tremendously as the wealth of its citizens has dramatically increased (Figures 6.34 and 6.35).
Figure 6.33 China's Gold Demand Overtakes Developed World Note: Demand includes gold jewelry and bar and coin demand only.*Developed West includes the United States, France, Germany, Italy, Switzerland, United Kingdom, and other Europe.
Source: GFMS World Gold Council.15

The problem that may emerge, however, is that there is no guarantee that China and other emerging countries will actually meet our lofty expectations. Emerging markets have been growing at such a rapid pace (7 to 10 percent or higher compared to 1 to 3 percent for the United States) that their development may have set them up for housing bubbles, high inflation, and uncontrollable growth.
Moreover, with all the enthusiasm over the future growth of emerging markets, investors have piled into stocks and ETFs in hopes of capitalizing on the emerging markets theme. The reasoning behind these moves is that worldwide consumption of food, commodities, and energy will continue as growing and developing populations require more supply. And with more and more people expected to consume at an increasing rate, investors assume food and commodity prices will continue to rise.
Therefore, in order to profit from the expected continued growth in emerging markets, investors have thrown billions of dollars into emerging markets (EEM) such as China (FXI), India (EPI), Brazil (EWZ), and others; grains and agriculture (JJG, DBA, DAG, MOO, AGF); steel (SLX), copper (JJC), silver (SLV, SIL), tin (JJT), and other industrial metals; energy (OIL, USO, OIH, XLE); and just about anything else that could rise if global economies continue to expand.
The problem—and it's a major one—with this emerging markets theme that has dominated for the past two years is that all the expectations and projections investors have had may be way too optimistic. With China and others showing very troubling weakness and attempting to slow their growth in order to prevent economic turmoil, a huge economic dip is not out of the question. Add to that the possibility that all the growth is already factored into the commodity and stock prices (that investors have speculated tremendously in all EEM-related themes and that current prices reflect future expectations), and any stumble or slower growth could send prices plummeting as they attempt to adjust to more realistic growth.
In simple terms, here are the four stages of emerging market growth that many investors have been relying on:
1. Emerging markets are expected to grow at a rapid pace for the next 50 years.
2. Rapid growth will require more supplies and more inputs.
3. As demand grows for food, commodities, and energy, the prices of these inputs will continue to rise.
4. The plan: Buy and invest in emerging markets and commodities in order to take advantage of this continued growth.
And here are the possible four stages that derail economic recovery and hurt emerging markets investors:
1. Emerging markets have been set up with lofty expectations for growth that will not be achieved due to unsustainable commodity and food prices, as well as unsustainable growth rates.
2. The double-digit growth rates that many investors have been relying on do not actually materialize. More reasonable growth rates of 5 to 8 percent do.
3. Since prices have run up at such massive rates and steep angles, they must come back down to reflect the more reasonable growth rates that have surfaced.
4. Prices for emerging markets, commodities, food, and energy drop considerably in order to better reflect current conditions and revised future expectations.
In other words, unless emerging markets continue to grow as expected, economies will suffer and investors will see heavy losses as reality sets in and expectations are missed.
Emerging Market Warning Signs
The slowdown that has been surfacing in China, Brazil, and other emerging markets is visible on many fronts. The warning signs include the following:
 Surging inflation that threatens sustainable growth.
 Soaring money supply that fuels bubbles in stocks and real estate.
 Credit bubbles.
 Massive and understated loan exposure.
 Tightening monetary policy that could put the brakes on the economy.
 Inverted yield curves that usually appear before recessions.
 Real estate bubbles evident in ghost towns and empty malls.
 Overconfident buying at auctions.
 The infamous skyscraper indicator (see section further on in this chapter).
 Fraudulent companies that have attracted investment from around the world when they are nothing but “shell” companies with unproven financials.
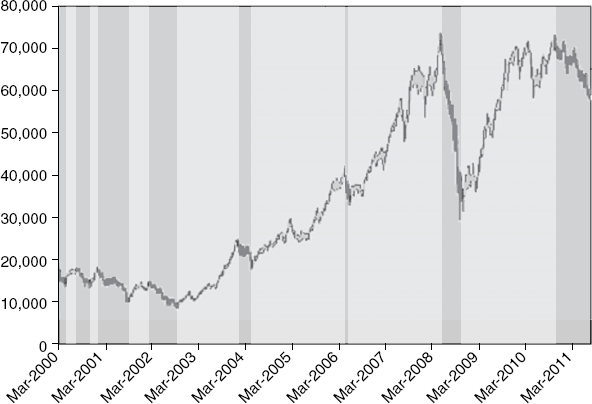
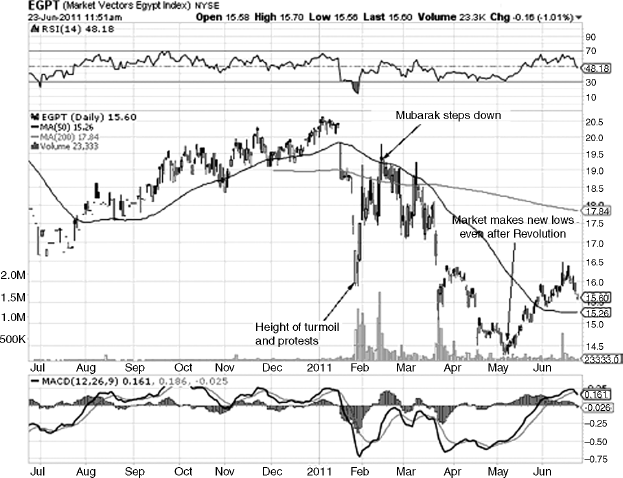
 Most important: The stock markets of China, Brazil, and others have been deep into bear-market territory in 2011—down between 20 and 30 percent from their peaks.
Surging Inflation
Many countries around the world are experiencing surging inflation that could threaten steady growth. With consumer prices rising significantly, especially due to the sharp rise in food and commodity prices, countries like China (6.4 percent annual inflation rate, June 2011) could have major problems. The price of pork, China's staple meat, soared 65 percent between July 2010 and July 2011.18 Though many countries have been attempting to cool the inflationary threats, consumer prices have continued to rise. And even if these countries can slow inflation, they may also be halting growth at the same time.
Money Supply
Speculative manias gather speed through expansion of money and credit.19
—Charles Kindleberger
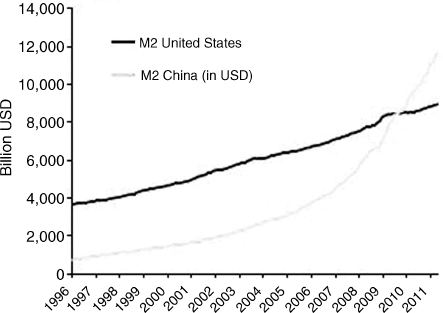
While most economists and investors have been arguing for the demise of the dollar and the death of paper currency due to government money-printing, many fail to notice that China's money supply has actually grown at a much more rapid pace than the United States' money supply (see Figure 6.36). With M2, a broad measure of money supply, rising 15.9 percent by June 2011,20 the rapid growth of money supply and the devaluing of Chinese currency have fueled asset bubbles in real estate, investments, and gold, and may be setting China up for a very sharp financial crisis as money supply shrinks and credit dries up.
Figure 6.36 M2 Money Supply United States versus M2 China (in U.S. Dollars)
Sources: Datastream, Erste Group Research.
Credit Bubbles
Foreign banks increased their lending to China by 86 percent in 2010.21 In addition, off-balance sheet loans have increased by 110 percent and tremendously raise the risk of bank defaults because these loans are not accounted for in the same way as traditional loans. It has been estimated that the value of off-balance sheet items for 16 Chinese banks is around $3.5 to $4 trillion, making up 25 percent of total assets.22 This highly increased leverage, much of which has been achieved through hidden activity and therefore results in understated credit exposure, could easily cause major problems for banks in the event of a credit downturn or liquidity crunch.23
Such massive credit growth is almost a guarantee of future asset bubbles, especially as China has been attempting to cool the overheating real estate market. And if economic growth slows, China's banks could be left with a toxic portfolio of nonperforming loans.
Economist Hyman Minsky developed a model to explain financial crises as a result of cyclical changes in the supply of credit. Minsky pointed out that the supply of credit increased during economic booms and decreased during economic slowdowns. During expansions, investors were increasingly more optimistic about the future and became more likely to borrow. Lenders were also more likely to lend, since the expansionary phase had increased their risk tolerance and also lowered their assessment of the underlying risk. Furthermore, Minsky argued that the increases in credit supply during booms and decreases during busts made financial crises much more likely.24
The emergence of countries like China, India, Brazil, and other modernizing areas has coincided with the sudden and rapid growth of credit. Developed markets have had access to credit for decades—from mortgages to credit cards to low down payments and many other forms of credit extension. Emerging markets and developing countries, however, had been on a cash-only basis until only 20 or 30 years ago. The development and availability of credit has allowed individuals within these emerging markets to increase spending and investment. This increased credit and spending leads to a “domino expansionary effect”25 in which the economy grows rapidly due to the large sudden increase in available credit. The growth of credit has an almost immediate positive impact as the expansion of business results in double-digit growth in many sectors of the economy.
Growth can only continue at this pace if credit continues to be available. As the credit expansion reaches a saturation point however, the unsustainable cycle of credit growth begins to weaken. Credit begins to dry up as lenders are less willing to lend, and as loans must be repaid. Individuals and businesses can no longer rely on more credit to fuel their existing loans and activities, and economic growth is hit with a sharp slowdown. The unavailability of credit sharply halts further expansion, and the economy may fall into recession as slow or negative growth takes hold. The massive credit and expansionary cycle can only be sustained through continuous credit growth; but credit can't grow forever, and economies inevitably must face contractions as growth comes to a halt.
In the case of China and other emerging countries, credit has grown so rapidly and has fueled such massive expansions, that the economic slowdown resulting from shrinking credit availability could be severe. The large asset bubbles in stocks and real estate that have been appearing in many emerging markets are the results of unsustainable credit expansion that will lead to economic shocks as a saturation point is reached and credit growth is no longer possible.
Loan Exposure
Moody's, the credit ratings agency, recently said that China has underestimated by half a trillion dollars its exposure of state-owned banks' to local government loans.26 China has also suspended more than 80 percent of its railroad construction projects due to safety concerns and high debt burdens. The Railway Ministry is facing over $300 billion in liabilities, bringing its liability-to-asset ratio up to 59 percent.27 Banks have stopped lending for railway construction, which stands as a stark warning of a looming liquidity crisis and credit crunch.
Tightening Monetary Policy
China's central bank has increased interest rates three times and its reserve requirement rate (RRR) for banks six times in 2011 by the end of July. Tighter monetary policy is an attempt to cool the rampant inflation that has been threatening to spiral out of control. While inflation is generally a sign of growth, very high inflation could be damaging to the economy as prices begin to hurt companies and consumers. Tighter monetary policy has therefore been a method of controlling unwanted inflation. However, while stricter policies that limit easy money and easy credit are necessary to prevent rampant inflation, they can also slow growth considerably as they dry up credit and put the brakes on economic expansion. In fact, tighter policy is many times such a shock to the economy that it can send it into recession as rapid growth turns to contraction. Tighter policies are an attempt to slow the economy in a controlled fashion in order to achieve a “soft landing” (instead of a sudden collapse); however, tightening policies also slow down the “liquidity pump” that has been fueling the massive growth leading up to that point. In short, tighter policy is necessary to prevent the unwanted and dangerous inflation that usually leads to asset bubbles, but many times also ends up halting economic growth and severely hurting markets.
China's attempt to cool inflation through tighter monetary policy may dry up the massive credit bubble that has allowed the country to grow at such a rapid pace. The dominos may then begin to fall, as high inflation leads to tighter monetary policy to slower growth to investors fleeing, and to the Chinese economic collapse contagion.
Inverted Yield Curves
Normally seen before recessions, inverted yield curves have surfaced in Brazil and India. The inversion of yield curves takes place when short-term rates rise above longer-term rates, signaling that investors will accept lower rates in the future—because they anticipate an economic downturn. Richard Bernstein, formerly a chief investment strategist at Merrill Lynch, pointed to the inverted yield curve as a sign that a “central bank has tightened too much.” Furthermore, “the most inverted yield curves are Greece, Ireland, Portugal, and then comes India and Brazil. There is your warning sign that no one is talking about.”28 With interest rates at over 12 percent in Brazil and India, tightening may really hurt the economy as it could sharply halt economic growth. Slowing the economy down by tightening halts growth, but tightening may be the only effective way of preventing future asset bubbles at this stage. Tightening makes credit harder to get, which severely slows expansion and can even act as a negative shock that sends the economy into recession as it returns to equilibrium.
Slowing Growth
Most economists, analysts, and investors expect China and many emerging markets to grow at a nearly double-digit pace. If China and other countries fail to meet expectations, however, markets could crash hard as investments and stocks adjust to new, and less optimistic, circumstances. In fact, a slowdown that leads to very negative reactions could be growth of even 7 percent!29 Moreover, China's Purchasing Managers' Index (PMI), which measures growth in manufacturing activities, fell below 50 in July 201130 —signaling a potential upcoming contraction. With the lowest reading in 28 months, the deceleration in China's industrial activities should be a severe warning of a broader economic slowdown. Additionally, China's customs bureau warned of “severe” challenges as export growth slowed to 17.1 percent in September 2011 from 24.5 percent in August 2011. Moreover, the trade surplus declined for the third straight month, falling from $31.5 billion in July 2011 to $14.5 billion by October 2011.31 Brazil has been even weaker, with four consecutive months of contraction in manufacturing, as PMI dropped to 45.5 in September 2011. If China and Brazil can't continue to grow at a rapid pace, while simultaneously controlling inflation, things could quickly spiral out of control.
Inflation Rate Outpacing Savings Rate
With inflation rates over 6 percent in China and other countries, having money deposited in savings accounts that pay approximately 3.5 percent is detrimental to the account holder. When inflation is higher than the return on savings, the money in the savings account is actually losing relative value over time; inflation makes money worth less, and the same amount deposited a year earlier has less purchasing power as time passes. Since households lose money by keeping it in the bank, individuals in these countries are either losing purchasing power as inflation outstrips their savings rate of return, or they are further adding fuel to the fire by investing their money into other assets that they hope will outperform inflation. And by investing their money into other assets, such as housing or stocks, they are further inflating the asset bubbles that are unlikely to be sustainable over the long term.
Soaring Investment
Investment as a share of gross domestic product (GDP) reached a record 46.2 percent in 2010.32 Even though the country may still be developing, having investment comprise nearly 50 percent of GDP is a huge sign of risk and unsustainable euphoria.
Real Estate Bubbles
As we recently experienced in the United States, many emerging markets will soon undergo massive real estate collapses when investors realize that housing prices cannot go up forever. With heavy investment from inhabitants and foreigners into emerging market real estate, asset bubbles have been almost inevitable. The claim has been that the massive population growth and increasing wealth will spur many to search for new homes and apartments. But with residential housing investment making up 9 percent of economic output (3.4 percent in 2003), a three-month unsold inventory of apartments (which means that supply has outgrown demand), and massive risk exposure to real estate by banks, the upcoming real estate fiasco could truly derail world economies.33 Even government officials and real estate executives have been warning of housing bubbles, especially in Hong Kong, where home prices have risen more than 70 percent since the start of 2009.34
Ghost towns are appearing, with one city equipped with museums, libraries, suburbs, and four-lane highways and built for 1.5 million people, but only housing approximately 20,000 people.35 It has been estimated that there are currently as many as 64 million empty homes in China.36 So, too, with the South China Mall in Dongguan (one of 500 malls built in China over the past five years37), which was built with the capacity for 1,500 tenants but has filled only 15 to 20 spots (a nearly 99 percent vacancy rate).38
Confirmation of a slowing real estate market on the verge of collapse continues to surface: China's big cities reported decreases in apartment sales in September and October 2011, with apartment sales in Beijing dropping 22.8 percent year over year during the week-long National Day holiday.39 With declining prices and sales during what are supposed to be the “boom months,” a real estate bubble is increasingly clear.
Overconfidence in Buying
One of the most natural ways to find overconfidence in the market is to look for world record prices, or any type of world record set from an asset perspective. That is usually a sign of national hubris and overconfidence being manifested in the form of buying behavior.40
—Vikram Mansharamani
Chinese overconfidence and extreme speculation is evident in the record-setting bidding at art auctions (a Picasso purchased for $110 million), the growing market in expensive wines, a dog that was sold for over $1 million, the world's most expensive racing pigeon, and “mutton fat jade”—once used to fill bags to hold back flooding rivers—now selling for more than twice the price of gold!41
Skyscraper Indicator
The speculative and arrogant behavior inherent in massive skyscraper construction may be distinct proof that the investment mania and period of rapid growth is nearing its end.
As Vikram Mansharamani, Yale lecturer and author on financial booms and busts, points out, the construction of record-setting skyscrapers is a major indicator of speculative excess and a warning of impending economic slowdown. He points to New York in 1929, where three sites competed for the status of world's tallest building—40 Wall Street, the Chrysler Building, and the Empire State Building—right before the Great Depression; to the early 1970s, with the construction of the World Trade Center and the Sears Tower, followed by a decade of stagflation; to 1997, with the completion of the Petronas Towers in Malaysia right before the currency crisis of Southeast Asia; to 1999, with the beginning of construction on Taipei 101, at the height of the technology bubble; to 2007 to 2008, with the record-setting building of Burj Dubai at the height of the credit bubble; and now to China, where 5 out of 10 of the largest towers in the world are under construction.
Why does this indicator work? Because the world's tallest skyscraper under construction is usually a sign of, first, speculative excesses—remember they are built by developers not the people who plan to occupy them. Second, there is no economic reason to pursue world's tallest status—that's a simple manifestation of hubris and national overconfidence. And third, easy money—these things are never built with full equity financing—they're usually built relying heavily on other people's money.42
Fraudulent Companies
One of the characteristics of manias, especially in their final days, is that they are usually riddled with fraud . . .. The uncovering of such dishonesty adds fuel to the downward spiral in prices.43
—Martin Pring
A number of Chinese companies listed on U.S. and Canadian exchanges have been exposed for committing accounting fraud.44 It has been relatively easy for fraudulent companies to gain access to U.S. investors and list on foreign exchanges, since the massive euphoria regarding the Chinese economy has created the illusion that nearly all Chinese companies could be profitable. Just like the dot-com bubble in the late 1990s to 2000, investors have simply bought almost any company that has any connection to the profitable China theme. In 2000 it was any technology company, now it's any Chinese company. When investors begin to realize that much of their investment has been speculation, especially in fraudulent companies without proven financials or profits, the China theme may come to an end.
Unnoticed Falling Market
One of the biggest threats to global markets is the “invisible” and largely unnoticed declines in the stock markets of emerging markets in 2011. Most U.S. investors still base much of their investment decisions on the assumption that emerging markets are the future for growth, and they refuse to accept most negative news that may disprove the emerging markets thesis. In the meantime, however, emerging countries have seen their stock markets fall nearly 30 percent! Not only are these drops much greater than the U.S. stock market declines, but the larger failure of emerging markets over U.S. markets could be a very severe warning that the emerging market theme is over. Without emerging markets leading the way for global growth, most investors who based their investment decisions on continued rapid growth will no longer be able to justify their claims. Instead, the economic and financial turmoil that may ensue in countries like China and Brazil could derail the global market.
As seen in Figure 6.37, China's Shanghai Stock Exchange has not made new highs since August 2009! Brazil's Bovespa Index is now in a bear market45 following a drop of over 30 percent since November 2010 (see Figure 6.38).
The ongoing and largely unnoticed weakness in emerging markets is a huge threat to continued global growth. Emerging markets may have led the way into the 2009 to 2010 recovery, but they may also be leading us back into recession as their growth has spiraled out of control and as excess speculation has created asset bubbles across real estate and stocks. If China, Brazil, and other emerging markets continue to show weakness, global economies will likely enter a renewed recession. A renewed recession will not only result in falling stock prices, but will also take its toll on commodities as emerging market growth no longer supports the massive increases we've seen in commodity prices. And if commodity prices fall, they will likely drag gold down with them.
Problems continue in the Middle East, following upheavals in Egypt, Tunisia, Libya, Syria, Yemen, Algeria, Iraq, and a number of other countries. Citizens revolted over oppressive regimes, unfair treatment, poor economies, high costs of living, and other injustices.
We warned readers in January and June 2011 that all of the instability in the region was a sign of more trouble to come. A number of countries' citizens have attempted, or succeeded in, ousting leadership. Even if the political upheaval was to subside (which it hasn't), the economic effects would still materialize; the revolutions and protests have undoubtedly put a strain on the region's economy and will likely affect segments of the rest of the globe. The United States' and others' involvement in such matters will affect their own economies, as they attempt to stabilize the region, feel some trade disruption, and may engage in new wars.
Moreover, we warned in January 2011 that a housing bubble may have formed in Israel, and could affect the rest of the region. A housing bubble in Israel is not confined to Israel, and could affect other parts of the world as well. It may be the case that the United States' real estate bubble preceded bubbles in other parts of the world, and that the bursting of these other bubbles (in countries like China) will follow. Regardless of whether or not stability returns to the region, economic damage has been done that may trigger a worldwide crisis—especially with the addition of slowing emerging markets, a European banking crises, and economic contagion.
Egyptian Stock Market Bodes Poorly for Middle East
Originally published June 24, 2011: “Egyptian Stock Market Bodes Poorly for Middle East,” Seeking Alpha.46
Egyptian Revolution of January to February 2011.
As protesters were able to effectively oust President Hosni Mubarak from office following their strong campaign against police brutality, lack of free elections and freedom of speech, corruption, state of emergency laws, high unemployment, inflation and other economic issues—the market (as represented by the Egypt ETF [EGPT]) bounced back after sharply falling in January over the upheaval in the country.
Yet while the market bounced back a considerable amount following the successful overthrow of Mubarak, the market has actually dropped to new lows since then (see Figure 6.39). In other words, even though it seemed as if the majority of the problems in Egypt were solved, the market may be telling us that they are far from over. A poor economy stands as a very big hurdle for Egypt's future; and Egypt's revolution and economic future may highly affect surrounding countries in the Middle East region.
The Egyptian Revolution sparked protests in other Arab countries as well—Yemen, Jordan, Bahrain, Libya, and Syria. Protests may prove to be socially beneficial in the longer term, but can severely disrupt the economy in the short to medium term.
With Egypt's apparent market and economic weakness as of late—and especially since the market is actually lower today than it was at the height of the revolution—it appears that the Middle East and surrounding areas may see some increased weakness and potential for economic and social upheaval. The weakness in the area bodes poorly for those countries and, potentially, Middle-East-related stocks and markets.
Housing Bubble in Israel?
Originally published January 25, 2011: “Housing Bubble in Israel?,” Seeking Alpha.47
With housing prices soaring nearly 20 percent in 2010, as well as continued fears of an overheated and unsustainable housing market, Israel's central bank has raised interest rates a number of times in order to cool the frothy markets.
After cutting interest rates from 5.25 percent to a record low 0.5 percent over the past few years, Israel's housing market has seen rapid price acceleration that has made it difficult, and even impossible, for many of Israel's inhabitants to purchase homes. And the loose monetary policies that Israel has employed have made easy loans and speculative buying an all-too-common occurrence in recent times.
With three-bedroom homes in Tel Aviv selling for $600,000 while the average salaries of Israelis are nowhere near high enough to properly sustain such high-value mortgages, a bubble is increasingly likely. Just as we have seen in the U.S. housing bubble, easy loans and exorbitant housing prices are the crucial ingredients of a housing bubble; and these factors seem to be exactly what is occurring in the Israeli market.
Three warning signals in particular have already surfaced.
1. Interest rates have increased from 0.5 percent to 3.25 percent in an effort to cool the soaring housing prices and potential inflation troubles.
2. The Bank of Israel's governor, Stanley Fischer, has warned of an impending bubble, saying “Prices have risen over 20 percent in the past year, and if they continue to rise at this pace we will have a bubble.” These are not comforting words from the man in charge of controlling these scenarios.
3. The Bank of Israel issued stricter mortgage lending rules in June 2010, lowering the loan-to-value ratio from 70 to 60 percent—in effect requiring homebuyers to put more money down for their purchases than was previously required. This is a sign that loans have been too easy, and another sign of an overheated housing market with loan defaults on the horizon.
The combination of soaring home prices, loose monetary policies, easy loans, and speculative buying have made an Israeli housing bubble very likely.
With prices so far beyond reasonable in comparison to the average Israeli salary, it appears that a similar housing bubble to the one we have just experienced in the United States is underway. With the threat of hostilities in the region constantly on the horizon (which sent home prices down 11.6 percent in 2006 due to the war between Israel and Hezbollah) and the Bank of Israel's recent interest rate hikes to control inflation and cool the housing market, Israel's housing market may be in a bubble that is on the verge of deflating.
In fact, since the writing of “Housing Bubble in Israel?,” the Israel ETF (EIS) is down nearly 30 percent as of September 2011 (see Figure 6.40).
Perhaps one of the largest threats to the global economy, Europe's tremendous instability could ensure a global economic catastrophe. Similar to Lehman Brothers' role in triggering or exacerbating the financial meltdown of 2008, Greece's massive financial troubles may drag all of Europe into a domino-like economic collapse. Since many of the European countries are economically tied to each other through the Euro, the financial collapse of any Eurozone country could severely impact all the other countries. And with the Eurozone countries attempting to stop the contagion by bailing out the failing countries, they could be dragged into the financial mess themselves.
Greece is in no way the only problem. Italy, Spain, Portugal, Ireland, and others are all at huge risk of collapsing and dragging the rest of the world into their mess. Unemployment levels have reached over 20 percent in some countries, with youth unemployment nearly double that. The strongest countries, Germany and France, have been greatly impacted by the massive financial upheavals—having already entered bear markets, as their stock markets are down approximately 30 percent from their peaks. Europe's leaders, together with central banks, have attempted to fix these disastrous conditions; but unless the contagion can be contained and limited to Greece, we can expect financial meltdown in “snowball” fashion to ensue—as collapse and default spreads from country to country, dragging financially responsible countries like Germany into the mess created by Greece, Italy, Spain, and others.
Just take a look at the massive leverage taken on by European banks in Table 6.3 —more than twice that of American banks before the 2008 crisis.
Table 6.3 European Banking Crisis.
Source: http://hussmanfunds.com/wmc/wmc111017.htm.
| Bank | Leverage | Tangible Equity |
| Landesbank Berli | 53.04 | 1.43% |
| Dexia SA | 52.83 | 1.49% |
| Deutsche Bank-RG | 37.82 | 1.83% |
| Danske Bank A/S | 30.68 | 2.55% |
| Credit Agricole | 30.56 | 1.97% |
| ING GROEP-ADR | 26.37 | 3.36% |
| Commerzbank | 26.32 | 3.39% |
| UBS AG-REG | 25.40 | 3.19% |
| Barclays PLC | 23.93 | 3.60% |
| Nordea Bank AB | 23.67 | 3.67% |
| BNP Paribas | 23.33 | 3.59% |
| Credit Suiss-ADR | 22.86 | 3.51% |
| Soc Generale | 22.21 | 3.71% |
| Lloyds Banking | 21.14 | 4.17% |
| Royal BK Scotland | 18.91 | 4.29% |
| Fortis Banque | 17.75 | 5.61% |
Gold depends on more factors than most people realize. Not just limited to economic uncertainty or currency devaluation, the factors that affect gold prices include the stock market, the direction of the U.S. dollar, emerging market growth and demand, and global crises stemming out of the Middle East and Europe. Gold's massive rise over the past decade is attributable to growing fears over failing and stagnant stock markets, as well as the loss of faith in paper currencies. Ironically, however, gold's massive rise has also been heavily reliant on continued emerging market demand and rising commodity prices—factors that will not persist if a global recession develops. In other words, gold is expected to provide a “safe haven” in the event of economic catastrophe, but that will likely not be the case, as gold plummets together with other asset classes if a worldwide recession takes hold. Instead of benefiting from a falling dollar, continued emerging market growth, and an inverse correlation to stocks, gold is likely to collapse as the dollar makes a comeback, emerging countries lead the global economy into recession, and stock markets drag gold and other asset classes down. Exacerbated by Middle East upheaval and a European crisis, economic shocks will likely be felt across the globe, hurting stock markets and commodity prices as future growth expectations are not met. Gold is not immune to plunging asset prices. Gold's “safe haven” status is a myth.
Now that we have pointed out the signs of a gold bubble, the probability that gold is an unsafe haven, and the factors that are likely to contribute to the end of gold's massive bull market, it is time to look for the reversal signals confirming that a peak is rapidly approaching.
