Chapter 7
Calling the Top: Signs of Reversal
Spotting a bubble is not enough. In order to accurately predict a bubble and successfully profit from its collapse, it is tremendously important to anticipate when the peak will occur and not to risk too much until the coming collapse is confirmed. Betting against a bubble with extreme momentum behind it could wipe you out financially. It is therefore critical that claims of a bubble be confirmed with signs of an imminent top, and that those who wish to profit from the collapse of a bubble limit their risk until a peak is near certain.
A number of signs pointing to an imminent peak and upcoming reversal in gold have surfaced.
Lagging Mining Stocks Signal Reversals in Gold and Silver Prices
Originally published May 10, 2011: “Mining Stocks Signaling Reversals in Gold and Silver Prices,” Seeking Alpha.1
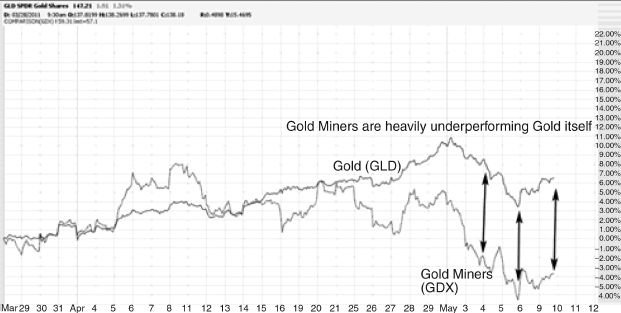
Gold prices have set considerable new highs since late 2010, but the gold miners continue to lag behind.
After dropping from the all-time-high price of $1,435.70 an ounce set in December 2010, gold has since broken out to new all-time-highs above $1,900 an ounce. Over the same time, however, the stocks of many gold miners and especially the broad gold miners ETFs (GDX and GDXJ) have not made new highs in the same fashion—and may be signaling an upcoming drop in gold.
Shares of companies related to the underlying commodity tend to move together with the commodity itself. Rising oil shares tend to accompany rising oil prices, rising gold miner shares tend to accompany rising gold prices, and so forth. Furthermore, the stocks of the related companies usually change direction before the commodity itself does. Therefore, when commodity-related companies start rising while the commodity has been falling, it is a good buying opportunity before the commodity itself turns up. On the flip side of that, as the related company shares start to drop while the commodity continues to rise, it is an early warning of a possible trend change. It can be said, therefore, that energy shares are a leading indicator for oil and that gold mining shares are a leading indicator for gold.
If, in fact, stocks tied to a certain commodity (like oil or gold in our case) do lead the underlying commodity itself, the direction of those stocks can serve as the leading indicator of the upcoming direction of the commodity. In our case, since the gold miners have been lagging behind gold itself, we may be seeing the beginning of the turn down in gold.
As shown in Figure 7.1, gold miners have been significantly lagging behind gold as of late.
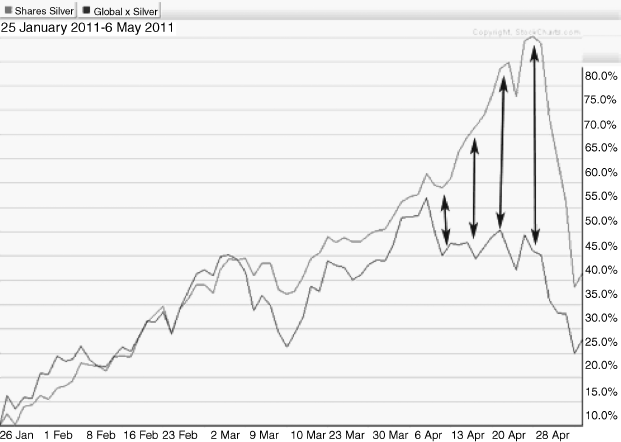
The same could be said for silver (SLV) and the silver miners (SIL). The divergence between the miners and silver itself (seen in Figure 7.2) could even have alerted investors to be wary of silver before the big drop from May to October 2011, in which silver prices fell nearly 50 percent. Silver (SLV), top line, Silver Miners (SIL), bottom line.
Time will tell if the recent divergences between gold (GLD) and the gold miners (GDX) and between silver (SLV) and the silver miners (SIL) were only warnings for the corrections we saw recently, or if they stand as stark warnings of a much greater upcoming reversal that could see the bursting of the precious metals bubble.
Gold versus Gold Miners
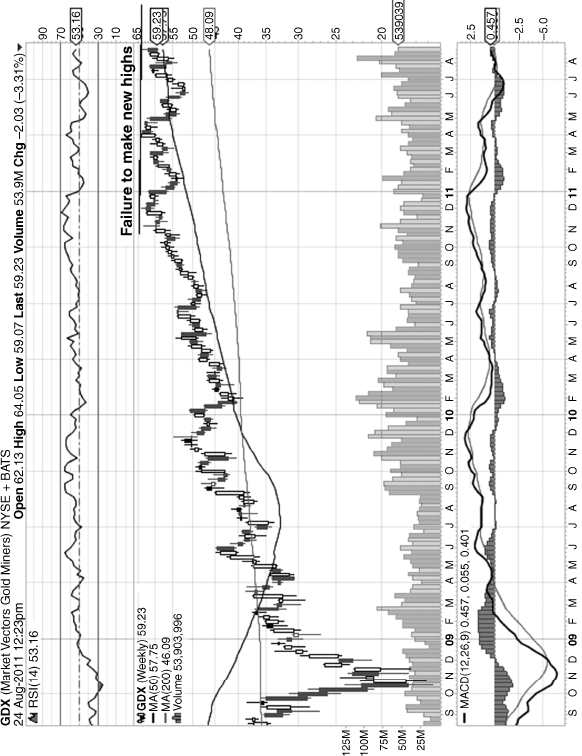
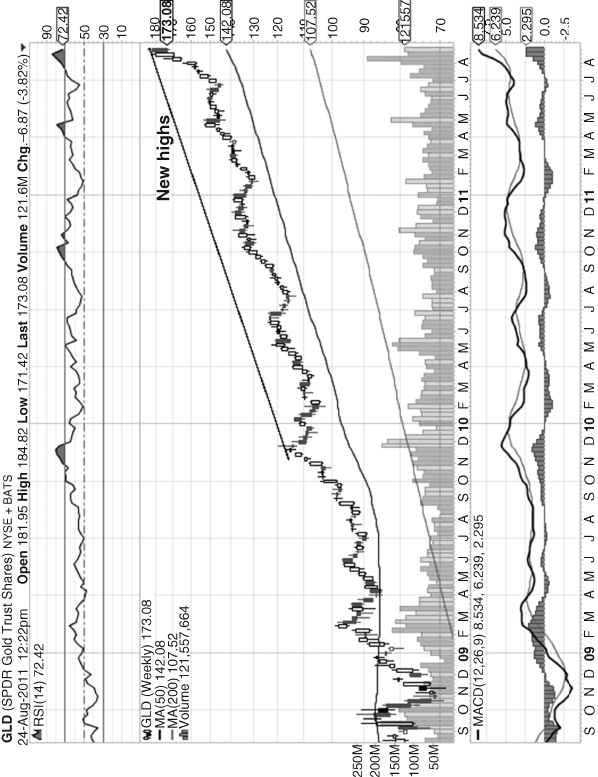
Compare the new highs in the Gold ETF (GLD) with the failure in the Gold Miners ETF (GDX), shown in Figure 7.3.
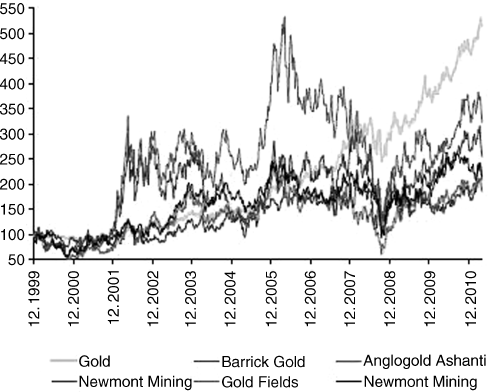
Gold has been outperforming the miners for much of the past four or more years (2006 to 2011), as Figure 7.4 shows.
Figure 7.4 Performance of Gold versus Performance of Major Gold Producers
Source: Datastream, Erste Group Research.
Gold/Gold Miners Ratio
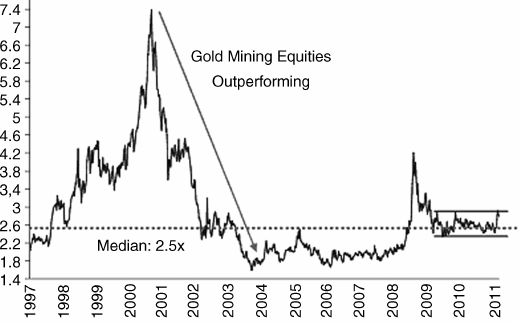
According to the ratio of gold to the miners,2 the miners outperformed from late 2000 until 2004, when gold began to outperform. With gold's summer 2011 rallies, it has likely broken out of the channel in Figure 7.5 and has continued its outperformance over the miners.
While gold has continued its run to over $1,900 an ounce from late 2010 until September 2011, the gold miners (GDX) have moved sideways over the same time period and have not held new highs since December 2010. The failure of the miners to make and hold considerable new highs is a major warning sign, especially when the lagging of the gold miners has lasted nearly a year. Gold may have continued to run up; but without confirmation by the gold miners, the gold theme may be nearing an end. These divergences in the gold miners should be given very close attention as a potential early warning.
Bernanke and Buffett “Puzzled by Gold Rally”3
The likelihood that investors and speculators would heed the warnings of a government official when asset prices are increasing at annual rates of 20 to 30 percent a year is not especially high.4
—Charles Kindleberger
Federal Reserve Chairman Ben Bernanke—the man in charge of the whole country's monetary policy, with the responsibility of maintaining a stable financial system and preventing panics—has admitted that he does not “fully understand movements in the gold price.”5 Generally, huge rallies in gold are interpreted as upcoming inflationary pressures, as investors buy gold as a hedge against inflation. But, as Bernanke pointed out, inflation is not being signaled by other asset classes as it is with gold: yields on Treasury bonds, which usually rise when investors expect inflation, have actually fallen; and prices of other commodities have been falling as well. Yet the gold price continues to reach new highs. When the highest official in charge of financial markets and monetary policy is puzzled by huge increases in the price of gold, a bubble is very possible.
Adding to the confusion, Congressman Ron Paul asked Bernanke in July 2011 if gold is “money.” Bernanke responded “No: Gold is an asset.” He then continued, saying “the reason that people hold gold is as a protection against what we call tail risks: really, really bad outcomes.”6 It is true that many investors have bought gold as a hedge against worst-case outcomes; however, if gold is not money, but an asset bought in speculation of severe upcoming economic turmoil, it will drop significantly if the expected calamity doesn't materialize. Moreover, even if severe economic collapse does take place, gold may still lose much of its value since recessions decrease the value of nearly all asset classes. Gold may hold strength relative to other asset classes, but its absolute value will drop. If the most powerful banking and financial government official is confused by the gold rally, investors should be very wary.
Stock market icon Warren Buffett doesn't seem to care for gold either:
“Look,” he says, with his usual confident laugh. “You could take all the gold that's ever been mined, and it would fill a cube 67 feet in each direction. For what that's worth at current gold prices, you could buy all—not some—all of the farmland in the United States. Plus, you could buy 10 Exxon Mobils, plus have $1 trillion of walking-around money. Or you could have a big cube of metal. Which would you take? Which is going to produce more value?”7
Dollar Strength and Market Weakness
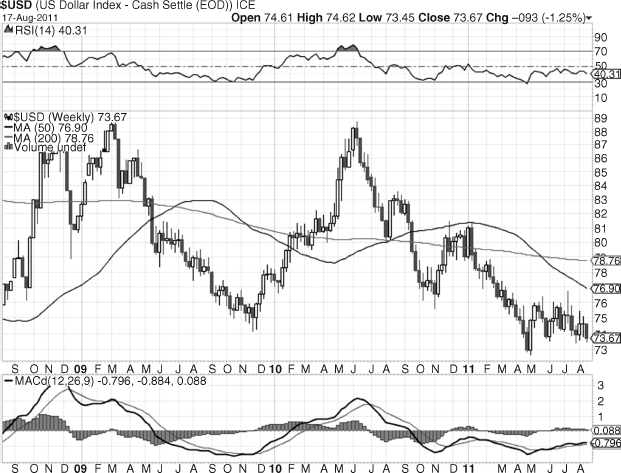
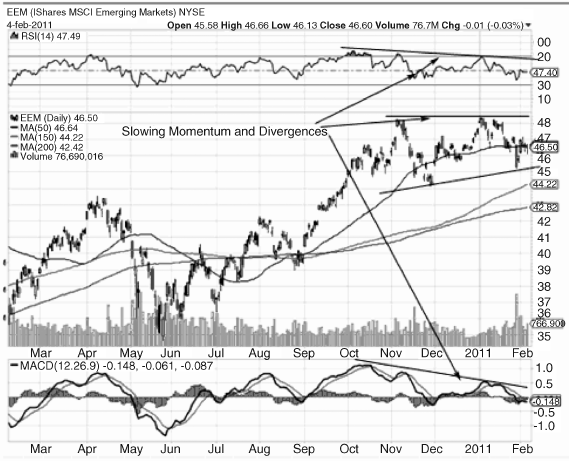
As we've illustrated, the value of gold depends greatly on dollar weakness and emerging market strength. However, I predict the dollar will likely recover and emerging markets will enter a period of disappointing growth or even recession. And so far, it appears the predictions are coming true, as the dollar is showing increasing momentum and has not made new lows since early May 2011 (see Figure 7.6). At the same time, emerging markets have not made new highs since late 2010, and are even down close to 30 percent in Brazil and China (see Figure 7.7).
Although U.S. investors have been extremely optimistic about emerging market growth and the global investment story, many investors may be ignoring the ongoing troubles that continue to surface in many countries from Greece and Italy to China and Brazil. And unless the emerging markets are able to deal with their inflationary concerns, rapid and potentially dangerous growth, and overheating housing and investment speculation, they may lead the rest of the world back into recession.
Healthy markets require confirmation from most or all parts of the economy—all or most market caps, all or most sectors, and especially all or most of the economic world powers. If countries like China and India, on which our world economy ultimately depends, are struggling, we may inevitably be affected. If segments of our own economy (such as the transports, small-caps, or financials) fail to confirm the overall market direction, we should at least be paying some attention. This may be a critical juncture that could impact the next few months or even years. Finally, if the dollar gains strength and emerging market weakness persists, the commodity run-up will most likely end as global growth fades. And since much of gold's move has been based on inflation, the commodity price surge, emerging market growth, and the demise of the dollar, the gold bubble could be coming to an end.
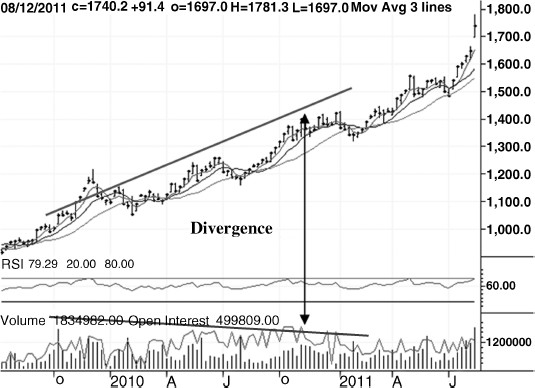
Though the price of gold has continued to soar, the momentum behind future increases has declined. The most obvious and visible sign of momentum is a continued run-up in prices, but if that momentum is not confirmed by other, more discrete indicators, a reversal is possible. In the case of gold, both open interest and ETF holdings are failing to confirm the record-high gold prices. Gold has continued making new highs from late 2010 to August 2011, but both open interest (which indicates future demand via the flow of money into commodity futures) and GLD holdings (which measures the amount of physical gold held in the trust of the most popular gold ETF) have failed to make new highs in 2011 (see Figures 7.8 and 7.9). When indicators that generally trend together with the underlying price fail to make new highs (known as a “divergence”), an early warning is triggered.
Figure 7.9 (A) Declining GLD Option Open Interest (Millions of Contracts) and (B) GLD Holdings (Millions of Troy Ounces)
Source: Richard Bloch, “Gold and Silver Interest: What Options Are Telling Us,” Seeking Alpha, July 6, 2011.9
Big Guys Selling: “Smart” Money Leads the Way
Gold investors are by no means alone. Their decision to invest in gold is strongly supported by the “experts” and “smart money”—highly recognized individuals and financial gurus such as hedge fund icons John Paulson, Paul Tudor Jones, Ray Dalio, Peter Schiff, and David Einhorn—who have also invested in gold. Billionaire investor George Soros also heavily invested in gold, but disposed of the bulk of his position in 2011, reducing his holdings from 4.721 million shares of the SPDR Gold Trust (GLD) to only 49,400 shares.8 While he has added stocks of gold miners to his portfolio, Soros's large exit from the gold trade may signal the beginning stages of the bubble's collapse, as gold bugs begin to realize the risks and as selling pressure mounts. As more gold investors decrease their exposure or divest from gold, the negative feedback loop—which carries the bubble on the way down through fear and panic—can gain traction.
Is the Commodity Run-Up about to Reverse Course?
Originally published February 7, 2011: “Is the Commodity Run-Up about to Reverse Course?,” Seeking Alpha.10
With wheat, cotton (BAL), corn (CORN), sugar (SGG), coffee (JO), and the broader agriculture sector (AGF, DAG, DBA) gaining as much as 250 percent from mid-2010 to early 2011, there is no doubt commodities have led the way and will continue to be the center of much attention in the upcoming months. But after such huge run-ups—which have been spurred on by continuing global growth, surging global demand, and a very high degree of speculative buying—is the commodity play about to reverse course? Is it too late to get in?
Admittedly, I have been avoiding the commodity play even as it has continued to soar. Prices have been rising much too sharply for a cautious investor to simply jump in. And since I have been warning of a gold bubble for a few months, I decided it would be best to avoid joining the overspeculation in the rest of the commodity markets as well. Yet while I have missed the boat thus far, as commodities have soared due to inflationary and demand-driven concerns, I believe we are currently at a saturation level and may be setting up for a sharp correction.
It is true that global demand has grown and that more food and supplies are going to be highly sought-after as the world and emerging markets continue to expand. But at what point can we separate the demand that's driven by real world needs and the demand that's driven by the speculation and expectations of global growth? In other words, much of the spike in commodity prices is due to investors and countries betting on prices continuing higher, rather than actual consumer demand for these products. And since prices may be high due to overspeculation, now may be a good time to at least be cautious, if not avoid the commodity play altogether.
I have already discussed why I think the precious metals space is weakening, and why we should avoid the gold (GLD), silver (SLV), palladium (PALL), and copper (JJC) plays, among others. But with the emergence of a wide variety of agriculture and commodity ETFs over the past few years, and the ease with which the common investor can now invest in these commodities, we are seeing very heightened speculative behavior by many market participants.
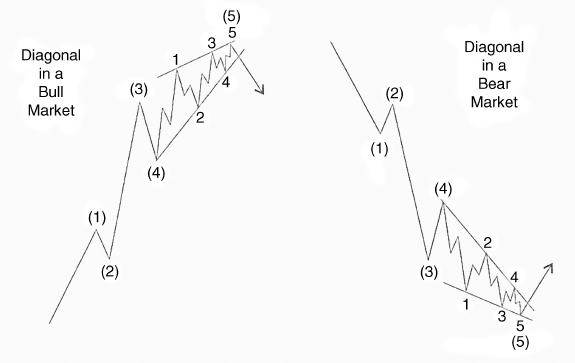
Here's why the commodity theme may be in danger of correction or reversal: As we've discussed in the case of gold's fifth and final wave, it appears that other commodities such as sugar and cotton have actually peaked first, ahead of gold. An “ending diagonal” pattern has developed in sugar and cotton and could be signaling the beginning of the end for the commodity bull market.
As Elliott and later Frost and Prechter pointed out, “an ending diagonal occurs primarily in the fifth wave position at times when the preceding move has gone” too far too fast’ . . .. In all cases, they are found at the termination points of larger patterns, indicating exhaustion of the larger movement.”11 Figure 7.10 shows what diagonals look like.
Figure 7.10 Ending Diagonals
Source: A. J. Frost, and Robert R. Prechter Jr., Elliott Wave Principle: Key to Market Behavior, 10th ed. (Gainesville, GA: New Classics Library, 2005), 37.
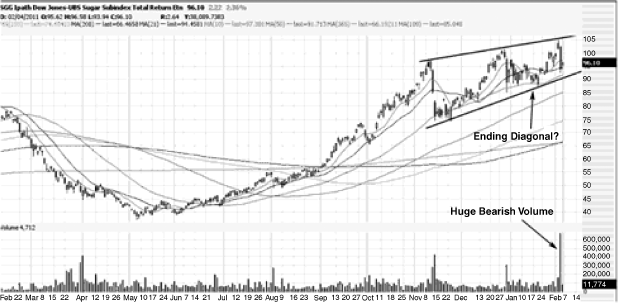
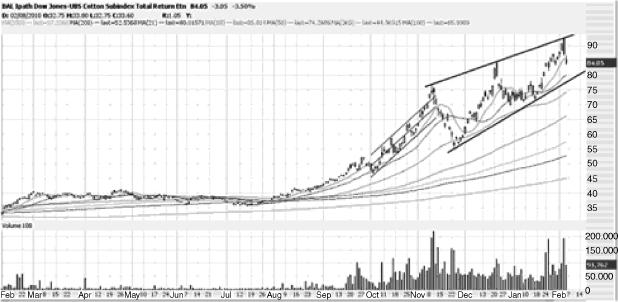
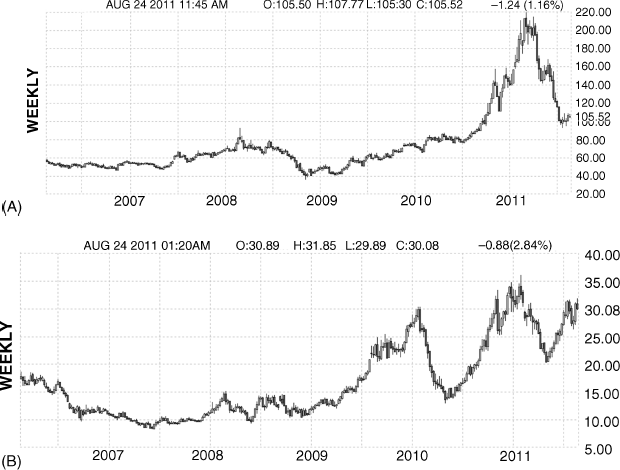
Perhaps there is no greater proof of a commodity price surge than in the case of sugar (SGG) and cotton (BAL). Both have been up way over 100 percent in less than a year starting in mid-2010, and have created much strain and potential future burdens on companies who use sugar or cotton in their products. In other words, the higher the cost for the inputs of these companies, the lower the profits these companies can make unless they raise their own prices. And besides for the fact that high commodity prices can severely slow growth, there is some technical weakness in these charts, with Figures 7.11 and 7.12 telegraphing “ending diagonals” in sugar and cotton.
In order to understand the commodity markets, then, we can look at sugar and cotton as our main determinants of the overall commodity sector direction. And as you can see in Figure 7.12, sugar may currently be in an ending diagonal—which will see price break down through the bottom trendline and enter into a steep correction. Considering we just witnessed a huge down day for sugar, which was backed by huge selling volume, the correction may be upon us. If we do the same analysis for cotton (BAL) in Figure 7.12, we notice the same situation.
Also in an ending diagonal, and on an even sharper price ascent, cotton had two big down days on fairly large volume. Add to that the “outside day” or “bearish engulfing” in terms of candle patterns in early February 2011—which is a very prominent reversal pattern—and we may be right at the top before a severe downturn.
Paying close attention to sugar and cotton, as well as the broader commodity and agriculture sectors, over the next few days or weeks will be vital to predicting future market direction. If we continue seeing weakness, we may be in for some trouble. Our recommendation to investors would therefore be one of caution, profit taking, and even some diligent short-selling. Inflation and continued demand could cause commodity prices to continue higher, but after such huge price run-ups, at such a critical juncture in global economic growth, and with such tremendous speculation currently involved in these commodity plays, we may be nearing a considerable correction. Caution is key.
Commodity Declines in 2011
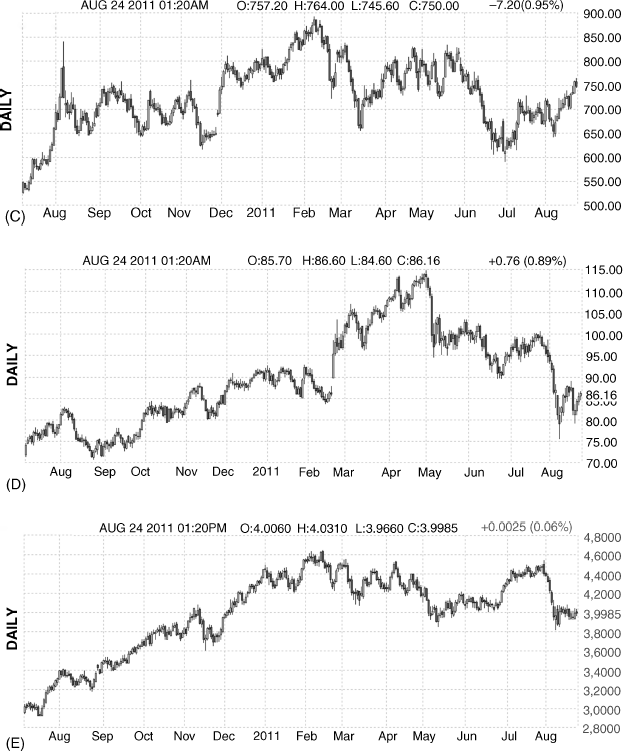
Commodities have seen massive declines in 2011. Gold may have continued higher, but cotton is down over 50 percent, sugar saw a drop of over 40 percent, wheat dropped 30 percent, crude oil dropped over 30 percent, and copper has been down 30 percent (see Figure 7.13). Not only are these massive declines forewarning of an economic slowdown and commodity implosion, but when investors start realizing that commodities have actually been plummeting while most people had been optimistic about future price rises, they will likely panic and sell any investments that have commodity exposure. Gold will likely not be safe from the onslaught, and will drop together with the broad commodity space.
Figure 7.13 Commodity Declines in 2011: (A) Cotton, (B) Sugar, (C) Wheat, (D) Crude Oil, and (E) Copper
Source: www.finviz.com.
Copper and Oil Signal Recession
Originally published October 12, 2011: “Copper and Oil Signal Recession, but Battered Japan May Outperform,” Seeking Alpha.12
Copper and oil have historically been regarded as indicators of economic conditions. When copper and oil prices are rising, industrial growth is expected to follow, which results in economic expansion. The opposite case—when copper and oil prices are falling—indicates an economic slowdown and potential recession.
Copper
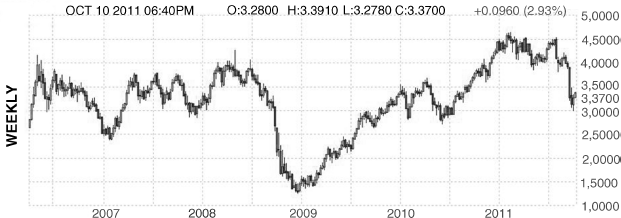
As shown in Figure 7.14, copper had broken above the 2008 highs it set before the onset of the Great Recession, but has fallen very sharply since its early 2011 peak—with prices collapsing by over 30 percent from August through September. Copper is looking to rebound from these levels, but will likely not regain recent highs. Instead, the sharp drop in copper may be signaling the onset of a renewed recession. China and emerging markets are slowing down, which lowers demand for copper. Lowered demand and slowing growth may result in recessions.
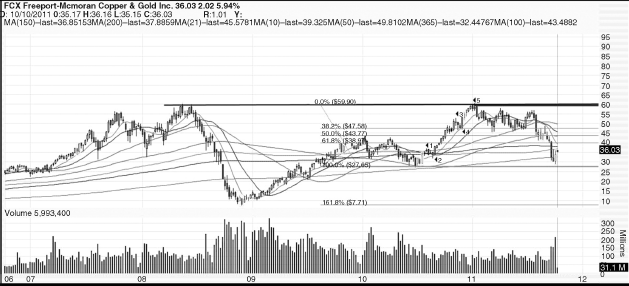
The best way to invest in copper through stocks had traditionally been Freeport McMoRan (FCX), seen in Figure 7.15. FCX provided investors with exposure to copper, as the company operates gold and copper mines. FCX was one of the only copper-related stocks around for years. FCX is therefore a pretty good indicator for future copper prices, and in turn also the future of the economy.
While actual copper prices broke above their 2008 highs by approximately 20 percent, FCX broke above its 2008 highs by less than 1 percent. It also did not hold above the previous highs, and failed at that level—marking a double top formation at $60 per share. This double top formation should be hard to break above and hold; previous highs should act as very strong resistance if prices approach them. FCX may bounce here after retracing to the 2010 lows, but unless previous highs are exceeded and maintained, recession is much more likely as copper has signaled a downturn.
Oil and Energy
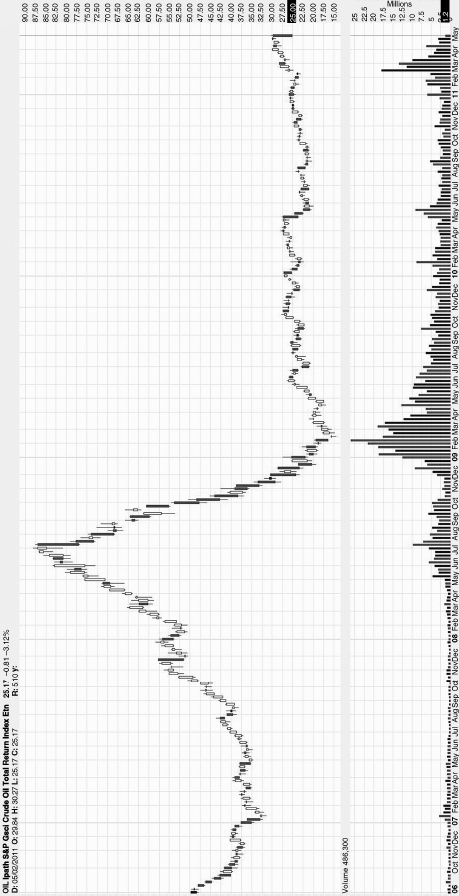
Oil prices soared in 2007 and 2008 only to come crashing down with the onset of the Great Recession. Oil and energy essentially turned into a bubble as investors piled into crude oil and energy-related plays as a way to profit from the soaring prices. However, recessions generally result in lower demand for energy, as economic growth is not there to boost prices. Oil was the best example of a commodity bubble, as its tremendous collapse in 2008 is clearly visible in Figure 7.16.
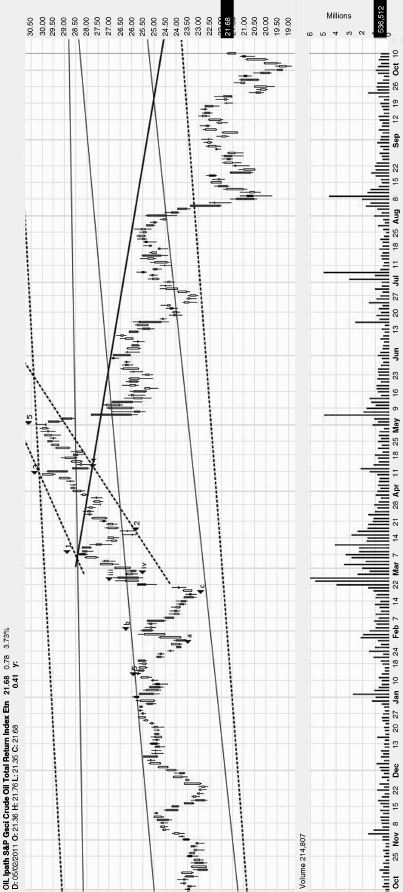
Oil, as represented by the oil ETF (OIL), has bounced from its 2009 low, but has recently resumed the downtrend as it appears to have broken down from an “ending diagonal” that signaled a sharp drop, seen in Figure 7.17.
The huge drop in Crude, from $115 to nearly $75, is a signal of a slowing global economy. If the economy slows, less oil is demanded. Oil's drop, together with the drop of many other commodities like sugar (SGG), cotton (BAL), platinum (PPLT), and silver (SLV), is signaling an economic slowdown or renewed recession. While commodity prices may bounce from the September or October 2011 lows, they will likely not break above recent highs and have likely peaked. Gold is a commodity as well, and a plunge in the broader commodity space bodes very poorly for the gold bubble.
Commodities Still a Bubble, but Prices May Continue to Rise
Originally published May 9, 2011: “Commodities Still a Bubble, but Prices May Continue to Rise Seeking Alpha.13
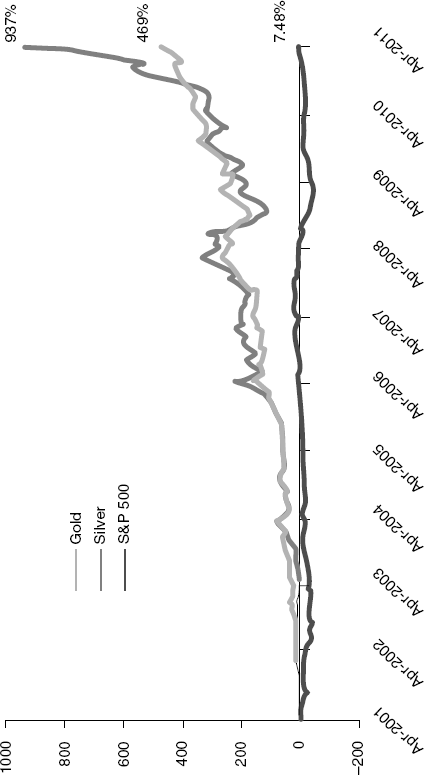
After a 900-plus percent and nearly 500 percent skyrocketing run-up in silver and gold prices, respectively, since 2001, the market finally woke up in early May 2011 and corrected the soaring investor enthusiasm that has carried the prices of precious metals, oil, and commodities to extreme and historically unsustainable levels. Moves of such magnitude are never sustainable and are almost always inevitably due for a much more severe collapse as institutions, skilled investors, and—most devastatingly—the average investors who got in too late, panic and sell as prices continue to plummet.
Notice the massive gains in gold and silver while stocks have lagged heavily (Figure 7.18).
Figure 7.18 Ten-Year Percentage Change of Silver, Gold, and the S&P 500
Source: Bespoke Investment Group.
Gold was the first focus of investor enthusiasm, for the following five reasons.
1. Gold offered a much better alternative to the struggling stock market.
2. It was expected to offer the only real store of value at a time when dollars and paper money seem to be doomed to fail.
3. It would protect investors from both inflation and deflation (though someone has to be wrong).
4. It continues to see demand growth across the globe.
5. It has many fundamental reasons to continue rising.
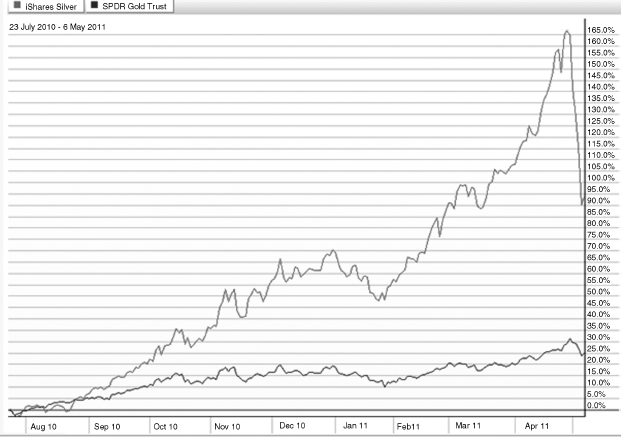
As gold continued to rise, silver started rising at an even more rapid pace, as enthusiastic investors bought it in a frenzy because it was both more affordable and has industrial uses. Figure 7.19 shows how silver tremendously outperformed gold from August 2010 to May 2011.
Not only has silver utterly destroyed gold in terms of performance, it has also taken a much bigger hit as investors flocked out of it in early May 2011. Silver dropped nearly 30 percent, while gold dropped less than 10. The massive drop in silver shows us what can happen when extreme enthusiasm comes to a screeching halt—something that could easily happen to gold and the entire commodity space almost instantly.
Moreover, the relatively small drop in gold over the same period shows that gold has some more strength behind it. At the same time, however, the massive drop in silver has taken a lot of attention away from gold—and since I expect gold and silver to move up and down together, I think that the largely ignored move in gold will lead us to much more severe downturns in gold in the future. In other words, when people forget about the huge drop in silver and start to remember that gold could be in danger as well, they will start selling their gold—and prices will drop much more rapidly.
When the bubble bursts—and I am almost completely sure it will, since the evidence is too hard to ignore—you can bet that the drop will not be limited to one or a few commodities. You will certainly see a massive drop in oil, gold, silver, cotton, sugar, platinum, palladium, corn, and just about any ETF or investment that has soared while investors have poured their money into the commodity space.
The question now is whether the commodity bubble has popped or whether it is just a correction before the next leg up. Since I am a full believer that this commodity bubble will pop and will tremendously hurt the average investor, I would caution investors to stay away from the commodity space unless they can monitor it constantly and set very close stops in case prices start to tumble.
On the other hand, such a huge correction is definitely due for at least a short-term bounce as the next wave of investors piles their money into silver, gold, and other commodities. Moreover, I am still unsure if the bubble has truly popped. I am seeing increasing signs of froth and danger in the commodity theme, but I cannot yet rule out a continued run-up that sees even more extreme enthusiasm as investors jump aboard for the final run.
Just as on the way up, prices cannot move straight in one direction without taking breathers or corrections. Therefore, if we have reached the top of the bubble, we will undoubtedly see corrections as some investors buy gold and commodities at what they think to be a bargain price. We are left with two choices:
1. The top of the bubble has been reached.
2. This has just been a correction before the next leg up.
If we have reached the top of the bubble, these temporary bounces and corrections on the way down are a great entry point for selling short. In this case, one would be making very good bets by selling short gold or silver, or buying put options to leverage the drop in prices. On the other hand, if this is just a correction before the next leg up, short sellers must be careful not to stay short if new highs are made. Since I am a believer that this commodity bubble will ultimately collapse, I would rather wait for a more definitive sign that we have reached the bubble top. In my opinion, this has been a very sharp correction and we could still see gold prices reaching new highs—even much higher prices. But whether we have reached the top or will continue to rise to new highs, there is one thing I am sure about: Gold and commodities are in a bubble and will ultimately collapse to the utter shock of millions of people across the globe. We could see a continued run-up to new, and even extreme, highs—but we are entering the final move, if we have not seen it already.
Signs of a reversal have surfaced and have greatly strengthened our argument that gold is in a bubble on the verge of collapse. In addition to the numerous signs pointing to overspeculation, massive publicity, and extreme expectations, we are seeing increasing confirmation that a peak is approaching: stocks of gold mining companies are lagging the move in gold itself; the dollar is recovering to the detriment of gold and commodities; stock markets and economies from the United States to Europe to China are seeing massive declines that could bring gold down with them; momentum is declining; smart money is selling gold; and most of the commodity space has seen major declines in 2011.
The commodity bubble in general, and the gold bubble in particular, has lasted over 10 years. Much of the move has already taken place, and the enthusiasm has had time to build. Now, with much of the fundamental story already factored in, it is time for investor emotions and expectations to take control. Will investors rush to buy as enthusiasm peaks? Or are we just taking a breather before the next, and much steeper, drop? The possibility of a further frenzy and soaring prices is still out there; but even if it is, it will ultimately end in massive drops in prices, huge losses, and a big fat “I told you so!”
