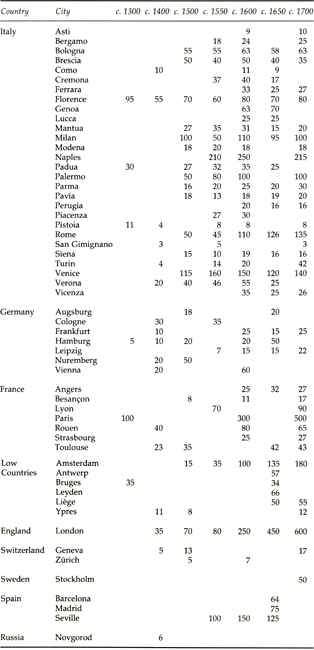
Table A.1 Approximate population of selected European cities, 1300–1700 (thousands)
Table A.2 Rough birth and death rates in selected European cities, 1551–1699
| Births | Deaths | ||
| City | Years | (per thousand inhabitants) | |
| Antwerp | 1696–99 | 30 | |
| Bologna | 1581 | 38 | |
| 1587 | 38 | ||
| 1595 | 36 | ||
| 1600 | 35 | 18 | |
| 1605 | 46 | ||
| 1606 | 36 | 43 | |
| 1615 | 11 | ||
| 1617 | 35 | ||
| 1619 | 46 | ||
| 1620 | 49 | ||
| Florence | 1551 | 41 | |
| 1559 | 36 | ||
| 1561 | 47 | ||
| 1562 | 42 | ||
| 1622 | 39 | ||
| 1630 | 45 | ||
| 1632 | 43 | ||
| 1633 | 44 | ||
| 1642 | 48 | ||
| 1657 | 48 | ||
| 1660 | 49 | ||
| 1661 | 48 | ||
| 1668 | 50 | ||
| London | 1696–99 | 38 | 37 |
| Louvain | 1635–44 | 44 | |
| Pavia | 1640–49 | 46 | 30 |
| 1650–59 | 40 | 41 | |
| 1690–99 | 52 | 44 | |
| Parma | 1505–9 | 41 | |
| 1545–49 | 45 | ||
| 1590–94 | 42 | ||
| 1650–54 | 42 | ||
| Venice | 1581 | 34 | 33 |
| 1624 | 31 | 35 | |
| 1642 | 37 | 30 | |
| 1696 | 31 | 32 | |
| Verona | 1641–50 | 38 | |
| 1651–60 | 37 | ||
| 1661–70 | 49 | ||
| 1671–80 | 54 | ||
| 1681–90 | 42 | ||
| 1691–1700 | 43 | ||
| Zürich | 1631–50 | 37 | 36 |
Table A.3 Infant mortality rate (died in first year of life, per thousand christened) in Fiesole (Tuscany), 1621–99
| Years | Deaths | Years | Deaths |
| 1621 | 141 | 1661 | 303 |
| 1622 | 238 | 1662 | 167 |
| 1623 | 119 | 1663 | 230 |
| 1624 | 258 | 1664 | 358 |
| 1625 | 177 | 1665 | 199 |
| 1626 | 278 | 1666 | 388 |
| 1627 | 216 | 1667 | 377 |
| 1628 | 148 | 1668 | 383 |
| 1629 | 186 | 1669 | 212 |
| 1630 | 164 | 1670 | 245 |
| 1631 | 140 | 1671 | 277 |
| 1632 | 228 | 1672 | 301 |
| 1633 | 224 | 1673 | 183 |
| 1634 | 243 | 1674 | 115 |
| 1635 | 213 | 1675 | 339 |
| 1636 | 257 | 1676 | 145 |
| 1637 | 319 | 1677 | 364 |
| 1638 | 193 | 1678 | 423 |
| 1639 | 315 | 1679 | 515 |
| 1640 | 322 | 1680 | 184 |
| 1641 | 205 | 1681 | 302 |
| 1642 | 192 | 1682 | 362 |
| 1643 | 287 | 1683 | 492 |
| 1644 | 224 | 1684 | 565 |
| 1645 | 369 | 1685 | 459 |
| 1646 | 234 | 1686 | 430 |
| 1647 | 118 | 1687 | 360 |
| 1648 | 363 | 1688 | 567 |
| 1649 | 514 | 1689 | 393 |
| 1650 | 296 | 1690 | 259 |
| 1651 | 223 | 1691 | 341 |
| 1652 | 236 | 1692 | 298 |
| 1653 | 222 | 1693 | 396 |
| 1654 | 355 | 1694 | 392 |
| 1655 | 273 | 1695 | 277 |
| 1656 | 411 | 1696 | 468 |
| 1657 | 310 | 1697 | 252 |
| 1658 | 496 | 1698 | 370 |
| 1659 | 736 | 1699 | 229 |
| 1660 | 162 |
Table A.4 Characteristics of a typical preindustrial population: Sweden, 1778–82
| Phenomenon | Value |
| Total population | 2,104,000 inhabitants |
| Population under 15 years of age | 31.9 percent |
| Population between 15 and 64 years | 63.2 percent |
| Population 65 years and over | 4.9 percent |
| Dependency ratio | 58.3 percent |
| Crude birth rate | 34.5 per thousand |
| Crude death rate | 25.9 per thousand |
| Crude rate of natural increase | 8.6 per thousand |
| Intrinsic birth rate (females) | 31.2 per thousand |
| Intrinsic death rate (females) | 25.3 per thousand |
| Intrinsic rate of natural increase (females) | 5.9 per thousand |
| Infant mortality | 211.6 per thousand |
| Age-specific death rates: | |
| Age 1–4 (males) | 45.9 per thousand |
| Age 1–4 (females) | 44.3 per thousand |
| Age 50–54 (males) | 20.8 per thousand |
| Age 50–54 (females) | 16.1 per thousand |
| Life table values: | |
| Probability of dying in first year | |
| Males | 0.1974 |
| Females | 0.1768 |
| Survivors to the age of 50 per 100 births: | |
| Males | 41 |
| Females | 45 |
| Life expectancy at birth: | |
| Males | 36 years |
| Females | 39 years |
| Life expectancy at 1 year: | |
| Males | 44 years |
| Females | 46 years |
| Life expectancy at 50 years: | |
| Males | 19 years |
| Females | 20 years |
| Average age of women at procreation | 32 years |
| General fertility rate | 145.2 children per 1,000 women |
| Gross reproduction rate | 2.2 female children per woman |