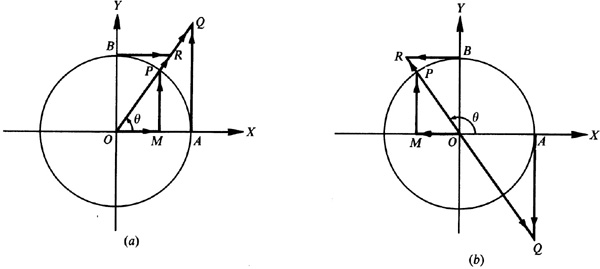
Let θ be any given angle in standard position. (See Fig. 7.1 for θ in each of the quadrants.) With the vertex O as center, describe a circle of radius one unit cutting the initial side OX of θ at A, the positive y axis at B, and the terminal side of θ at P. Draw MP perpendicular to OX; draw also the tangents to the circle at A and B meeting the terminal side of θ or its extension through O in the points Q and R, respectively.

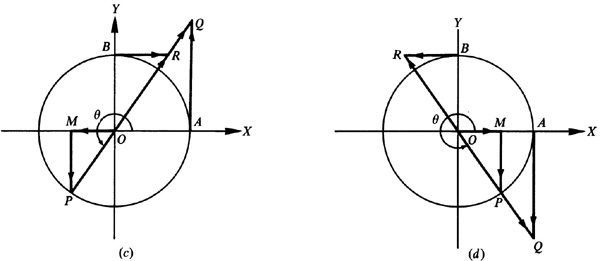
In each of the parts of Fig. 7.1, the right triangles OMP, OAQ, and OBR are similar, and

The segments MP, OM, AQ, etc., are directed line segments. The magnitude of a function is given by the length of the corresponding segment, and the sign is given by the indicated direction. The directed segments OQ and OR are to be considered positive when measured on the terminal side of the angle and negative when measured on the terminal side extended.
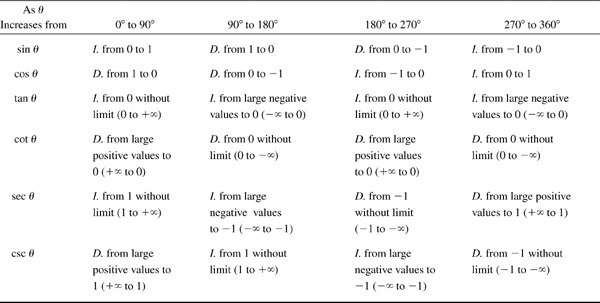
Let P move counterclockwise about the unit circle, starting at A, so that  varies continuously from 0° to 360°. Using Fig. 7.1, see how the trigonometric functions vary (I. = increases, D. = decreases):
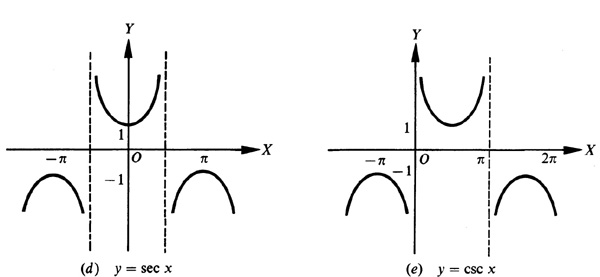
In Fig. 7.4. values of the angle x are given in radians. Whenever a trigonometric function is undefined for the value of x, ±∞ is recorded instead of a function value. The graphs of the trigonomic functions are shown in Fig. 7.2.
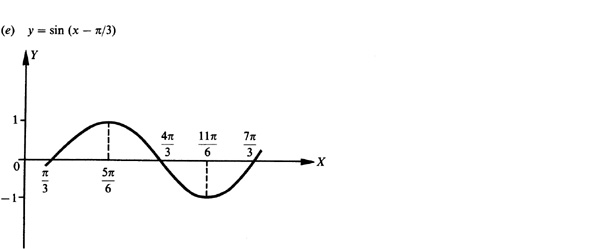
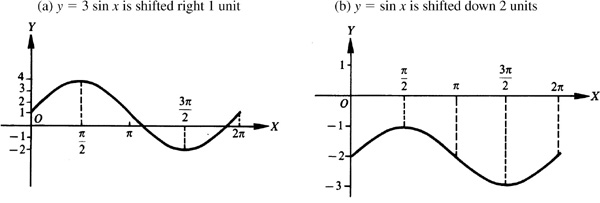
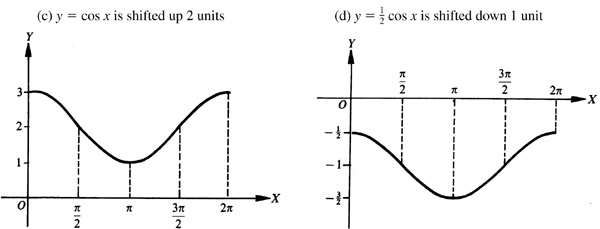
The graph of a trigonometric function can be shifted vertically by adding a nonzero constant to the function and horizontally by adding a nonzero constant to the angle of the trigonometric function. Figure 7.3(a) is the graph of y = sin x and the remaining parts of Fig. 7.3 are the results of shifting this graph.
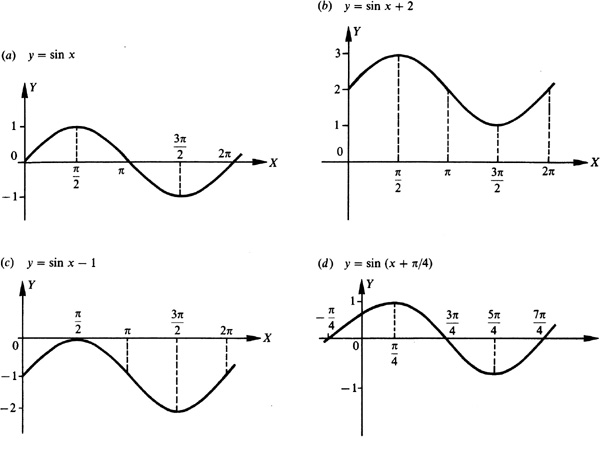
If c is a positive number, then adding it to a trigonometric function results in the graph being shifted up c units [see Fig. 7.3(b)], and subtracting it from a trigonometric function results in the graph being shifted down c units [see Fig. 7.3(c)].
For a positive number d, a trigonometric function is shifted left d units when d is added to the angle [see Fig. 7.3(d)] and shifted right d units when d is subtracted from the angle [see Fig. 7.3(e)].
Any function of a variable x, f (x), which repeats its values in definite cycles is called periodic. The smallest range of values of x which corresponds to a complete cycle of values of the function is called the period of the function. It is evident from the graphs of the trigonometric functions that the sine, cosine, secant, and cosecant are of period 2π, while the tangent and cotangent are of period π.
[NOTE: 1. Since  , the graph of
  may be obtained most easily by shifting the graph of
  distance
  to the left.]
[NOTE: 2. Since  the graph of
  may be obtained by shifting the graph of
  a distance
  to the right.]
The amplitude (maximum y-coordinate) and period (wavelength) of  are, respectively, 1 and 2π. For a given value of x, the value of
  ,
,  , is a times the value of
  . Thus, the amplitude of y = a sin x is a, and the period is 2π. Since when
  ,
,  , the amplitude of
  ,
,  , is 1, and the period is 2π/b.
The general sine curve (sinusoid) of equation

has amplitude a and period 2π/b. Thus the graph of  has amplitude 3 and period
  . Figure 7.4 exhibits the graphs of
  and y = 3 sin 2x on the same axes.
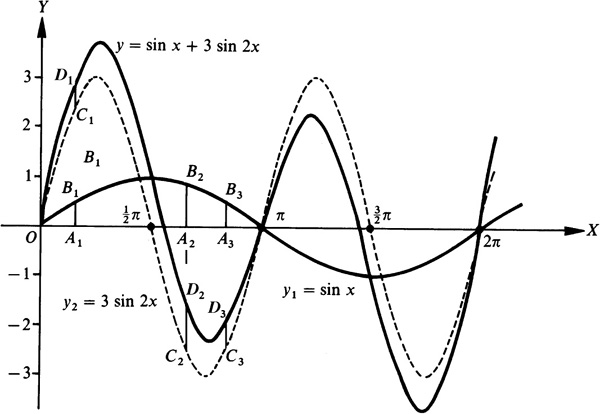
More complicated forms of wave motions are obtained by combining two or more sine curves. The method of adding corresponding ordinates is illustrated in the following example.
EXAMPLE 7.1 Construct the graph of  . See Fig. 7.4.
First the graphs of  and
and  are constructed on the same axes. Then, corresponding to each x value, we find the y value by finding y1 value for that x, the y2 values for that x, and adding the two values together. For example, when
  ,
,  and
and  , so
, so  , when
  ,
,  , and
, and  so
so  , and when
  ,
,  and
and  , so
, so  . Thus, for
  , the y-coordinate for any x-coordinate is the algebraic sum of the y-coordinates of
  and
and  .
.
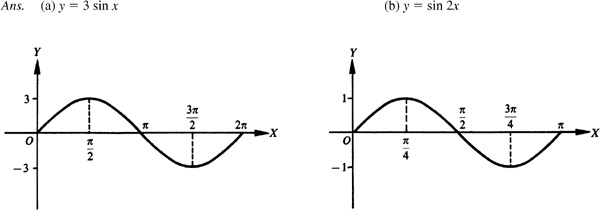
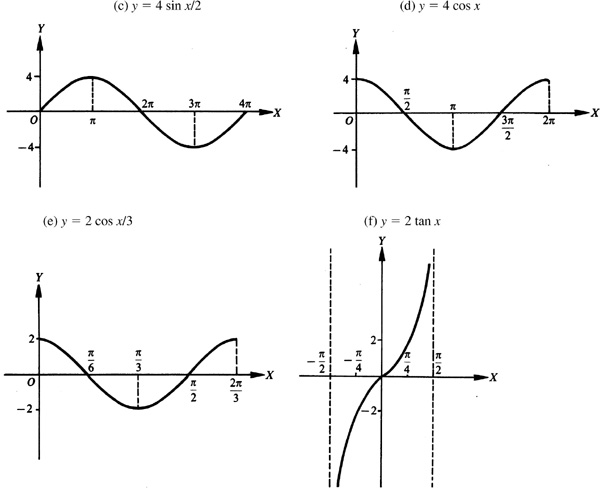
7.1 Sketch the graphs of the following for one period.


In each case we use the same curve, and then put in the y axis and choose the units on each axis to satisfy the requirements of amplitude and period of each curve (see Fig. 7.5).
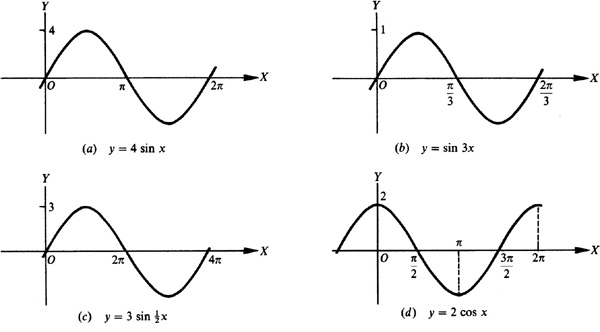

 has amplitude = 4 and period = 2π.
 has amplitude = 1 and period = 2π/3.
 has amplitude = 3 and period =
  .
.
 has amplitude = 2 and period = 2π. Note the position of the y axis.
 has amplitude = 3 and period = 4π.
7.2 Construct the graph of each of the following.
 ,
,
 ,
,
 ,
,

In each case, we use the same curve and then put in the y axis and choose the units on the x axis to satisfy the period of the curve (see Fig. 7.6).
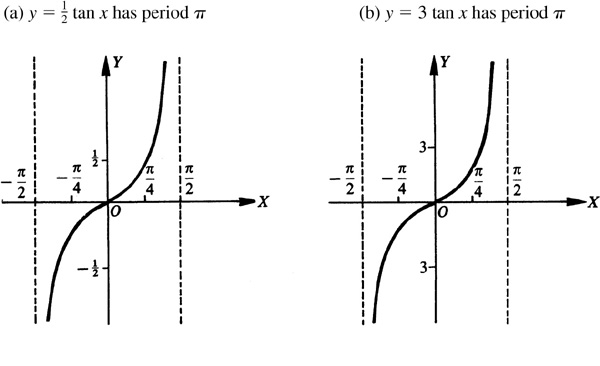
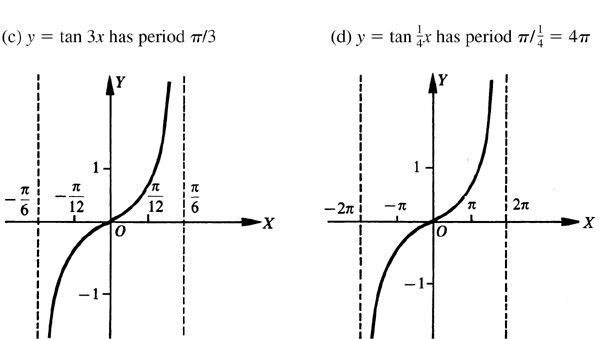
7.3 Construct the graph of each of the following (see Fig. 7.7).
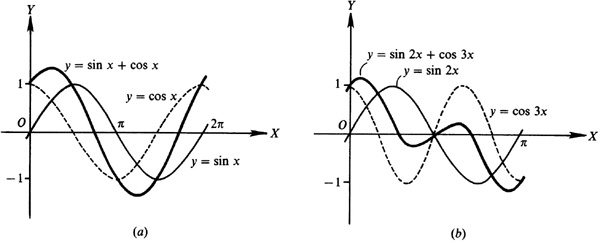
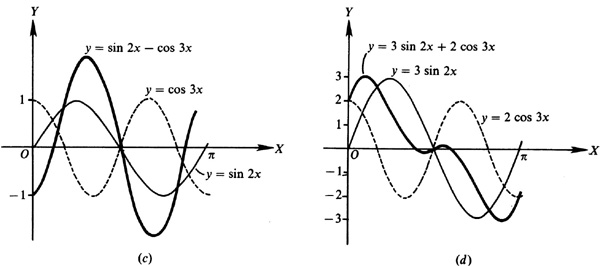


7.4 Construct a graph of each of the following (see Fig. 7.8).


7.5 Construct a graph of each of the following (see Fig. 7.9).


SUPPLEMENTARY PROBLEMS
7.6 Sketch the graph of each of the following for one period (see Fig. 7.10).
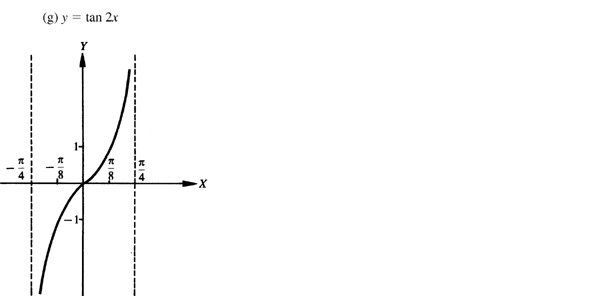


7.7 Construct the graph of each of the following for one period (see Fig. 7.11).
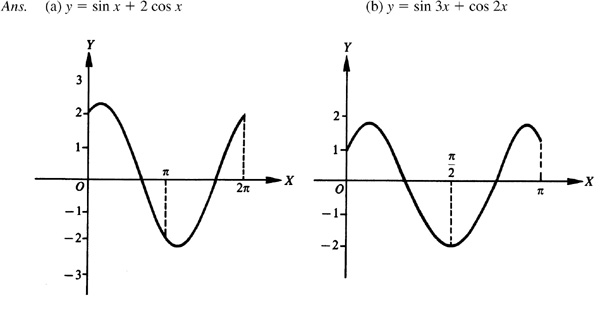
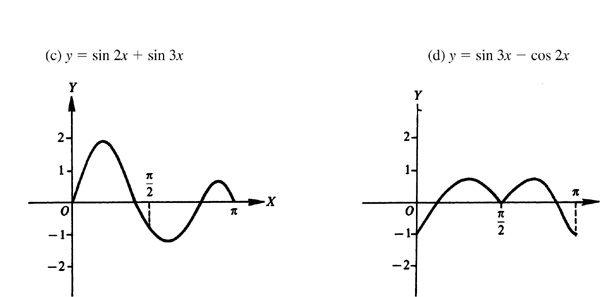


7.8 Construct the graph of each of the following for one period (see Fig. 7.12).
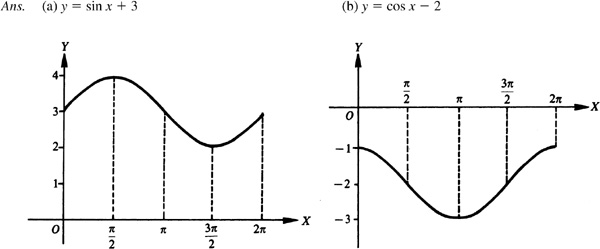


7.9 The horizontal displacement, d, of the bob on a pendulum is given by  , where d is expressed in centimeters, t is in seconds, and a and b are constants. Find the amplitude and period of the displacement of the bob on a pendulum given by:


Ans. (a) Amplitude 10 cm, period 1 s
(b) Amplitude 12 cm, period 0.5 s
7.10 The voltage E in an electric circuit is given by  , where a and b are constants and t is the time measured in seconds. Find the amplitude and period of the voltage given by:


Ans. (a) Amplitude 3.6 V, period 0.025 s
(b) Amplitude 6.2 V, period 0.1 s
7.11 The pressure, P, in a traveling sound wave is given by  , where a, b, and c are constants, P is the pressure in dynes per square centimeter, and t is in seconds. Find the amplitude, period, and phase shift of the pressure given by:


Ans. (a) Amplitude 20 dyn/cm2, period 0.02 s, phase shift 0.2 s
(b) Amplitude 40 dyn/cm2, period 0.01 s, phase shift 0.5 s