From raw materials to NORM by-products
T. Kovacs*; G. Bator*; W. Schroeyers†; J. Labrincha‡; F. Puertas§; M. Hegedus*; D. Nicolaides¶; M.A. Sanjuán**; P. Krivenko††; I.N. Grubeša‡‡; Z. Sas§§; B. Michalik¶¶; M. Anagnostakis***; I. Barisic‡‡; C. Nuccetelli†††; R. Trevisi‡‡‡; T. Croymans†; S. Schreurs†; N. Todorovi憆††; D. Vaiciukyniene§§§; R. Bistrickaite§§§; A. Tkaczyk¶¶¶; K. Kovler‡‡‡‡; R. Wiegers****; R. Doherty§§§§ * University of Pannonia, Veszprém, Hungary
† Hasselt University, CMK, NuTeC, Diepenbeek, Belgium
‡ University of Aveiro, Aveiro, Portugal
§ Eduardo Torroja Institute for Construction Sciences (IETcc-CSIC), Madrid, Spain
¶ Frederick University, Nicosia, Cyprus
** Jefe del Área de Cementos y Morteros, Madrid, Spain
†† Kiev National University of Construction and Architecture, Kyiv, Ukraine
‡‡ J. J. Strossmayer University of Osijek, Osijek, Croatia
§§ Queen's University Belfast, Belfast, United Kingdom
¶¶ Glowny Instytut Gornictwa, Katowice, Poland
*** National Technical University of Athens, Athens, Greece
††† National Institute of Health, Rome, Italy
‡‡‡ National Institute for Insurance against Accidents at Work (INAIL), Rome, Italy
§§§ Kaunas University of Technology, Kaunas, Lithuania
¶¶¶ University of Tartu, Tartu, Estonia
**** IBR Consult BV, Haelen, Netherlands
†††† University of Novi Sad, Novi Sad, Serbia
‡‡‡‡ Technion – Israel Institute of Technology, Haifa, Israel
§§§§ Queen's University Belfast, Belfast, United Kingdom
Abstract
Naturally occurring radionuclides are present in the Earth crust; however, their distribution is not homogeneous. When primary or secondary raw materials containing relatively low concentrations of naturally occurring radionuclides are introduced in an industrial process then the radionuclides can become more concentrated in the produced (by-)products. For example, during the production of purified metals, throughout the purification process, also other elements, such as naturally occurring radionuclides, become concentrated in the by-products. In order to assure radiation protection of the population, it is important to map the potential exposure for workers and the general public. There is an extensive literature available regarding the presence of naturally occurring radionuclides in various by-products; however, it can be hard to review and even to interpret for the regulators and members of the industry in order to assure the safe use of by-products for example in construction.
To solve this problem data mining and text processing have been applied to the ever-increasing numbers of publications (More than 39,000 filtered publications have been processed up to the Jan. 6, 2017), and the NORM4Building database has been compiled based on the analysis of the collected data. Based on this database using text analysis methods the most NORM prone raw materials and industries have been identified. This chapter gives a concise overview on the parameters to be considered during the selection of NORM by-products as feedstock for the construction industry, specifically for the production of cement, concrete, and ceramics. In the frame of this chapter the technical and radiological properties of the most representative industrial processes (such as coal mining and combustion; iron and steel production; the alumina, the zirconia, and the phosphate industry; etc.) and their by-products are discussed, especially considering the needs of the construction industry and the new European Basic Safety Standards.
Keywords
NORM residues; NORM database; Coal mining; Ferrous industry; Nonferrous industry; Phosphate industry; Activity concentration
6.1 Introduction
Article 23 of the Council Directive 2013/59/EURATOM (EU, 2014) deals with the “Identification of practices involving naturally occurring radioactive material (NORM).” According to Article 23 “Member States shall ensure the identification of classes or types of practice involving naturally occurring radioactive material and leading to exposure of workers or members of the public which cannot be disregarded from a radiation protection point of view. Such identification shall be carried out by appropriate means taking into account industrial sectors listed in Annex VI.”
ANNEX VI of the Council Directive 2013/59/EURATOM:
List of industrial sectors involving naturally occurring radioactive material as referred to in Article 23
When applying Article 23 the following list of industrial sectors involving naturally occurring radioactive material, including research and relevant secondary processes, shall be taken into account:
– Extraction of rare earths from monazite
– Production of thorium compounds and manufacture of thorium-containing products
– Processing of niobium/tantalum ore
– Oil and gas production
– Geothermal energy production
– TiO2 pigment production
– Thermal phosphorus production
– Zircon and zirconium industry
– Production of phosphate fertilizers
– Cement production, maintenance of clinker ovens
– Coal-fired power plants, maintenance of boilers
– Phosphoric acid production,
– Primary iron production,
– Tin/lead/copper smelting,
– Ground water filtration facilities,
– Mining of ores other than uranium ore.
The Annex VII (Table 6.1) of the Council Directive 2013/59/EURATOM provides the exemption and clearance levels in terms of activity concentrations for naturally occurring radionuclides in solid materials. For industrial sectors involving naturally occurring radioactive material these values can be applied by default to any amount and any type of solid material to be cleared for reuse, recycling, conventional disposal, or incineration.
Table 6.1
Activity concentrations for exemption or clearance of naturally occurring radionuclides in solid materials in secular equilibrium with their progeny
| Radionuclide | Activity concentration (kBq/kg) |
| Natural radionuclides from the 238U series | 1 |
| Natural radionuclides from the 232Th series | 1 |
| 40K | 10 |
From Table A Part 2 of Annex VII of the Council Directive 2013/59/EURATOM (EU, 2014).
All the activity concentrations reported in this chapter can be considered in light of the exemption or clearance levels (Table 6.1). However, when considering the use of specific by-products from NORM processing industries in building materials then additional criteria for evaluation (the 1 mSv/y reference level for indoor external exposure to gamma radiation from building materials; the activity concentration index as screening parameter) need to be taken into account. Chapter 4 gives a detailed overview regarding the legislation regarding NORM and the reuse of NORM by-products in building materials. The additional criteria for evaluation of building materials (1 mSv/y reference level and the activity concentration index) are discussed in Chapter 7.
The focus of the current chapter is specifically on NORM by-products that find application in construction materials (cement, concrete, and ceramics). Therefore, the current chapter does not discuss all industrial sectors considered by Annex VI but focuses only on by-products with interesting properties for use in construction materials. The construction materials (cement, concrete, and ceramics) that can be produced on the basis of these by-products are discussed in more detail in Chapter 7.
6.2 NORM4Building database
An important goal of the COST Action Tu1301 “NORM4Building” (2014–2017) was to develop a database with best practices for reuse of NORM residues. To automate the accurate collection of data, text mining methodology was applied. Text mining is the process of analyzing collections of textual materials in order to capture and extract key concepts and themes and to uncover hidden relationships and trends from scientific papers without requiring that the precise words or terms that authors have used to express those concepts, is known (Zaki and Wagner, 2013). After retrieving structured information from textual data mining was used to load in the extracted measurement data.
The main milestones of the data mining process were the following:
• automatic keyword-driven selection of papers;
• building and applying the filter based on selected keywords;
• handling different types of publications into the IBM SPSS Modeler software to extract information by means of natural language processing (NLP);
• extracting complete measurement results and the origin (country) from relevant publications in different formats such as Microsoft Word, Microsoft Excel, and Microsoft PowerPoint, as well as Adobe PDF, XML, HTML,
• applying Text Link Analysis (TLA) to define pattern rules and to compare these to relationships found in the text; and
• structuring the collected data.
6.2.1 Collection of data
Input has been gathered from multiple sources:
• A huge amount of publications (More than 39,000 filtered publications have been processed up to the Jan. 6, 2017) have been processed from different e-journals collected from the available materials on Science Direct and Web of Science and others (IAEA and ICRP documents, National Surveys, etc.). The number of investigated publications keeps increasing by the hundreds monthly. The information in several tables provided in this chapter originates from data mining (after manual verification of the results) and the references from which the data were extracted are mentioned.
• A large fraction of the reported data is not coming from the original sources but from papers in which, besides original measurements a review of measurements is also reported. Efforts were made to avoid, also in this case, that data was reported in double, however, in a limited amount of cases this could not be excluded.
6.2.2 Structure of the built database
The database can be divided into several smaller parts, easing decision making by providing multiple options. The main role of the system itself is to provide a large amount of scientific data, from which statistical outputs can be derived. The data can be accessed in the datastore menu, where all the records are simultaneously displayed with all associated data points. Currently the database contains, besides identification and supplementary data (e.g., References, etc.), mainly measurement results obtained from the original scientific article such as the minimum, maximum, and mean values of individual measurements of the 226Ra, 232Th, and 40K radionuclides. In addition the database system also uses the mentioned activity concentrations to generate and store the activity concentration index values calculated on the basis of Radiation Protection 112 (EC, 1999). More information on the activity concentration indexes is given in Chapter 4. The activity concentration indexes are discussed in Chapter 7.
Because of the large number of records stored in the database, some filtering is required to access more sophisticated data. The radiological features option makes the user able to select the region of interest and the type of source material of interest. A simple wizard-like list of options aids the selection. Eventually only the relevant part of the datastore can be shown in Fig. 6.1.
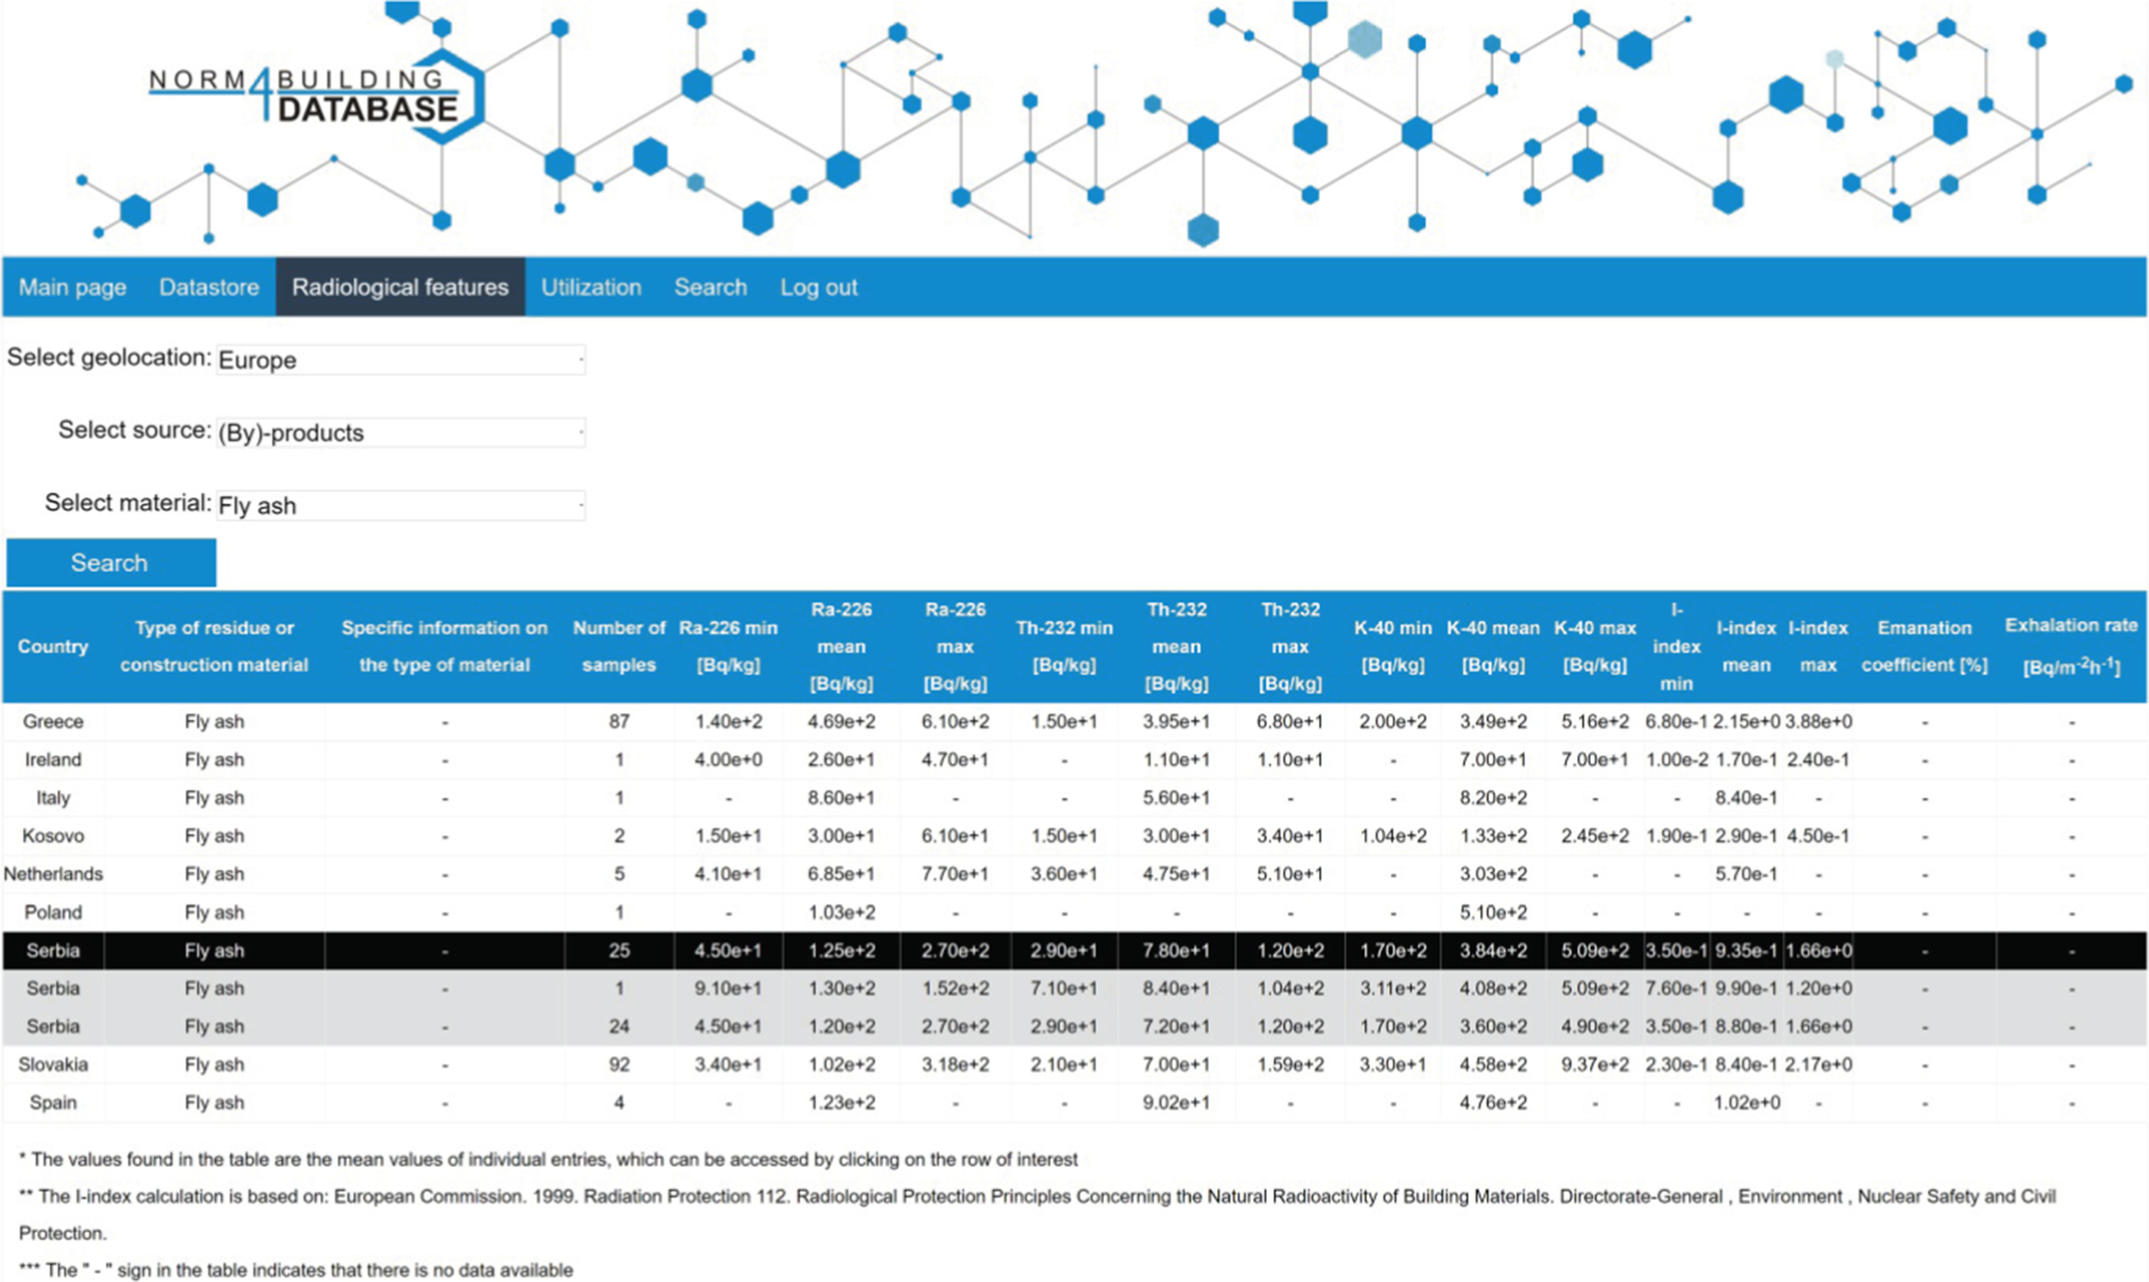
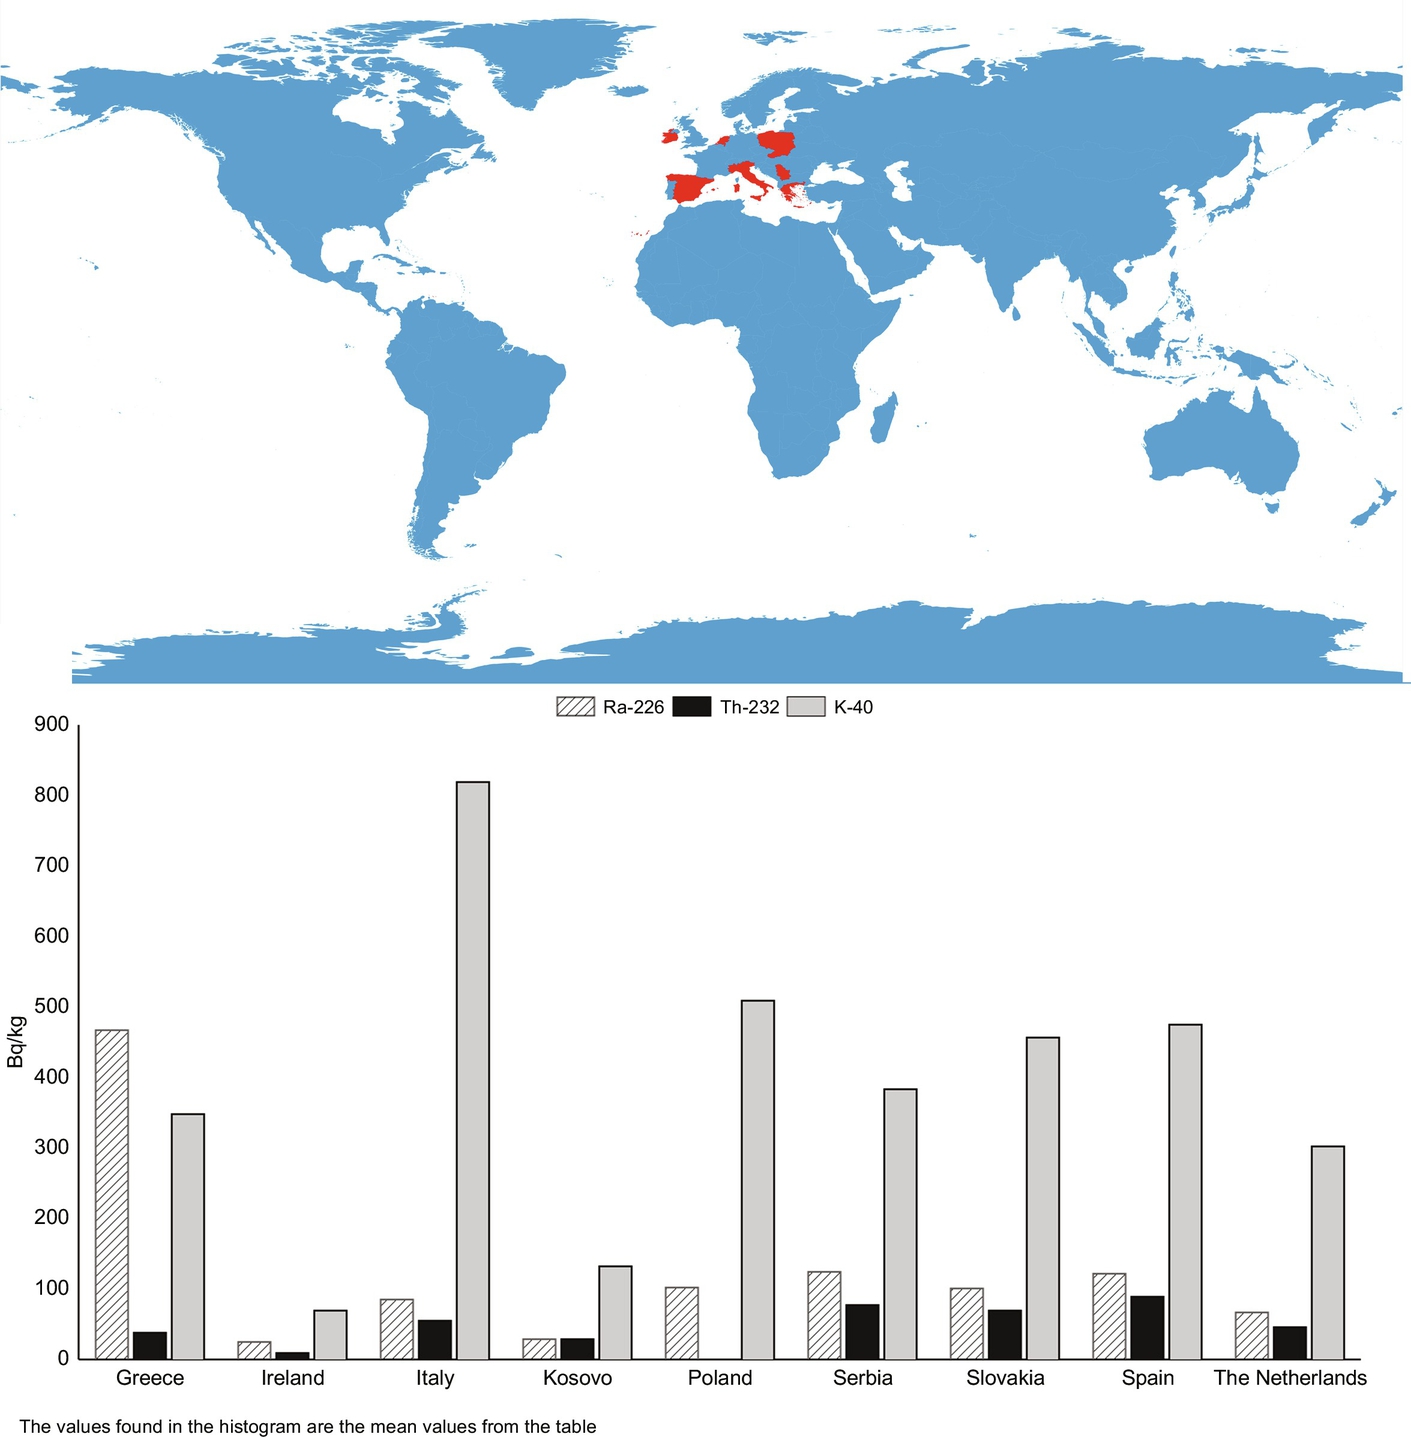
The geological origin of the studied materials is very relevant for the radiological properties of the studied materials. Since country-specific circumstances (legislation, dominant industrial sectors, accessible resources, etc.) determine the use of materials the database aims at providing country-specific information. Therefore the country of origin of the investigated materials is mentioned and visualized for the various entries (Fig. 6.2). The depicted results consist out of averaged results for a given country of origin. As the depicted average is not necessarily representative for all samples for a specific country, clicking on the averaged row displays the list of records with all associated data, from which the averaged values were generated.
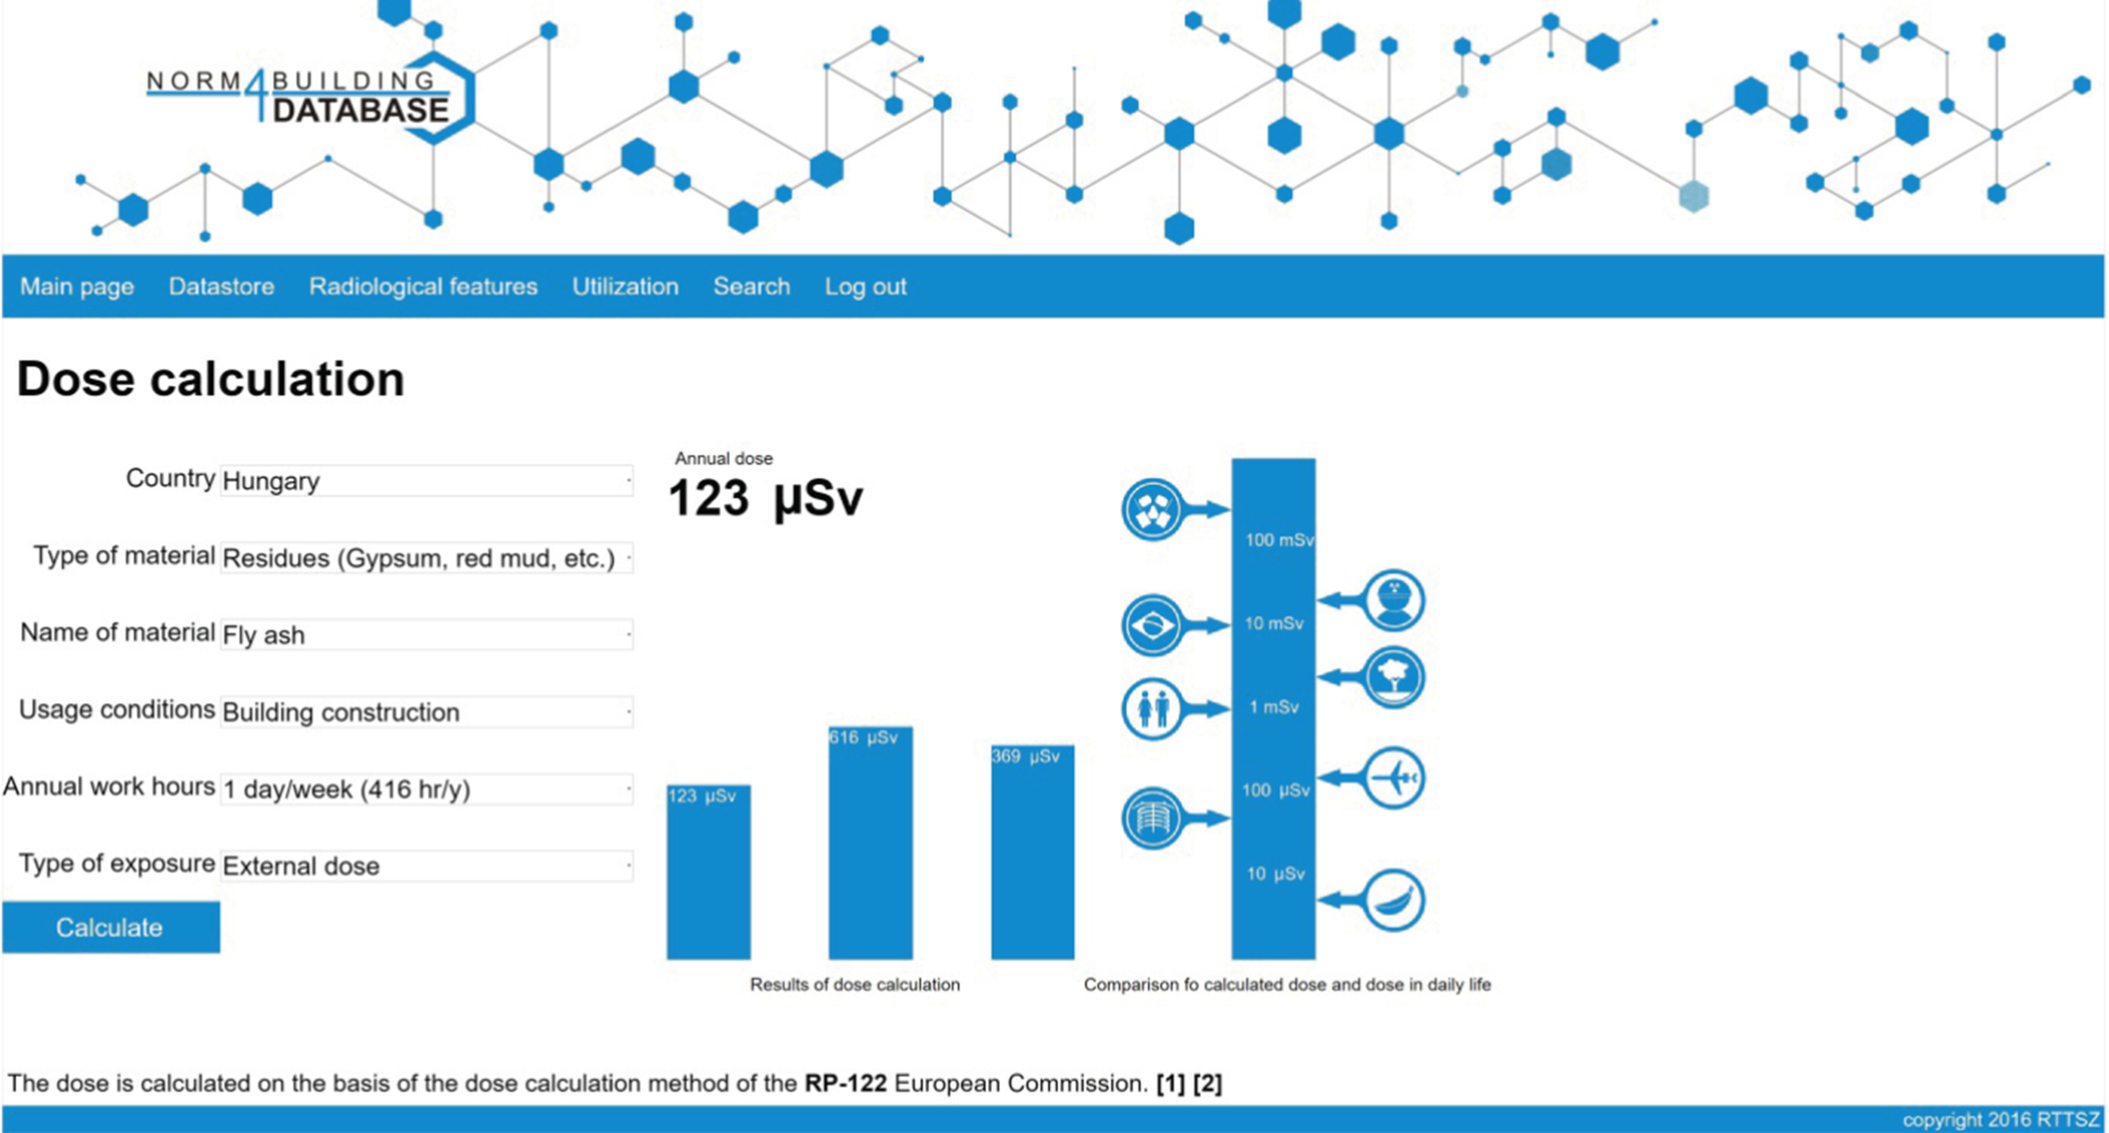
Utilization of the database is also facilitated by a simple method to calculate the radiation dose from the building material. The system contains such a calculator, with which the user can make dose calculation (based on Radiation Protection 112 (EC, 1999)) using a simple form submission. The data needed to make the calculation are stored individually in the system, while the activity data are retrieved from the greater datastore. To help decision making, a simple graphical chart is displayed with notable dose limits, thus demonstrating the radiation dose absorbed by an individual (Fig. 6.3).
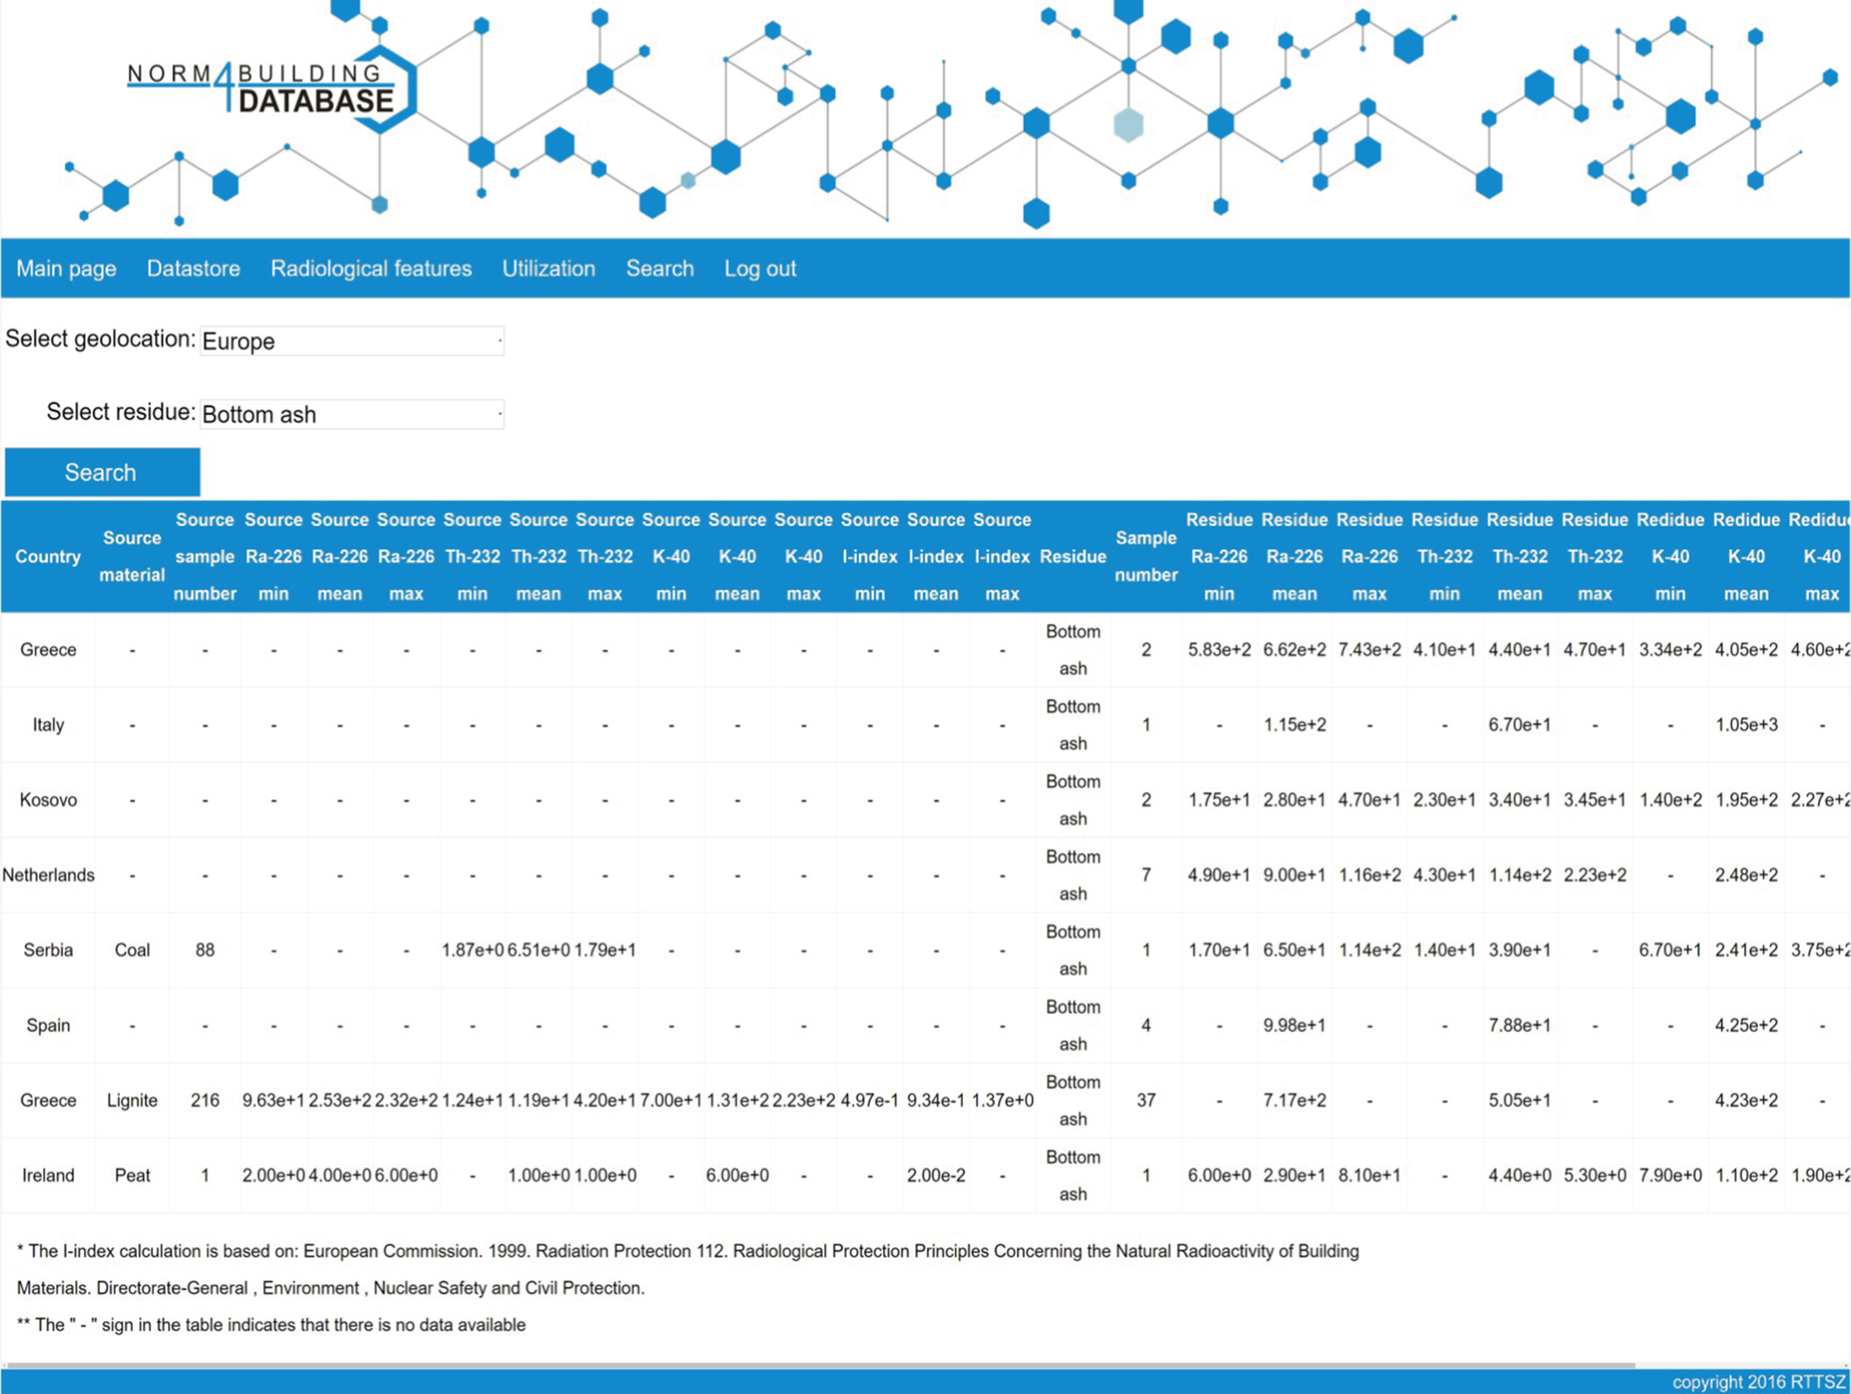
Another option that can support the processing of the data by the user is the “comparison” feature (Fig. 6.4). This feature enables the user to compare a by-product to be utilized with the raw material where it was produced from (if the data are available in the database). As it is known that some processes enrich radioactive material in the produced residue, this feature allows one to see the enrichment ratio.
6.2.3 Utilizing the built database
Several NORM residues, partially deposited in landfills and representing a continuous cost (land-use monitoring, active prevention measures, risk management, etc.), can be a valuable resource for the construction industry. In order to achieve a safe reuse of by-products in construction, numerous concerns have to be addressed. The physical, chemical, and radiological aspects of the construction materials containing by-products have to be considered and evaluated. The legislators and regulators need reliable information in order to implement adequate rules to assure the safety of the population while as much as possible allowing the recycling of by-products. In order to meet these requirements the construction products must be safe and environmental friendly, meet every requirement as a construction material and the application has to be economically viable. Numerous experiments, surveys, and research programs were undertaken to study the safety and the impact of by-product containing construction materials on the environment. A vast quantity of data is available that needs to be processed so that the information can reach the stakeholders. The NORM4Building database aims to provide an efficient tool to support the transfer of information on radiological aspects to the professional stakeholders. By using the technique of data mining the NORM4Building database can be automatically updated in the future and also data mining allows that in the future new criteria can be used for the (re-)evaluation of data. More advanced tools for comparison and visualization of data are in preparation.
In the next sections the data from the database (extract from the NORM4Building Database) are discussed for different by-products from NORM processing industries. In Chapter 7 the data of the database are then used to discuss the radiological aspect of the construction materials that can be produced on the basis of the considered by-products.
6.3 Coal mining and combustion
The world hard coal production in 2011 was 7678 million tons whereas the world lignite production covered only 1041 million tons. Given that coal provides about 30% of world primary energy demand. It is expected that coal production will continue to increase (Reddy, 2013).
During the energy production process based on coal firing, ranging from the mining to the burning of the coals, in every step issues arise related to the presence of naturally occurring radionuclides. The raw material originates from either underground mines or open pits.
The mined coal generally contains 238U and 232Th as well as their decay products and 40K. The concentration of these radionuclides varies by the geology of the area, but generally the radioactivity of the coal and the surrounding rocks are the same. Moreover, the activity concentration of these materials is generally not high (Table 6.2) in comparison to the average concentration in the Earth crust. Generally the world average concentrations of radium, thorium, and potassium in the Earth's crust are about 40 Bq/kg, 40 Bq/kg, and 400 Bq/kg, respectively (EC, 1999). The concentration of naturally occurring radionuclides is related to the sulfur and heavy metal content of the coal. Table 6.2 shows a summary of activity concentrations found in coals of various origin.
Table 6.2
226Ra, 232Th, and 40K activity concentrations in different types of coal
| Country | Radionuclide concentration (Bq/kg) | I-index | Number of samples | References | ||
| 226Ra | 232Th | 40K | ||||
| Australia | – | 27.5 | 20 | – | 6 | Cooper (2005), IAEA (2003) |
| Brazil | 130 | 62 | 340 | – | 49 | IAEA (2003) |
| Canada | – | 7.5 | 26 | – | 1 | Tracy and Prantl (1985) |
| China | 17.7 | 24.5 | 70.5 | 0.2 | 15 | Lu et al. (2006), Parami et al. (2010), and Tso and Leung (1996) |
| Germany | 32 | 21 | 225 | 0.3 | 1 | IAEA (2013a) |
| Hungary | – | – | – | – | 1 | IAEA (2013a) |
| India | 24 | 44 | 111 | – | 41 | Kazahaya et al. (2015), Mahur et al. (2008), Mandal and Sengupta (2005), and Shukla et al. (2005) |
| Indonesia | 7 | 2.9 | 47 | 0.1 | 2 | Parami et al. (2010) |
| Romania | 126 | 62 | – | – | 1 | IAEA (2013a) |
| Russian Federation | 28 | 12 | 120 | – | 401 | Arbuzov et al. (2011), Lissachenko and Obuchova (1982) |
| Serbia | – | 6.5 | – | – | 88 | Zivotic et al. (2008) |
| South Africa | 27.2 | 20.4 | 111 | 0.2 | 19 | Baeza et al. (2012) |
| The United Kingdom | 14 | 11.3 | 136 | – | 21 | Salmon et al. (1984) |
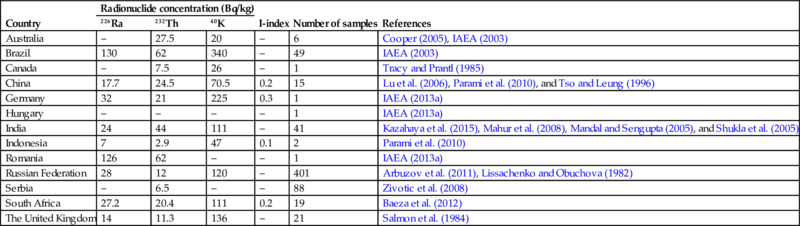
These values are the mean values of individual entries.
The I-index calculation is based on European Commission 1999; Radiation Protection 112; Radiological Protection Principles Concerning the Natural Radioactivity of Building Materials; and Directorate-General, Environment, Nuclear Safety and Civil Protection.
Note that the I-index, as proposed by Council Directive 2013/59/EURATOM, is only used for building materials. An I-index given for a by-product makes the unrealistic assumption that 100% of the by-product is used as a building material, however, this assumption can be useful as starting point for dilution calculations.
The “–” sign in the table indicates that there is no data available.
Both underground mining and open pits generate a huge amount of residues, which, if not managed properly, can cause an environmental threat in itself. Stockpiled residues can be affected by the weather conditions like rain and wind, and if not managed properly the naturally occurring radionuclides can be released into the atmosphere or to groundwater bodies. Specifically in the case of underground mining, there is always the possibility that the radon concentration in poorly ventilated spaces can increase, affecting the health of the miners. Other naturally occurring radionuclides, predominantly 226Ra, can be found in the waste rock and water streams in these facilities. Studies show that in some cases the 226Ra activity concentration of these waste streams can reach values up to 55 kBq/kg (IAEA, 2003).
After the mining process the coal is transported to the power plants, where the material is fired to generate electricity and in some cases heat.
In a typical coal-fired power plant, pulverized coal is burnt in a boiler and the heat is extracted as steam. The finely powdered coal is introduced into the combustion chamber as a mixture of coal and hot air. Steam is used to drive a turbine, which in turn, drives an electrical generator.
The fired coals contain naturally occurring radionuclides, so it is logic to assume that in the effluent streams of such facilities also show certain levels of naturally occurring radionuclides depending on specific stream and process conditions during firing.
6.3.1 Coal fly ash
6.3.1.1 Technical properties
Coal typically contains 5%–30% inert mineral material that remains as ash after burning (Cooper, 2005).
Coal fly ash is a fine, powdery material that is produced by burning coal to produce electricity, primarily in pulverized coal combustion boilers. It is composed mainly of noncombustible inorganic material but also contains some carbon that is a leftover from partially combusted coal. Although fly ash particles are generally largely spherical in shape, there are usually also irregularly shaped particles present, such as angular particles of quartz. The spherical shape of the fly ash particles results from the formation of tiny molten droplets as the ash travels through the boiler. The droplets form spheres because this shape minimizes the surface area relative to the volume.
Fine ash is collected by the electrostatic precipitators, fabric filters, and flue gas scrubbers. Due to the fineness of the fly ash, removal and collection from combustion gases (flue gas) requires this type of specialized equipment (Cooper, 2005).
By-products from coal firing, coal combustion products (CCPs), are produced in coal-fired power plants all over the world. The production of these CCPs is increasing worldwide by the higher demand for electricity due to growing population and economic development. In Europe, an additional factor that increases the volume and mass of CCP are the legal requirements for flue gas cleaning. The utilization of CCPs is an accepted practice in several countries of the world, based on a long-term experience and both technical as well as environmental benefits (Cooper, 2005).
Next to naturally occurring radionuclides also other components, such as Cd, Cr, Zn, and Pb, are present in the ashes that in some cases may induce an environmental risk (Jiao et al., 2016).
6.3.1.2 Radiological properties
The main NORM-related problem of coal firing is occurring during the combustion process, naturally occurring radionuclides can concentrate in the ashes. Because the radionuclides are, under given conditions, inert a significant amount will remain in the ash, thus enriching it. Typically the enrichment of naturally occurring radionuclides in the fly ash (Table 6.3) is more pronounced than in the bottom ash (Table 6.5). In some cases the 238U and 232Th activity concentrations in fly ash can be tenfold higher than in the used coal.
Table 6.3
NORM radionuclide activity in coal fly ash

These values are the mean values of individual entries.
The I-index calculation is based on European Commission 1999; Radiation Protection 112; Radiological Protection Principles Concerning the Natural Radioactivity of Building Materials; and Directorate-General, Environment, Nuclear Safety and Civil Protection.
Note that the I-index, as proposed by Council Directive 2013/59/EURATOM, is only used for building materials. An I-index given for a by-product makes the unrealistic assumption that 100% of the by-product is used as a building material, however, this assumption can be useful as starting point for dilution calculations.
The “–” sign in the table indicates that there is no data available.
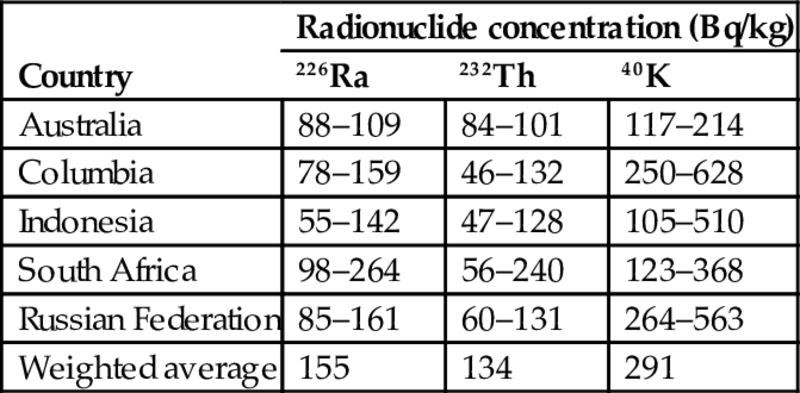
Most of the data presented in Table 6.3 are obtained in coal-producing countries. However, similar data are also available in coal-importing countries, which monitor continuously the content of radionuclides in coal fly ash, such as in Israel (NCAB, 2017). The data assembled in Table 6.4 are more updated than those reported in Table 6.3, and also present interesting information about statistical variation of activity concentrations in coal fly ash imported from different countries. The samples of fly ash were tested continuously by the same laboratory for the long period of follow-up (10 years).
Table 6.4
Statistical variation of activity concentrations in fly ash from the main sources of coal imported to Israel for the years 2005–15 (NCAB, 2017)
| Country | Radionuclide concentration (Bq/kg) | ||
| 226Ra | 232Th | 40K | |
| Australia | 88–109 | 84–101 | 117–214 |
| Columbia | 78–159 | 46–132 | 250–628 |
| Indonesia | 55–142 | 47–128 | 105–510 |
| South Africa | 98–264 | 56–240 | 123–368 |
| Russian Federation | 85–161 | 60–131 | 264–563 |
| Weighted average | 155 | 134 | 291 |
In fly ash and bottom ash from coal-burning plants significant disruption of radioactive equilibrium is observed among the radionuclides of 238U and 232Th, due to the different physicochemical properties of the respective elements. Lead-210 is enriched in fly-ash and depleted in bottom ash mainly due to the volatilization of lead in the combustion chamber. It is furthermore observed that 210Pb is especially enriched in the finer ash particles collected at the electrostatic precipitators toward the end of the flue gas pathway (Karangelos et al., 2004). As a result, the ratio of 210Pb/226Ra may be as much as 3 in finer fractions of fly ash and as much as 0.5 in bottom ash. Enrichment of other radionuclides such as 226Ra is also observed, though not so significant. It is worth noting that other elements follow the same behavior and their concentration is enriched in the finer fly ash fractions (Peppas et al., 2010).
The end-of-pipe filtering systems of these plants can efficiently remove solid contaminants containing naturally occurring radionuclides as they behave similar to the nonradiological chemical analogs. However, the volatile compounds like polonium and lead can escape these filtering systems. Mora et al (2011) reported airborne releases of ~3000 Bq/kg 210Po for a coal-fired power plant. Coal-fired power plants were also identified as contributing to the elevated levels of atmospheric radon (Parami et al., 2010).
In the case of a modern power plant, where more than 99% of the fly ash is filtered, most of the radioactive material remains within the bottom ash and fly ash. Upon monitoring the activity concentration of other radionuclides, such as 210Pb and 40K, even more pronounced enrichment can be observed in this case (IAEA, 2013a).
6.3.2 Coal bottom ash
6.3.2.1 Technical properties
The heavier, more refractory mineral matter settles at the bottom of the boiler as bottom ash or slag (Cooper, 2005). Coal bottom ash is primarily comprised of fused coarser ash particles. Frequently, these particles are quite porous and look like volcanic lava.
6.3.2.2 Radiological properties
Table 6.5 presents an overview of the concentrations of naturally occurring radionuclides in coal bottom ash for several countries. More information regarding the comparison of the radiological properties with coal fly ash can also be found in Section 6.3.1.2.
Table 6.5
NORM radionuclide activity in coal bottom ash
| Country | Radionuclide concentration (Bq/kg) | I-index | Number of samples | References | ||
| 226Ra | 232Th | 40K | ||||
| Australia | 110 | 120 | 80 | 0.99 | 3 | Cooper (2005) |
| Canada | – | 61 | 250 | – | 1 | Tracy and Prantl (1985) |
| China | 85 | 110 | 270 | 0.95 | 13 | Lu et al. (2006), Tso and Leung (1996) |
| Greece | 703 | 48.3 | 419 | 2.9 | 38 | Hasani et al. (2014), Papaefthymiou et al. (2007), and Simopoulos and Angelopoulos (1987) |
| Ireland | 29 | 4.4 | 110 | 0.16 | 1 | Organo et al. (2005) |
| Italy | 115 | 67 | 1050 | 1.07 | 1 | Hasani et al. (2014) |
| Philippines | 63.3 | 64 | 270 | 0.64 | 6 | Parami et al. (2010), Sahoo et al. (2011) |
| Serbia | 65 | 39 | 241 | 0.49 | 1 | Hasani et al. (2014) |
| Spain | 99.8 | 78.8 | 425 | 0.87 | 4 | Baeza et al. (2012) |
| Syria | 115 | – | – | – | 4 | Al-Masri and Haddad (2012) |
| The Netherlands | 90 | 114 | 248 | 0.96 | 7 | Ackers et al. (1985) |
| Turkey | 341 | 39.5 | 179 | 1.39 | 4 | Ayçik and Ercan (1997) Hasani et al. (2014) |
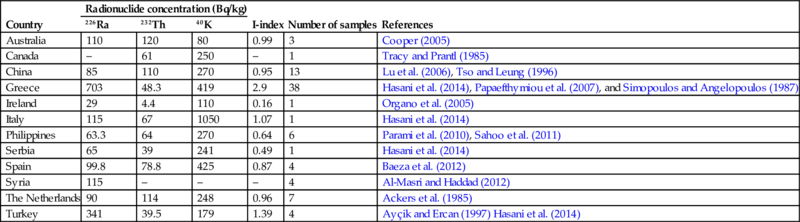
These values are the mean values of individual entries.
The I-index calculation is based on European Commission 1999; Radiation Protection 112; Radiological Protection Principles Concerning the Natural Radioactivity of Building Materials; and Directorate-General, Environment, Nuclear Safety and Civil Protection.
Note that the I-index, as proposed by Council Directive 2013/59/EURATOM, is only used for building materials. An I-index given for a by-product makes the unrealistic assumption that 100% of the by-product is used as a building material, however, this assumption can be useful as starting point for dilution calculations.
The “–” sign in the table indicates that there is no data available.
The information about statistical variation of activity concentrations in coal bottom ash imported in Israel is presented in Table 6.6.
Table 6.6
Statistical variation of activity concentrations in bottom ash from the main sources of coal imported to Israel for the years 2005–15 (NCAB, 2017)
| Country | Radionuclide concentration (Bq/kg) | ||
| 226Ra | 232Th | 40K | |
| Australia | 69–88 | 63–85 | 97–179 |
| Columbia | 45–103 | 28–81 | 145–465 |
| Indonesia | 37–65 | 29–66 | 231–375 |
| South Africa | 89–237 | 80–212 | 66–138 |
| Russian Federation | 59–109 | 35–93 | 180–519 |
| Weighted average | 143 | 121 | 269 |
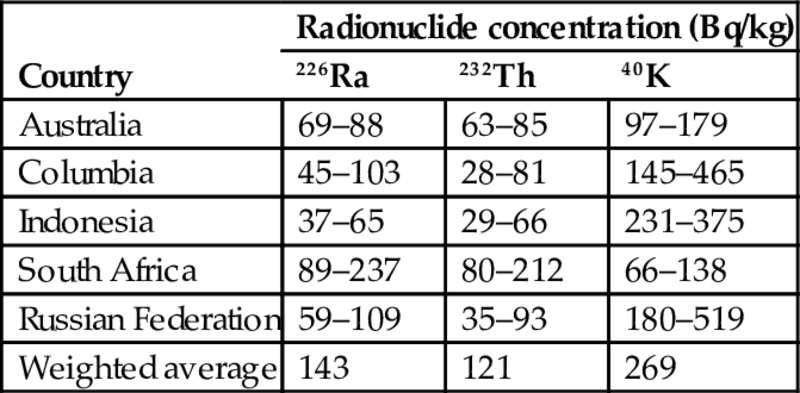
What is important—the activity concentrations of both coal fly ash and bottom ash vary in rather wide range (the coal in each country is produced usually in different mines and, as a result, the properties of ash, including the content of radionuclides, are expected to differ as well), although the maximum values never exceeded the activity concentrations accepted for exemption or clearance of naturally occurring radionuclides (see Table 6.1), which were far away from the measured values in both types of coal ash, fly and bottom.
It can be seen also that the weighted average of the population of bottom ash is slightly lower (by about 10% for each radionuclide measured), than that of fly ash (Table 6.4). At the same time, the difference between the two populations is not significant, taking into account a quite wide range of variation.
6.4 Ferrous industry: iron and steel production
The primary material for the iron and steel industry, mainly consists of a combination of iron oxides, coal and limestone (Cooper, 2005).
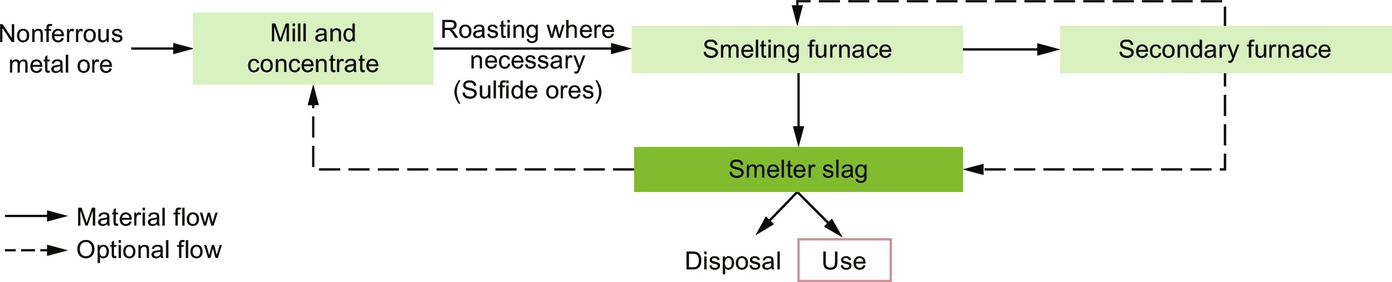
The blast furnaces (Fig. 6.5) produce iron by the reduction of various iron containing materials with a hot gas. The furnace is fed with iron ore, pellets, and/or sinter, flux and slag producing material such as limestone or dolomite, and coke for fuel. The blast air causes the iron oxides, flux, and coke to react and iron, carbon monoxide and blast-furnace slag is produced. The molten iron and blast-furnace slag is collected at the base of the furnace, while the gases are recirculated for fuel in the sinter process, after separation of particulate material (Cooper, 2005).
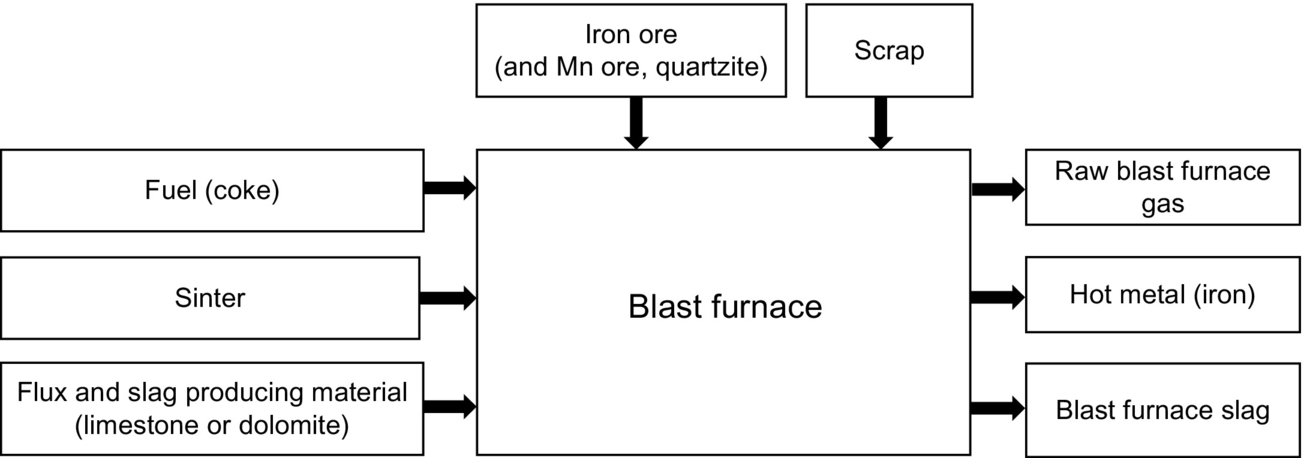
To produce 1 ton iron, 1.4 tons of ore, 0.5–0.65 tons of coke, 0.25 tons of flux, and 1.8–2 tons of air are necessary, while 0.2–0.4 tons of slag and 2.5–3.5 tons of blast-furnace gas are created as by-product (US EPA, 1995).
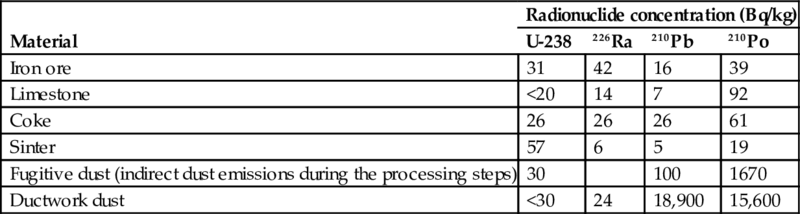
You can see the activity concentrations of several materials typically found in iron and steel production in Table 6.7.
Table 6.7
Radionuclide concentrations of input materials and produced dusts in iron and steel production (Cooper, 2005)
| Material | Radionuclide concentration (Bq/kg) | |||
| U-238 | 226Ra | 210Pb | 210Po | |
| Iron ore | 31 | 42 | 16 | 39 |
| Limestone | <20 | 14 | 7 | 92 |
| Coke | 26 | 26 | 26 | 61 |
| Sinter | 57 | 6 | 5 | 19 |
| Fugitive dust (indirect dust emissions during the processing steps) | 30 | 100 | 1670 | |
| Ductwork dust | <30 | 24 | 18,900 | 15,600 |
6.4.1 Slag from iron and steel
6.4.1.1 Technical properties
Slag is a by-product generated by the purification, casting, and alloying of metals. Namely, the metal ores (such as iron, copper, lead, and aluminum) in nature are found in an impure state, often oxidized and mixed with other metal silicates. During ore melting, when ore is exposed to high temperatures, such impurities are separated from the molten metal and can be removed. The collected and removed compounds consist of slag. With once-purified metal, during further processing (casting and alloying), substances are added to melt and enrich it, with reformed slag as a by-product in which all impurities are concentrated. Therefore, slag mainly consists of ore impurities (mainly silicon and aluminum) combined with calcium and magnesium from various supplements (Cooper, 2005).
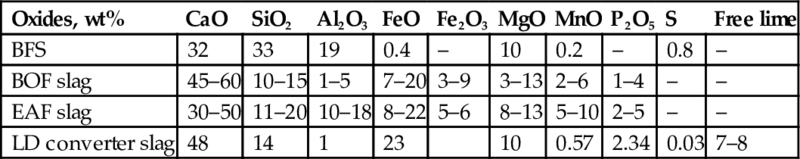
The composition and properties of slags depend on the kind of iron and steel-making process in which they are produced and on the type of ores that are used (Table 6.8). Different types of slags are generated in several stages of iron and steel production:
Table 6.8
Chemical composition of distinct slag generated by the primary steel making (Puertas, 1993; Brand and Roesler, 2015)
| Oxides, wt% | CaO | SiO2 | Al2O3 | FeO | Fe2O3 | MgO | MnO | P2O5 | S | Free lime |
| BFS | 32 | 33 | 19 | 0.4 | – | 10 | 0.2 | – | 0.8 | – |
| BOF slag | 45–60 | 10–15 | 1–5 | 7–20 | 3–9 | 3–13 | 2–6 | 1–4 | – | – |
| EAF slag | 30–50 | 11–20 | 10–18 | 8–22 | 5–6 | 8–13 | 5–10 | 2–5 | – | – |
| LD converter slag | 48 | 14 | 1 | 23 | 10 | 0.57 | 2.34 | 0.03 | 7–8 |
(1) during the pig iron production;
(2) in the blast furnace (see Fig. 6.5); and
(3) during the later steps of the steel production.
Blast-furnace slag (BFS) is “developed” in a molten condition simultaneously with iron in a blast furnace (Lewis, 1982). Such slag consists primarily of impurities of iron ore (mainly silica and alumina). The composition of slag depends on the composition of iron ore, fuel, flux stones, and mixing ratios required for efficient furnace operation. Different types of BFS can be produced that often find applications in construction (see Chapter 7):
(1) Ground granulated blast-furnace slag, obtained by quenching of molten iron slag in water or steam, is the main by-product from iron production used in construction (Lewis, 1982).
(2) Air-cooled blast-furnace slag is naturally cooled with moderate sprinkling.
(3) Pelletized blast-furnace slag is produced by means of a pelletizer with a spinning drum to cool the slag quickly (in dispersed form) with air and water (Virgalitte et al., 2000).
Steel slag is a by-product of the steel-making process formed from the reaction of flux such as calcium oxide with the inorganic nonmetallic components present in the steel scrap. Two types of steel slag can be distinguished:
(1) Basic oxygen furnace (BOF) steel slag.
(2) Electric arc furnace (EAF) steel slag.
The BOF process uses 25%–35% old steel (scrap), while the EAF process uses virtually 100% scrap to make new steel. In 2015, in the United States, BOF makes up ~40% and EAF makes up about 60% of the steel production.
After completion of the primary steel-making operations, steel produced by the BOF or EAF processes can be further refined to obtain the desired chemical composition. These refining processes are called secondary steel-making operations. Refining processes are common in the production of high-grade steels. The most important functions of secondary refining processes are final desulfurization; degassing of oxygen, nitrogen, and hydrogen; removal of impurities; and final decarburization (done for ultralow carbon steels). The final carburization takes place in a Ladle Furnace (LF) for refining. An LD (Linz and Donawitz) refining process can be carried out in an LD vessel and in this process LD converter slag is produced. Depending on the quality of the desired steel, molten steel produced in the EAF and BOF process goes through some or all of the above-mentioned refining processes (Brand and Roesler, 2015).
6.4.1.2 Radiological properties
An overview of naturally occurring radionuclides found in metallurgical slags in different countries is shown in Fig. 6.6.
Three potential sources (from the ores, sinter, or scrap) of naturally occurring radionuclides in the slag are discussed.
Iron ores due to their geochemical properties scavenge radionuclides and heavy metals resulting in only trace levels of uranium in the main raw materials for iron-making; iron ore and coke ranging of 20–30 Bq/kg and 5 Bq/kg for limestone (Cooper, 2005).
Another source of radioactivity in the slag is its accumulation of Pb and Po in the sinter plant. Due to the recycling of the waste gases through the sinter plant in order to reduce dust emissions, concentrations of 210Pb and 210Po become further enhanced in the exhaust (Cooper, 2005).
Natural and artificial radioactive materials are present in the metal scrap and could potentially be a source of natural and artificial radionuclides in the steel-making process (Sofilić et al., 2010). However, portal monitors are used intensively by scrap yard and steelworks in particular to avoid the melting of an artificial radioactive source and to avoid that as a result the steel might be contaminated by artificial radionuclides. As a consequence of the intense use of portal monitors also NORM is also often removed from the scrap.
Besides the dependence of the raw material used, the concentration of naturally occurring radionuclides in the BFS is also dependent on the industrial process (e.g., type of furnace) as discussed by Puch et al. (2005).
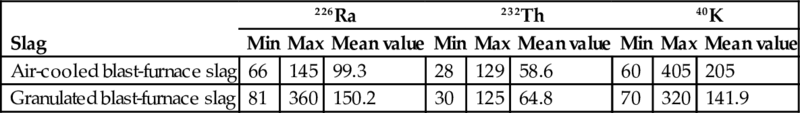
The activity concentration measurements for air-cooled blast-furnace slag and granulated blast-furnace slag underline the same magnitude for the mean values of both materials. The large range between the minimum and maximum values originates from the use of different raw materials in the different plants. The mean activity concentrations for the considered radionuclides are below or around 200 Bq/kg as presented in Table 6.9 (Puch et al., 2005). Table 6.9 demonstrates that blast-furnace slag contains relatively low levels of long-lived radionuclides from the uranium and thorium series. It was also reported that the 210Pb and 210Po levels in dust collected from the off-gases in the blast furnace are generally lower than those of the sinter plant. For more information regarding this aspect we refer to Puch et al. (2005).
Table 6.9
Activity concentration in different types of slag (in Bq/kg) (Puch et al., 2005)
| Slag | 226Ra | 232Th | 40K | ||||||
| Min | Max | Mean value | Min | Max | Mean value | Min | Max | Mean value | |
| Air-cooled blast-furnace slag | 66 | 145 | 99.3 | 28 | 129 | 58.6 | 60 | 405 | 205 |
| Granulated blast-furnace slag | 81 | 360 | 150.2 | 30 | 125 | 64.8 | 70 | 320 | 141.9 |
In Table 6.10 data are gathered from several studies on BFS in different European countries and larger ranges in activity concentrations are reported here for 226Ra, 232Th, and 40K.
Table 6.10
Activity concentrations of 226Ra, 232Th, and 40K in blast-furnace slag
| Country | Radionuclide concentration (Bq/kg) | I-indexa | Number of samples | References | ||
| 226Ra | 232Th | 40K | ||||
| Croatia | 251.2 | 24.8 | 214.2 | 1.03 | – | Sofilić et al. (2011) |
| Finland | 117 | 78.1 | 176 | 0.84 | 5 | Mustonen (1984) |
| Hungary | 115.2 | 36.4 | 228.5 | 0.64 | 2 | Gallyas and Torok (1984) |
| Poland | 115.33 | 34.55 | 192.33 | 0.62 | 368 | Żak et al. (2008) |
| Spain | 166 | 47.6 | 232.3 | 0.87 | 1 | Chinchon-Paya et al. (2011) |
| Turkey | 177.9 | 147.8 | 242.5 | 1.41 | 12 | Turhan (2008) |
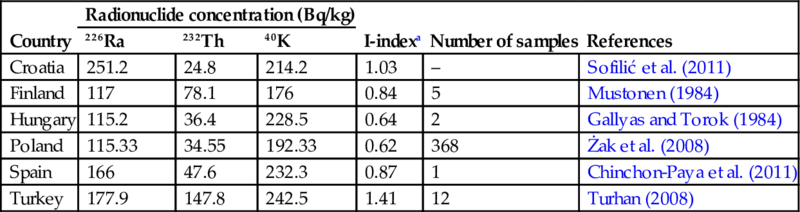
The I-index calculation is based on European Commission 1999; Radiation Protection 112; Radiological Protection Principles Concerning the Natural Radioactivity of Building Materials; and Directorate-General, Environment, Nuclear Safety and Civil Protection.
Note that the I-index, as proposed by Council Directive 2013/59/EURATOM, is only used for building materials. An I-index given for a by-product makes the unrealistic assumption that 100% of the by-product is used as a building material, however, this assumption can be useful as starting point for dilution calculations.
The “–” sign in the table indicates that there is no data available.
a These values are the mean values of individual entries.
6.5 Nonferrous industry
The nonferrous metals industry is of economic and strategic importance greater than its employment, capital, and turnover statistics indicate. Nonferrous metals and their alloys lie at the heart of modern life and many high-technology developments, particularly in the energy generation, computing, electronic, telecommunications, and transport industries, depend upon them.
This industrial sector aims mainly at the production of copper, aluminum, lead, tin, zinc, cadmium, nickel, cobalt, carbon and graphite, zircon, ferro-alloys, and phosphates. Both primary and secondary raw materials are used as input streams.
The output of the industry is either refined metal or what is known as semimanufactures, that is, metal and metal alloy cast ingots or wrought shapes, extruded shapes, foils, strips, rods, etc.
6.5.1 Nonferrous slag
6.5.1.1 Technical properties
Nonferrous slags are produced during the recovery and processing of nonferrous metal from primary and secondary raw materials. The nonferrous slags are molten by-products of high-temperature processes that are used to separate the nonferrous metal from other constituents. As a result of the melting of nonferrous metals, iron and silicon are separated to form a silicon-based slag. The resulting slag contains a high proportion of steel. When cooled, the molten slag converts to a rocklike or granular material.
The most common nonferrous slags are those originating from the processing of copper, nickel, phosphorus, lead, and zinc.
Copper production begins with ore milling and copper separation by flotation in order to produce a concentrate with a copper content of about 30%. The produced concentrates are smelted to remove volatile and other impurities and by further purification of the copper melt from the smelter, a primary form of the metal, known as blister copper is derived. Higher purity copper is then produced by electro-refining (Cooper, 2005). The main waste materials within this process are the tailings from the flotation stage and the furnace slags from the smelting stage.
Copper slag is produced during matte smelting and converting steps of pyrometallurgical production of copper from copper ores, when silica is added. It combines with the oxides to form silicates phases. The chemical composition of slag varies with the types of furnace or process of treatment (Cooper, 2005).
The origin of copper and nickel slag can be seen as the result of a multistep process, as shown in Fig. 6.7, and lead and zinc slags are formed in a very similar way. After initial processing (grinding), minerals are exposed to temperatures below their melting point. This process, called roasting, converts sulfur to sulfur dioxide. Then, reduction of the metal ion via the process of smelting is accomplished with the roasted product dissolved in siliceous flux. This melt is then desulfurized with lime flux, iron ore, or basic slag during the process of conversion, and then oxygen is lanced to remove other impurities.
Lead, lead-zinc, and zinc slag are formed during pyrometallurgical treatment of the sulfide ores. This process is similar to the production of copper and nickel slag, including roasting, smelting, and conversion.
Phosphorous slag is a by-product of the elemental phosphorus refining process. Elemental phosphorus in the EAF is added to flux materials to separate it from the phosphate-bearing rock. The flux additives, whose role during this process is the removal of impurities, are mainly silica and carbon. In addition to silica and carbon, iron can be added in the furnace, which combines with phosphorus to form ferrophosphorus. By the removal of ferrophosphorus (or only phosphorus, if iron is not added), slag is also created.
The amount of nonferrous slag produced in these processes is not as large as ferrous slag. Therefore, researchers have tended to focus their investigations on the larger-volume waste materials. Depending on the production process, the quantity of slag per produced quantity of metal can vary. It was estimated by Gorai et al. that for every ton of copper 2.2 ton of slag is produced (Gorai and Jana, 2003). Proctor et al. estimated that 220–370 kg blast-furnace slag is produced per ton of produced iron (Proctor et al., 2000).
6.5.1.2 Radiological properties
A lot of information regarding the radiological properties of nonferrous slags is included in the IAEA Safety Report Series 49, 2006. Information regarding the following types of nonferrous slag can be found here:
• Phosphorus Slag
• Lead, Lead-Zinc, and Zinc Slags
In Table 6.11 an overview is given of the activity concentrations (226Ra, 232Th, and 40K) reported for different types of nonferrous slags.
Table 6.11
Activity concentrations of 226Ra, 232Th, and 40K in nonferrous slag
| Slag type | Country | Radionuclide concentration (Bq/kg) | I-indexa | Number of samples | References | ||
| 226Ra | 232Th | 40K | |||||
| Tin slag | Germany | 1100 | 300 | 330 | 5.28 | – | Lehmann (1996) |
| Nickel slag | Poland | 234.57 | 44.9 | 604.7 | 1.21 | 3 | Żak et al. (2008) |
| Nickel slag | Germany | 52 | 78 | 76 | 0.59 | – | Lehmann (1996) |
| Lead slag | Germany | 270 | 36 | 200 | 1.15 | – | Lehmann (1996) |
| Copper slag | Poland | 316.78 | 54.16 | 886.46 | 1.62 | 80 | Żak et al. (2008) |
| Copper slag | Germany | 770 | 52 | 650 | 3.04 | – | Lehmann (1996) |
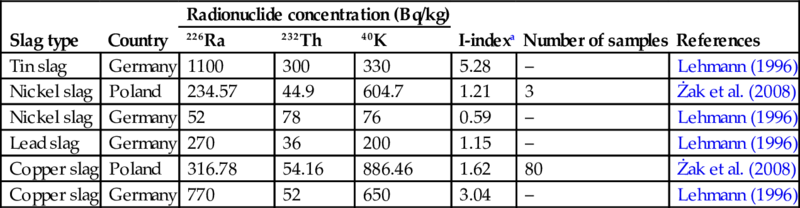
The I-index calculation is based on European Commission 1999; Radiation Protection 112; Radiological Protection Principles Concerning the Natural Radioactivity of Building Materials; and Directorate-General, Environment, Nuclear Safety and Civil Protection.
Note that the I-index, as proposed by Council Directive 2013/59/EURATOM, is only used for building materials. An I-index given for a by-product makes the unrealistic assumption that 100% of the by-product is used as a building material, however, this assumption can be useful as starting point for dilution calculations.
The “–” sign in the table indicates that there is no data available.
a These values are the mean values of individual entries.
Specifically, for the copper production partitioning of 210Pb and 210Po from uranium occurs into the copper concentrate during the smelting process. These radionuclides are vaporized at the smelting stage and may accumulate in dusts collected from off gases. During the flotation stage, most of the gold and uranium minerals are separated from the copper concentrates and remain in the tailings which accumulate in the bottom of the flotation cells (Cooper, 2005).
Uranium and thorium may be present in significant quantities in the copper minerals. Where the uranium content of the original ore is sufficiently high to the level of commercial exploitation, additional treatment and processing of tailings should take place using hydrometallurgy (mainly acid leaching) to recover uranium concentrates. Otherwise the uranium minerals will remain within the tailings (Cooper, 2005).
6.5.2 Bauxite residue also known as red mud
6.5.2.1 Technical properties
Red mud is a waste produced during the Bayer method in bauxite refining, where digestion of pulverized bauxite with sodium hydroxide at elevated temperatures and pressures takes place. It is a highly alkaline (pH=10–12.5) slurry with 15–30 wt% of solids. After drying, the material produced is also found in literature as bauxite residue (Gu et al., 2012).
Red mud is composed mainly of fine particles of silica, aluminum, iron, calcium, and titanium oxides in different proportions dependent upon the bauxite ore, aluminum extraction conditions, and quality control. Table 6.12 shows the constituent differences which are attributed to the type of bauxite ores and process conditions (Gu et al., 2012). Iron oxides (typically hematite) provide the red color to the mud.
Table 6.12
Main chemical composition (wt%) of red mud from different countries (Gu et al., 2012)
| Components | Al2O3 | SiO2 | Fe2O3 | CaO | TiO3 | Na3O | K3O | MgO | LOI | Other | Total |
| Spanish red mud | 20.2 | 7.5 | 47.8 | 6.2 | 9.9 | 8.4 | 0.1 | 0.3 | 5.1 | – | 100.5 |
| Greek red mud | 19.9 | 6.8 | 40.8 | 12.6 | 5.8 | 2.7 | 0.1 | 0.2 | 10.5 | 0.5 | 100.1 |
| Greek red mud | 17 | 7.8 | 44.3 | 11.6 | 5.1 | 3.2 | 0 | 0.5 | 9.8 | – | 99.5 |
| Italian red mud | 20 | 11.6 | 35.2 | 6.7 | 9.2 | 7.5 | 0 | 0.4 | 7.3 | 2.1 | 100 |
| Birac red mud | 14.1 | 11.5 | 48.5 | 3.9 | 5.4 | 7.5 | 0 | 0 | 7.2 | 0.6 | 99 |
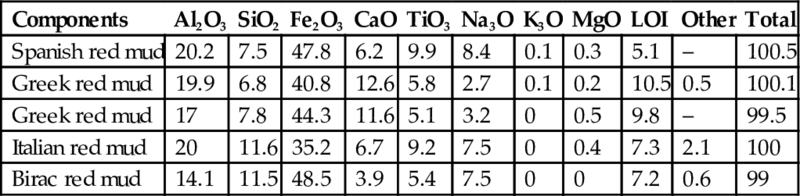
Table 6.13 shows approximate estimations of bauxite residue quantities produced per year and the size of bauxite residue disposal area (BRDA) for Western European alumina refineries. These estimations are based on the assumption that ~1.5 tons of residues are produced per ton of alumina (Bonomi et al., 2016). It should be noted, however, that the ratio of bauxite residue per ton of alumina can vary significantly. It can be as little as 0.3ton of residue per 1 ton of alumina or up to 2.5 tons of residue per 1 ton of alumina in case of low-grade ores. Western European refineries tend to use higher-grade bauxites so the resulting residue quantity is probably relatively smaller (European Aluminium Association, 2014).
Table 6.13
Approximate estimations of bauxite residue quantities produced per year and bauxite residue disposal area
| Refinery | Disposal period | Disposal method | Residue production rate (kton/year) | BRDA (ha) |
| Stade | For 1973 | Ponds disposal | 1500 | 150 |
| Gardanne | 1893–2012 | Sea discharge | 690 | |
| 2012–14 | Sea discharge/dry stacking | n.d. | 29.4 | |
| San Ciprian | 1981–2014 | Dry stacking | 2175 | 84 |
| Aughinish | For 1983 | Dry stacking | 3000 | 121 |
| Aluminium of Greece | 1966–2012 | Sea discharge/dry stacking | 1200 | 19 |
| 2012–14 | Dry stacking | 749 | ||
| Eurallumina | 1977–2009 | Ponds disposal | 1200 | 120 |
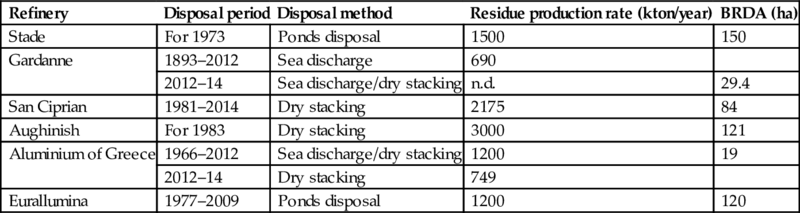
There is an annual 90–120 million tons bauxite residue production in the alumina industry. The existing size of world by-products so far is over 2.7 billion tons (Nuccetelli et al., 2015; Ruyters et al., 2011). Bauxite residues are being produced in a number of EU countries (e.g., France, Germany, Greece, Ireland, Romania, Spain) in addition to a great number of legacy sites in countries that no longer are producing aluminum (Nuccetelli et al., 2015). Traditionally these by-products are stockpiled by wet or dry methods. The sea discharge method has been abandoned due to its environmental effects. The factors causing problems during deposition of red mud using wet or dry methods are mainly related to the physical mass disposed and deposition field sizes required. Other problems regarding the use relate to the alkalinity, presence of trace toxic compounds, the presence of trace heavy metals, and radioactivity content. Depending on aspects as mentioned earlier, these legacy sites can pose a significant problem to the environment and society as a whole (Hegedus et al., 2016).
6.5.2.2 Radiological properties
The activity concentration (226Ra, 232Th, and 40K) of the bauxite ores, depending of its country of origin, is given in Table 6.14.
Table 6.14
Activity concentrations for 226Ra, 232Th, and 40K in Bauxite (Bq/kg)
| Country | Radionuclide concentration (Bq/kg) | I-index | Number of samples | References | ||
| 226Ra | 232Th | 40K | ||||
| Australia | 57 | 421 | 28 | 0.62 | 4 | Hassan et al. (2011), Iwaoka et al. (2009), and O'connor et al. (2013) |
| Brazil | 769 | 98 | 13 | 0.68 | 2 | Georgescu et al. (2005), Righi et al. (2009) |
| China | 370 | 420 | 91 | 3.36 | 5 | Righi et al. (2009) |
| Guinea | 159 | 175 | – | – | 5 | Abbady and El-Arabi (2006), Georgescu et al. (2005) |
| Guyana | 68 | 230 | 24 | 1.38 | 3 | Righi et al. (2009) |
| Hungary | 419 | 256 | 47 | 2.69 | 46 | Somlai et al. (2008) |
| India | 68 | 510 | – | – | 5 | Abbady and El-Arabi (2006) |
| Indonesia | 56 | 170 | 27 | 1.05 | 1 | Iwaoka et al. (2009) |
| Turkey | 17.1 | 19.8 | 43.2 | 0.17 | 2 | Turhan (2008) |
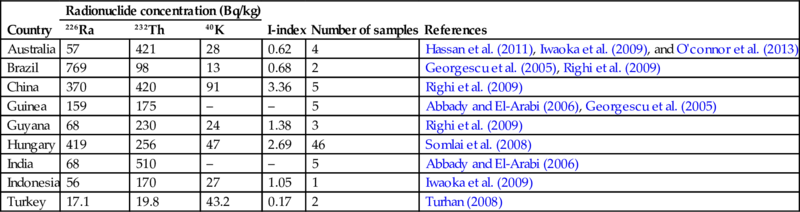
These values are the mean values of individual entries.
The I-index calculation is based on European Commission 1999; Radiation Protection 112; Radiological Protection Principles Concerning the Natural Radioactivity of Building Materials; and Directorate-General, Environment, Nuclear Safety and Civil Protection.
Note that the I-index, as proposed by Council Directive 2013/59/EURATOM, is only used for building materials. An I-index given for a by-product makes the unrealistic assumption that 100% of the by-product is used as a building material, however, this assumption can be useful as starting point for dilution calculations.
The “–” sign in the table indicates that there is no data available.
For bauxite residue, red mud, the activity concentration (226Ra, 232Th and 40K), depending of its country of origin, is given in Table 6.15.
Table 6.15
NORM radionuclide activity in Red mud
| Country | Radionuclide concentration (Bq/kg) | I-index | Number of samples | References | ||
| 226Ra | 232Th | 40K | ||||
| Australia | 318 | 1320 | 190 | 7.3 | 5 | Nuccetelli et al. (2015), O'connor et al. (2013) |
| Belgium | 550 | 640 | – | – | 1 | Xhixha et al. (2013) |
| Brazil | 139 | 350 | 45 | 2.2 | 1 | Nuccetelli et al. (2015) |
| China | 380 | 507 | 361 | 3.9 | 5 | Nuccetelli et al. (2015) |
| Germany | 156 | 216 | – | – | 2 | Nuccetelli et al. (2015), Xhixha et al. (2013) |
| Greece | 306 | 408 | 33 | 3.1 | 3 | Nuccetelli et al. (2015), Xhixha et al. (2013) |
| Hungary | 289 | 285 | 121 | 2.3 | 64 | Hasani et al. (2014), Nuccetelli et al. (2015), Somlai et al. (2008), and Xhixha et al. (2013) |
| Italy | 97 | 118 | 15 | 0.9 | 1 | Nuccetelli et al. (2015) |
| Jamaica | 708 | 339 | 300 | 4.2 | 2 | Nuccetelli et al. (2015) |
| Romania | 566 | 434 | – | – | 4 | Georgescu et al. (2005), Xhixha et al. (2013) |
| Turkey | 210 | 539 | 112 | 3.4 | 2 | Nuccetelli et al. (2015), Xhixha et al. (2013) |
| Ukraine | 165 | 328 | 53 | 2.2 | 1 | (U.D.C. 691.5) |
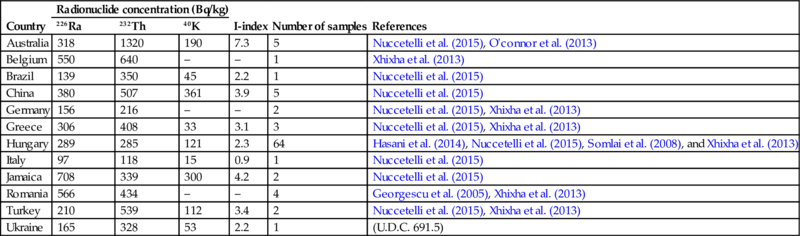
These values are the mean values of individual entries.
The I-index calculation is based on European Commission 1999; Radiation Protection 112; Radiological Protection Principles Concerning the Natural Radioactivity of Building Materials; and Directorate-General, Environment, Nuclear Safety and Civil Protection.
Note that the I-index, as proposed by Council Directive 2013/59/EURATOM, is only used for building materials. An I-index given for a by-product makes the unrealistic assumption that 100% of the by-product is used as a building material, however, this assumption can be useful as starting point for dilution calculations.
The “–” sign in the table indicates that there is no data available.
There have been several accidents involving red mud depositories, such as the Ajka accident in October 2010, Hungary, and the Luoyang incident in August 2016, China. In the case of the Ajka incident it has been estimated that 800 ha of agricultural land has been contaminated by a 5–10 cm red mud cover layer (Ruyters et al., 2011). The 238U and 232Th activities present in the red mud were 5–10-fold above the soil background values and through the EU project INTAILRISK the radiation risks from red mud has been estimated. The main dose contributor as for the surrounding population has been identified as the indoor radon. The gas phase of Hungarian red mud deposits may contain radon up to 300 kBq/m3, roughly 10 times the background values. A mixture of red mud with normal soil yields increased radon concentration in the soil, causing additional indoor radon exposure (Ruyters et al., 2011).
6.5.3 Aluminum dross
6.5.3.1 Technical properties
The recycling of aluminum generates slag and dross, both normally classed as hazardous wastes. Dross, as solid impurities floating on the molten metal, can be distinguished from slag.
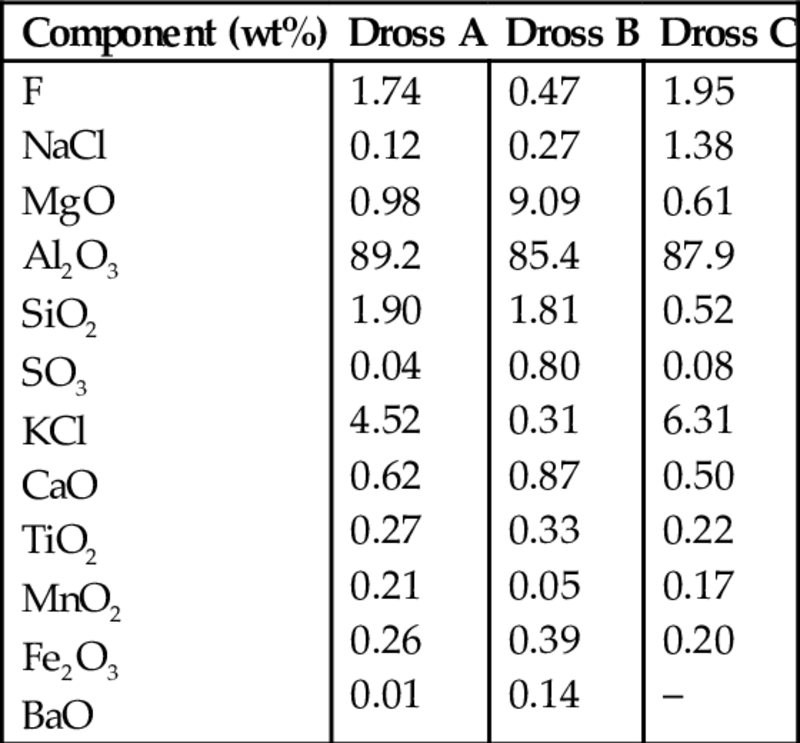
Aluminum dross is formed on the surface of molten aluminum or its alloys, by oxidation. Typical dross generation from a primary operation can be from 0.8 wt% to 1.3 wt% of aluminum output, while from secondary smelters it can reach up to 10% (Galindo et al., 2015). There are two forms of dross: (a) white dross and (b) black dross. White dross is formed during refining of primary Al, while black dross is formed when secondary/recycled aluminum is refined, where a relatively large amount of chloride salt flux is used. Subsequently, the dross is processed in rotary kilns to recover the Al, and the resultant salt cake is sent to landfills (Chen, 2012). As a whole, the aluminum industry produces ~3.2 million tons of dross annually from domestic aluminum smelting (Taylor et al., 2009). Chemical and mineralogical compositions of raw aluminum dross wastes produced in Turkey are given in Tables 6.16 and 6.17 (Gunay et al., 2008).
Table 6.16
Chemical analysis of dross from different foundries in Turkey (Gunay et al., 2008)
| Component (wt%) | Dross A | Dross B | Dross C |
| F NaCl MgO Al2O3 SiO2 SO3 KCl CaO TiO2 MnO2 Fe2O3 BaO | 1.74 0.12 0.98 89.2 1.90 0.04 4.52 0.62 0.27 0.21 0.26 0.01 | 0.47 0.27 9.09 85.4 1.81 0.80 0.31 0.87 0.33 0.05 0.39 0.14 | 1.95 1.38 0.61 87.9 0.52 0.08 6.31 0.50 0.22 0.17 0.20 – |
6.5.3.2 Radiological properties
Regarding aluminum dross only a limited amount of information on the radiological properties is available. Abbady and El-arabi (2006) discussed the NORM aspects of Egyptian aluminum dross tailings. For the tailings they found average activity concentrations (9 investigated samples) of 8.5±0.8 Bq/kg and 10.7±1.2 Bq/kg for, respectively, 226Ra and 232Th (Abbady and El-Arabi, 2006). These activity concentrations are very low in comparison to the world average concentrations of radium (40 Bq/kg) and thorium (40 Bq/kg) in the Earth's crust (EC, 1999) or in the European soil (Table 6.20).
6.5.4 Zircon and zirconia
6.5.4.1 Technical properties
Zirconium (chemical element with symbol Zr) is relatively abundant within the Earth's crust (it is the 18th most abundant element, three times more abundant than copper) and is mined from mineral sands. In mineral sands it is primarily present as the mineral zircon (=ZrSiO4) and more rarely as the mineral baddeleyite. The mineral baddeleyite is the naturally occurring form of the compound zirconia (=ZrO2). Most commercial zirconium minerals are produced in Australia, South Africa, and the United States. Zircon is by far the leading zirconium ore; baddeleyite is much more rare and is currently mined only in Russian Federation, while caldasite, a mixture of baddeleyite and zircon can be found in Brazil (IAEA, 2007a).
The typical density of the mineral zircon is between 4200 and 4800 kg/m3. The mineral has a low chemical reactivity, a melting point well over 2000°C, a high-refractive index (1.80–1.98), and a hardness higher than quartz (Mohs hardness of 7) (IAEA, 2007a).
Considering mineral sands that are commercially used then the typical premium grade commercial “zircon sand” consists of 66% ZrO2 (including ~2% HfO2), 32% SiO2, 0.1% TiO2, 0.5% Al2O3, and 0.05% Fe2O3. Most commercial zircon sands have a median diameter of 110–130 μm with a typical range in particle diameter of 100–200 μm. For many applications, this has to be reduced by milling to create zircon flour or micronized zircon (IAEA, 2007a).
Several processes (also shown in Fig. 6.8) are used to convert zircon (=ZrSiO4) into zirconia (=ZrO2) and other compounds:
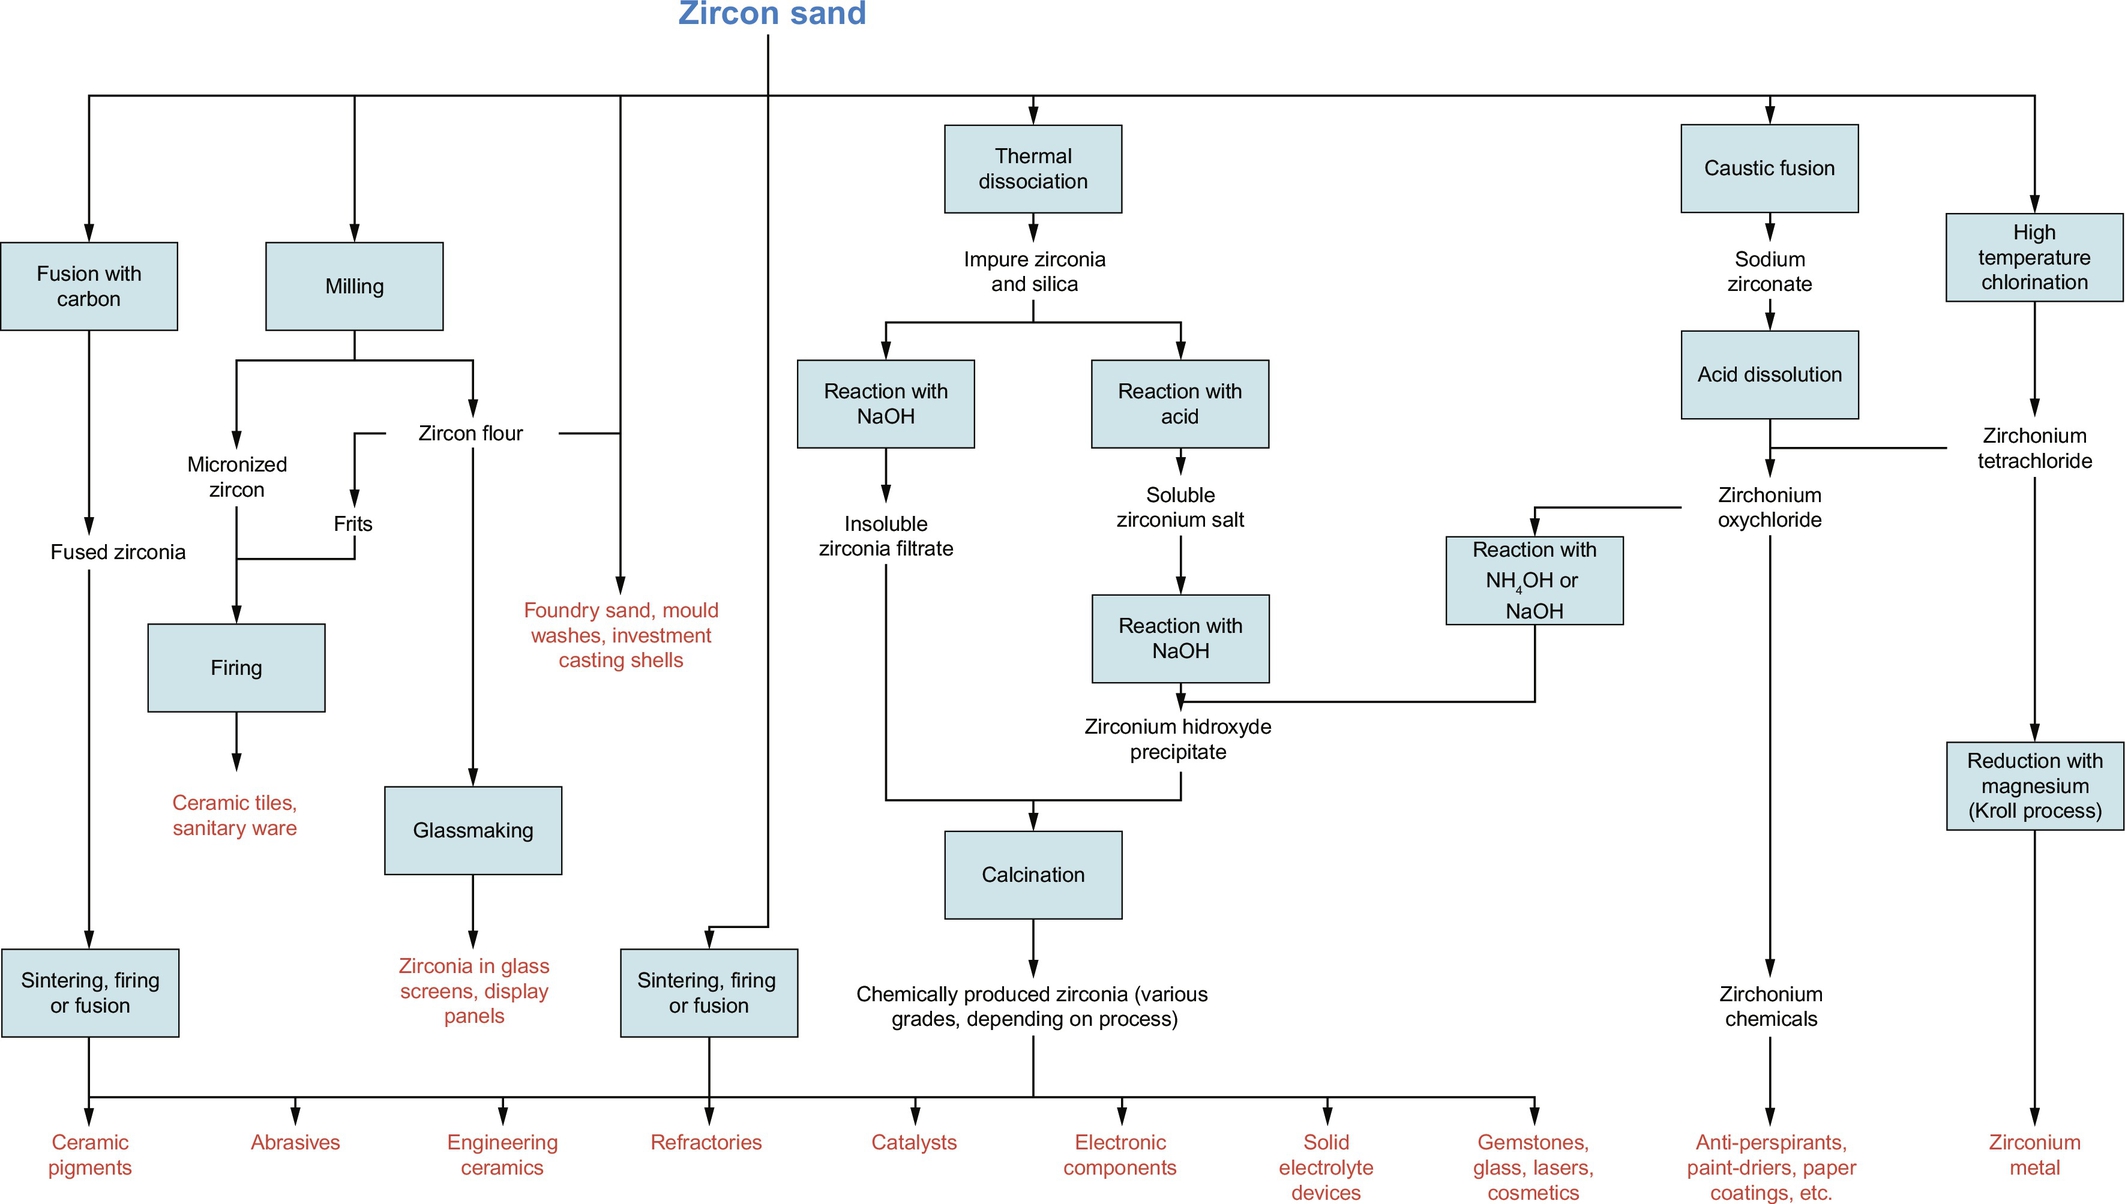
(a) In a thermal process zircon is melted with coke at 2800°C in an EAF. The carbon reduces the zircon to zirconia (commercial name: “fused zirconia”) and silicon monoxide. Silicon monoxide, being unstable, is rapidly oxidized to silica, which comes off the process as a silica fume. Stabilizing elements are added to the melt to produce the desired composition. The molten product is tapped from the furnace, cast into blocks and crushed to the desired particle size range (IAEA, 2007b).
(b) Heating zircon at 1800°C or more results in the breaking of zircon into its components ZrO2 and SiO2. In a next step the zirconia component is purified chemically and a zirconia of higher purity is produced (IAEA, 2007a).
(c) Reaction of zircon with sodium hydroxide at 700°C (caustic fusion) and dissolution in hydrochloric acid to form octahydrate (ZrOCl2·8H2O), for high-purity zirconia and zirconium chemical production (IAEA, 2007a).
(d) Chlorination of zircon at 1200°C in the presence of carbon in order to produce zirconium tetrachloride. Zirconium tetrachloride is then used for zirconium metal manufacture by reduction with magnesium or for the production of other chemicals (IAEA, 2007a).
For more detailed information the IAEA Safety Series No. 51, 2007 can be consulted.
6.5.4.2 Radiological properties
All zircon sands contain low levels of natural occurring radionuclides; however, these are significantly higher than average concentrations in normal rocks and soil. Activity concentrations in the natural zircon sands and the mineral zircon are shown in Table 6.18.
Table 6.18
NORM radionuclide activity in Zircon (A) and Zircon sand (B)
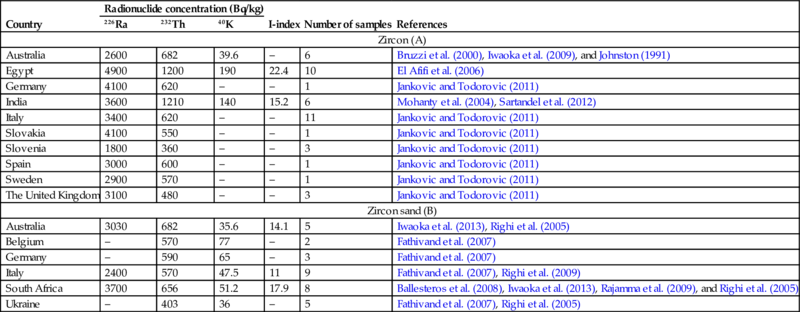
These values are the mean values of individual entries.
The I-index calculation is based on European Commission 1999; Radiation Protection 112; Radiological Protection Principles Concerning the Natural Radioactivity of Building Materials; and Directorate-General, Environment, Nuclear Safety and Civil Protection.
Note that the I-index, as proposed by Council Directive 2013/59/EURATOM, is only used for building materials. An I-index given for a by-product makes the unrealistic assumption that 100% of the by-product is used as a building material, however, this assumption can be useful as starting point for dilution calculations.
The “–” sign in the table indicates that there is no data available.
The activity concentrations of 238U and 232Th series radionuclides in commercially available zircon are between 2–4 and 0.4–1 kBq/kg, respectively. Baddeleyite shows a greater variation, the activity concentrations of 238U and 232Th series radionuclides vary between 3–13 and 0.1–26 kBq/kg, respectively. Data for 210Po suggest a possible disequilibrium at the lower end of the uranium decay chain in some cases, especially for baddeleyite samples (IAEA, 2007a).
The data collected in the NORM4Building database (Table 6.18) correspond to the data discussed in IAEA Safety Series No. 51, 2007. The activity concentrations exceeding 1 kBq/kg cause all activities involving zircon or baddeleyite in Member States of the European Union to be considered for regulation under the EU-BSS.
The milling of zircon is used by more than 70% of zircon users. The main exposure pathways from this process are external exposures from storage of raw materials and products, inhalation exposures from plant leaks, bagging operations, and process cleanups (IAEA, 2007b).
In a thermal process (such as process “(a)” as discussed before), when zircon is melted at 2800°C in an EAF, typical radionuclide activity concentrations found are 3–4.5 Bq/g for 238U in the raw zircon, 4.5–6.8 Bq/g for 238U in the zirconia, and about 6 Bq/g for 226Ra in the silica fume. The high temperatures used in this process destroy the crystal structure and allow the more volatile elements to be partially removed into the silica fume. Consequently, the fume may be enriched in 226Ra, 210Po, and 210Pb. The zirconia phase retains the high-boiling point elements such as uranium and thorium. In this way the radiological equilibrium between radionuclides in the 238U and 232Th decay chain is disturbed for the different (by-)products. Exposure pathways in this process are (a) external radiation from the raw material, from product storage, and from maintenance of the silica fume collector systems and (b) inhalation exposure from silica fume and zirconia dust during the milling and bagging operations. Radon exposure is usually insignificant with well-ventilated storage. Typical annual effective doses received by workers in a thermal zirconia plant are 70–260 μSv from external exposure and 600–3000 μSv from dust inhalation, giving a total annual effective dose of 700–3100 μSv (IAEA, 2007b).
The annual effective dose received by a worker in a chemical zirconia processing plant (using processes such as “(c)” and “(d)” as described above) is usually less than 1 mSv. However, because of the possibility of reaching the 1 mSv level and also because of the potential public exposure from radionuclide containing wastes, it is likely that these plants would require registration (IAEA, 2007b).
6.6 Phosphate industry
The phosphate industry has a crucial role in providing the world with food through supporting intensive agriculture, namely the phosphate fertilizer production.
Safety report No. 78 “Radiation protection and Management of NORM residues in the Phosphate Industry,” published by the IAEA in 2013, gives a very extensive overview regarding the radiological properties and the management of NORM residues from the phosphate industry.
Three main production steps are used to convert phosphate ore into commercial products (IAEA, 2013b):
(1) Mining and initial treatment (reduction) of the phosphate ore to produce phosphate rock.
(2) Predominately, two types of processes are used for further processing of the phosphate rock:
(a) Wet acid digestion processes are used to convert 85% of phosphate rock into intermediate or final products.
(b) An EAF is used for direct thermal conversion of the phosphate rock into elemental phosphorus. This “thermal process” is only applied on a minor fraction of the phosphate rock.
(3) After further chemical processing the produced phosphoric acid, that is produced in case of a wet acid digestion process, is converted into fertilizer products, animal feed supplements, and a variety of other products.
The phosphate ores (mainly various types of apatite), especially the sedimentary types, contain a wide range of contaminants, such as uranium, radium, polonium, thorium, and lead radioisotopes. Typical radionuclide activity concentrations in phosphate ores are in the range of less than 1 up to several Bq/g. The UNSCEAR indicates an average of 1500 Bq/kg for 238U in sedimentary phosphate ore deposits (UNSCEAR, 1988, 1993).
6.6.1 Phosphogypsum
6.6.1.1 Technical properties
Considering the processing of the phosphate rock (IAEA, 2013b):
(1) For 71% of the phosphate rock processing, a wet process, involving the production of phosphoric acid, is used for the acid digestion and in most cases large amounts of phosphogypsum are produced as a by-product.
(2) 24% of the phosphate rock is processed directly into fertilizer (so not by means of indirect processing via phosphoric acid).
(3) 5% of the phosphate rock is converted directly into other types of products.
During the wet production process, the contaminants are distributed between the different (by-)products depending on the type of acid (sulfuric acid, hydrochloric acid, or nitric acid) used for digestion. In the case of sulfuric acid digestion, which is frequently used for fertilizer production, one processing road leads via the production of phosphoric acid and phosphogypsum and the following reaction can occur (IAEA, 2013b):

For a complete overview of the different production streams that result from phosphate rock processing, we refer to IAEA (2013b).
6.6.1.2 Radiological properties
During the wet production process involving the production of phosphoric acid, the amount of radionuclide going into each fraction can vary depending on the used technology. In general most of the uranium eventually remains in the fertilizer, radium is more evenly distributed between the (by-)products and can partly remain (be precipitated) inside the plant, while most of polonium is removed with the phosphogypsum fraction (IAEA, 2013b).
The specific concentrations of naturally occurring radionuclides in the phosphogypsum depend on the origin and the chemical treatment of the phosphate ore (IAEA, 2013b).
An overview of the average activity concentrations of naturally occurring radionuclides in phosphogypsum from several countries, extracted from the NORM4Building database, is given in Table 6.19.
Table 6.19
NORM radionuclide activity in Phosphogypsum
These values are the mean values of individual entries.
The I-index calculation is based on European Commission 1999; Radiation Protection 112; Radiological Protection Principles Concerning the Natural Radioactivity of Building Materials; and Directorate-General, Environment, Nuclear Safety and Civil Protection.
Note that the I-index, as proposed by Council Directive 2013/59/EURATOM, is only used for building materials. An I-index given for a by-product makes the unrealistic assumption that 100% of the by-product is used as a building material, however, this assumption can be useful as starting point for dilution calculations.
The “–” sign in the table indicates that there is no data available.
In the NORM4Building database, for phosphogypsum in particular, there is less data available for fewer countries in comparison with natural gypsum. Concerning natural gypsum, the database contains measurements relevant to 502 samples from 16 EU Member States. The mean value (and ranges) for natural gypsum is 15 (1–70)Bq/kg for 226Ra, 9 (1–100)Bq/kg for 232Th, and 91 (5–279)Bq/kg for 40K. The activity concentration of natural gypsum is generally lower than the average level in European soil (Table 6.20); therefore, this material is not the most relevant from a radiation protection point of view.
Table 6.20
226Ra, 232Th, and 40K activity concentrations in European natural gypsum and comparison with the European soil (Trevisi et al., 2012)
| 226Ra | 232Th | 40K | |
| Natural gypsum | 15 (1–70) | 9 (1–100) | 91 (5–279) |
| European soil | 36 (0–1000) | 34 (1–258) | 483 (0–3200) |
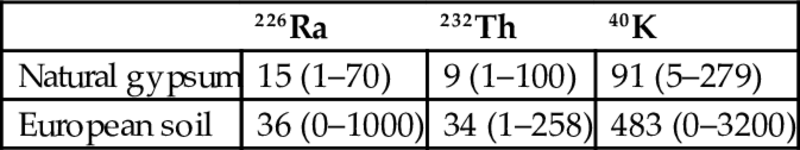
Average activity concentrations in natural gypsum are much lower than in average European soil.
Phosphogypsum, however, is slightly more radioactive than natural gypsum. The radium is found in the latticework of gypsum crystals in the form of radium sulfate, the salt of extremely low solubility (Kovler et al., 2005). Radium naturally associated with phosphate rock becomes associated with the phosphogypsum after the rock is reacted with sulfuric acid.
Regarding phosphogypsum, it is known that, due to its origin, it contains high levels of 226Ra and low levels of 232Th and 40K (see Table 6.19). All 226Ra national averages range from one to several hundred Bq/kg, UK heading them all with an average higher than one thousand, and the maximum value higher than that of concrete made with alum shale (Trevisi et al., 2012). Concerning 40K, both national averages and maximum values are in many cases lower than those of brick, concrete, and cement (Trevisi et al., 2012).
6.7 Conclusions
This chapter gives a concise overview about the technical, chemical, and radiological properties of by-products from coal mining and combustion, ferrous and nonferrous industries, and from the phosphate industry. The focus is in particular on by-products with interesting properties for use in construction.
The main part of the data given and discussed in this chapter was extracted from the NORM4Building database, after manual verification. The database is being constructed with the aid of an automated data mining by the COST network Tu1301 “NORM4Building.”
The activity concentrations for several of the by-products considered in this chapter are higher than the exemption/clearance levels (1 kBq/kg for natural radionuclides from the 238U and 232Th series and 10 kBq/kg) proposed by the EU-BSS. Several of these by-products can therefore be considered as NORM and care needs to be taken to assure that upon application the dose to workers and the public is below 1 mSv/y.
In Chapter 7 the considered by-products are further evaluated for the use in buildings taking into account the activity concentration index and the 1 mSv/y reference level for indoor external exposure to gamma radiation from building materials and radon.
Annex A Crystalline, granulated and expanded of foamed slag
Depending on the cooling and solidification method of the molten masses (those from the processing of ferrous and nonferrous metals), there are a few basic types of slag, as shown in Fig. 6.9.
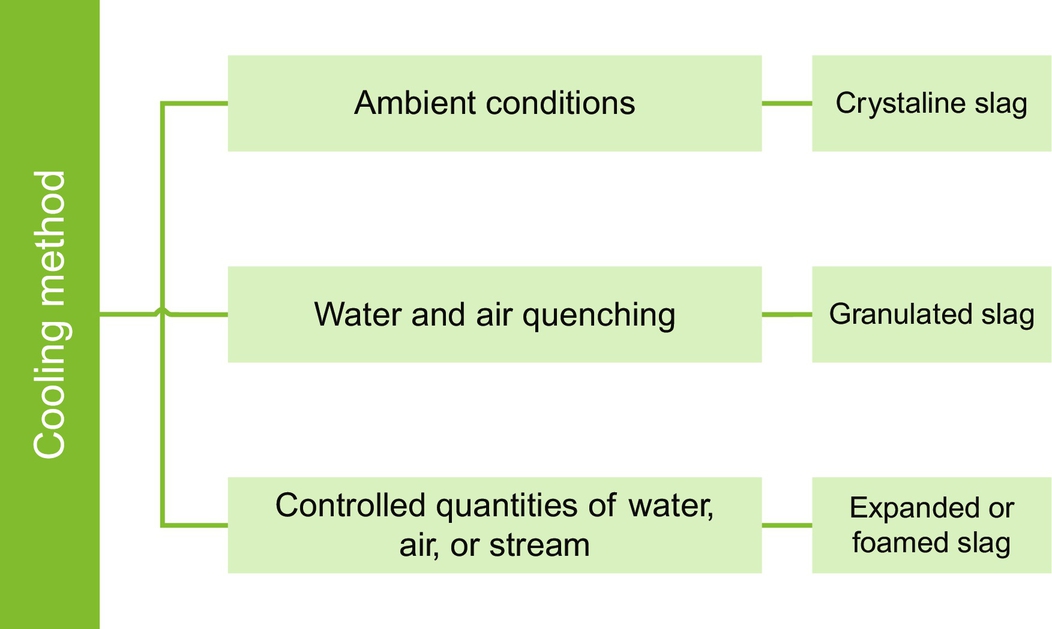
Crystalline slag is obtained by casting in a trench and cooling to ambient conditions. Upon mass solidification, cooling can be accelerated by sprays of water, which results in the formation of cracks within the mass and thus facilitates subsequent crushing. This product is mainly crystalline (as indicated by the name), with a cellular or vesicular structure as a result of gas bubbles that formed in the molten mass (Lewis, 1982).
Granulated slag is formed by quickly quenching (chilling) molten slag with water or air to produce a glassy state, with little or no crystallization. After the granulated blast-furnace slag is formed, it must be dewatered, dried, and ground up before it is used as a cementitious material. Magnets are often used before and after grinding to remove residual metallic iron (Virgalitte et al., 2000). As a result of this process, sand-size particles and friable material like clinker are formed. The physical structure and gradation of the resulting slag depend on the chemical composition and temperature of the molten mass during cooling. Sand-size grains resembling dense glass are produced, and they contain oxides that are found in Portland cement, with a significant difference in the proportion of calcium and silicon. Like Portland cement, it has excellent hydraulic properties and, with a suitable activator (such as calcium hydroxide), it will set in a similar manner (Lewis, 1982). The rate of reaction increases with the fineness. Typically, this slag is ground to an air-permeability (Blaine) fineness exceeding that of Portland cement to obtain increased activity at early ages (Virgalitte et al., 2000).
Expanded or foamed slag results from the treatment of molten slag with controlled quantities of water, air, or foam. Variations in the amount of coolant and the cooling rate will result in variations in the properties of the cooled mass. However, in general, this is a product of a more porous and vesicular nature than air-cooled slag, and thus is much lighter in weight. Due to the variation in properties, the research literature often cites pelletized slag as a subtype of expanded slag. This slag is generated by a cooling method that involves cooling the molten mass using a limited amount of water, followed by chilling slag droplets thrown through the air by a rapidly revolving finned drum. Depending on the cooling process, the resulting slag particles may be angular and roughly cubical in shape, and thus more appropriate as aggregate, or they may be spherical and smooth, and therefore more suitable for use as a cement additive (Lewis, 1982).
Use of a pelletizer, also referred to as air granulation, involves molten slag passing over a vibrating feed plate, where it is expanded and cooled by water sprays. It then passes onto a rotating, finned drum, which throws it into the air, where it rapidly solidifies into spherical pellets. This slag may also have a high-glass content and can be used either as a cementitious material or, for larger particle sizes, as a lightweight aggregate (Virgalitte et al., 2000).