Chapter 11
Options for Specialized Trading: Leveraging the Technical Approach
Most people think about options trading as an isolated and separate strategy. Options are used to speculate or to hedge existing stock positions, and, for many traders, that is the full extent and value of options. But options are so flexible and convenient that they can be used in numerous specialized situations as well.
A popular system in use today is swing trading. This is an excellent technical trading method for anyone who wants to become involved in short-term market plays, normally lasting between two and five days. Swing traders use charting to identify a buy or sell setup and then time their decisions for small but consistent profits.
swing trading
a system based on a two- to five-day cycle, involving buying and selling positions based on predictable price movements and in response to buy and sell setup signals.
setup
in swing trading, a signal indicating that a stock has reached a short-term high level (a sell setup) or a short-term low level (a buy setup). By taking action upon recognizing a setup, swing traders make small but consistent profits.
Options are perfect devices for swing traders, and for one simple reason. If you swing trade using stocks, your potential range of trades is severely limited and involves significant risks, at least on the short side. For example, if you want to swing trade using lots of 100 shares, a $25 stock demands a $2,500 commitment, but an option on the same stock will be available for a small fraction of that cost. An $85 dollar stock requires $8,500 in available cash to place at risk but, again, an option on the same shares will cost far less.
Smart Investor Tip
The leveraging feature of options makes swing trading practical, affordable, and less risky than using stock. This is an example of how options favor short-term traders.
With these important distinctions in mind, the swing-trading strategy is perfectly set up for options in place of stock. Remember these key points:
• Swing traders are not interested in long-term investing. A swing trader wants to create extremely short-term profits by moving in and out of positions in two- to five-day trading ranges. Because they are not interested in the long term, swing trading and options are a good match.
• Because options cost less than stock, the range of possible swing trades is expanded with the use of options. Imagine starting a swing-trading strategy with $10,000 available. Using stocks, you could trade four stocks in the range of $20 to $25. If you have to go short, you would be required to keep cash on hand to cover margin requirement. However, with the same $10,000, you could trade many more stocks, avoid the margin requirement involved with going short, and still make the same profits on each trade.
• Swing traders want to open both buy and sell positions, meaning they may have to short stock. But with options, swing traders can buy puts instead of selling stock. Many swing traders simply avoid opening short positions in stock because the risk is so significant. So they cut out half of their potential trades, and limit activity only to the buy side. With options, you can go long on calls and puts, meaning both sides can be involved without extra risk.
• Swing trading is set up for very short-term positions, meaning this is a perfect strategy for in-the-money options that will expire within one month. You are not likely to hear of very many options strategies where in-the-money options about to expire are favored above all others. But swing traders intend to be in positions for only two to five days, so soon-to-expire options are perfect for this purpose. Because time value will be at or near zero in these options, the cost of long positions will be limited to intrinsic value. Swing traders will want to use in-the-money options because they need the point-for-point price reaction, and options scheduled to expire in a month or less (but with current market value of the stock only a few points from striking price) are ideal.
• Options present much lower risk than stock positions. Swing traders are not going to time their decisions perfectly. No one is right 100 percent of the time. So in the use of long or short stock, the potential risks are significant. In fact, because swing traders want to move in and out of positions in only a few trading days, having capital tied up in positions beyond that time prevents swing traders from realizing their full potential and translates to many lost opportunities. In those cases where the timing is wrong, using soon-to-expire options is lower risk because less cash is involved. A missed timing situation does not destroy the strategy.
Swing-Trading Basics
A swing trader depends on the three emotions that dominate the stock market: greed, fear, and uncertainty. These emotions cause virtually all of the short-term price aberrations that make swing trading a profitable technical strategy. Swing traders try to ignore the tendency to react emotionally to price movement, using logic to take advantage of market overreactions. When prices of stocks rise quickly, “the market” (the overall investing market, that is) tends to act out of greed, buying up shares to get in on the anticipated profits. The majority is often wrong, meaning that many people buy shares at the very top of a short-term price swing.
Smart Investor Tip
Swing traders bet against majority thinking, which often leads to exceptional profits because the majority is usually wrong.
When prices of stocks fall, investors fear further declines and want to cut losses. So the tendency is to sell shares at the very bottom of the short-term price swing. And after a period of price movement, stock prices may move into a very brief period of uncertainty. At these times, trading range narrows as traders wait out the next price movement. During uncertain times, some inexperienced investors become impatient and buy or sell impulsively.
All of these conditions present profitable opportunities, and this is where swing trading works best. Rather than timing decisions emotionally, swing traders tend to do the opposite of the majority. They attempt to time their sales for the price peaks, and time their purchases for the price bottoms. When prices settle down and the market is uncertain, swing traders wait out the period, moving focus to other stocks and practicing patience rather than making buy or sell decisions impulsively.
Swing traders buying and selling stock have to limit their activity based on cash available (on the long side) and margin credit (on the short side). So they typically can swing trade using odd lots only and limiting their participation to only a handful of stocks. In some cases, swing traders can afford to play only one or two stocks at a time, based on their capital restrictions. This is unfortunate because it means having to miss many opportunities. Options solve this problem while reducing risks and setting the stage to play both sides of the price swing without having to ever go short.
Smart Investor Tip
Swing trading with options presents a double advantage: you can be involved in many stocks at the same time, while costs and risks are lower than when shares of stock are used.
One argument against using options for swing trading is that they expire. But this should not be an issue because swing trading ideally works in a very short time frame. There is no need to tie up capital in buying (or selling) 100 shares of stock, when a single option contract provides the same dollar profit when price movement takes place.
Example
A Swinging Idea: A stock on your watch list is trading in the mid-40s and its trading range for 52 weeks had been $42 to $54 per share. Using the traditional method for measuring volatility, the stock was at 24 percent (range divided by low price). You wanted to swing trade this stock. To buy 100 shares, you would have needed more than $4,700 (on January 10, the stock was trading between $47 and $48 per share). To go short, you would have had to assume the risk of selling short, and had at least $2,400 in your account to cover the margin requirement.
Now consider using extremely short-term options. On January 10, slightly more than one week remained until expiration of the January options. There were only seven trading days remaining. This is a perfect scenario for extremely short-term in-the-money options for swing trading. Assuming a current setup signal occurred, you might anticipate a price rise (meaning you want to buy a call) or decline (meaning you want to buy a put). The January 45 call was about 2.5 points in the money, and was selling on January 10 for $2.37. This is virtually all intrinsic value. The January 47.50 put was selling that day for 0.60. So whether you believed in this situation that the price would rise or fall in the next six trading days, options are clearly much cheaper than 100 shares of stock.
The example makes a strong case for swing trading. But remembering that those options are going to expire in only six trading days, buying either the call or the put must be done only if and when a strong setup signal was present.
Smart Investor Tip
You can use options very close to expiration—even a matter of days—based on the swing-trading ideal of five or fewer trading days in any open position. But you also have to be willing to get in and out quickly or to accept small losses.
In most options strategies, you have to be concerned about the timing of a buy or sell decision primarily due to expiration, so the majority of strategies present a dilemma. On the long side, you want cheap options close to the money with a long time until expiration. On the short side, you seek high-time-value options with as short a time as possible until expiration. Swing trading contradicts these requirements, primarily because it is designed to work only within a few trading days.
In swing trading, you do not have strong feelings about companies one way or the other. You are trading emotions, not stocks. So when you find a setup to buy, you buy; and when you find a setup to sell, you sell. It’s that simple. As a swing trader, you are exploiting the overreactions of the market at large and seeking very short-term profits based on identifiable setup signals. In the next section, a Wal-Mart example is detailed and the question of setup signals is explored in detail to show how this works.
The Setup Signal
Swing trading depends on the setup, a buy or sell signal based on at least three days’ worth of indications. Setups occur as well in combinations. In other words, a short-term trend requires at least a three-day price and pattern movement in one direction, ending with a clear reversal signal. It also requires a combination of setup indicators.
candlestick charts
technical charts for stocks summarizing a stock’s daily trading range, opening and closing prices, and price direction. The candlestick is used in many trading systems, including swing trading.
Swing traders do well using candlestick charts to spot these setups. The candlestick chart is based on an ancient Japanese system originally used centuries ago to track rice prices. Today, Internet-based services offer candlesticks on most listed stocks and save time by computing the indicators for you. The candlestick employs a relatively simple pattern that reveals the opening and closing prices, trading range, and direction of price movement for the trading day (or other period).
While the candlestick tracks the stock’s market price, the setup signals you can derive from the candlestick can be employed to time buy and sell decisions using options. As long as you use minimally in-the-money options with a short time to go until expiration (meaning there will be little or no time value remaining), the use of options will track option price movement very closely.
Smart Investor Tip
The reason to use close-to-expiration options is to maximize the point-for-point price movement. If there is any time value remaining in the option, swing-trading models will not work.
upper shadow
on a candlestick formation, the line defining the extent of a day’s trading range. The line extends above the opening or closing prices for the day.
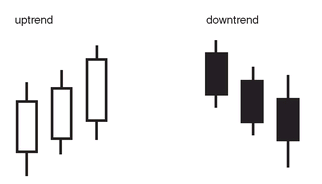
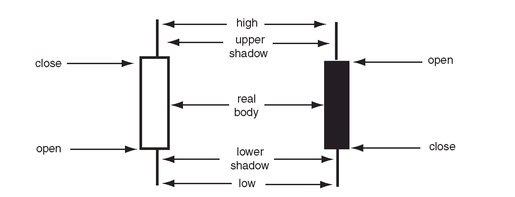
Candlestick charts consist of a series of boxes (squares and rectangles) with single lines rising above and below. A white or blank box indicates the price rose on that day, and a black box occurs when the price direction is downward. The box borders the day’s opening and closing prices. The lines extending above and below represent the trading range for the day and are named the
upper shadow and the
lower shadow. For example, if a stock opened at $23 per share and closed at $26, but had prices as high as $28 and as low as $21, the candlestick for that day would consist of a white box (because the price rose from opening to closing). The rectangle would be bordered between $23 and $26, the opening and closing prices. And the lines would extend below the box down to $21 and above the box up to $28. The attributes of candlesticks are summarized in
Figure 11.1.
The buy or sell setup is found when a clearly established trend comes to an end. The setup anticipates price movement in the opposite direction and may be seen in the emergence of one or more patterns. Important patterns to know include:
•
Three or more days of clearly identified uptrend or downtrend movements. This is the clearest of all setup signals. A minimum of three days is required. An
uptrend occurs when you see three or more trading days consisting of a series of higher highs, offset with higher lows in price. For example, a price range over three days of $23 to $26, $24 to $28, and $26 to $29 meets these criteria. A
downtrend also occurs over three or more days, and consists of a series of lower highs and lower lows. For example, the price pattern of $29 to $26, $28 to $24, and $25 to $23 establishes a three-day downtrend.
lower shadow
on a candlestick formation, the line defining the extent of a day’s trading range. The line extends below the opening or closing prices for the day.
uptrend
in swing trading, a series of three or more days consisting of higher highs offset by higher lowers.
FIGURE 11.2 Uptrend and downtrend candlestick patterns.
downtrend
in swing trading, a series of three or more days consisting of lower highs and lower lows.
The terminology is somewhat confusing, but once you see the series on a candlestick chart, the pattern becomes completely clear. The fact that uptrends consist of a series of white or clear boxes makes an uptrend jump right out and, of course, the black boxes in a downtrend are equally visible. As long as the size and shape of those boxes exceed the boxes of the previous day (so that both top and bottom are higher in an uptrend or lower in a downtrend), the pattern is clearly set. The three-day uptrend and downtrend are demonstrated in
Figure 11.2.
Smart Investor Tip
Short-term trends are easily identified. They open, close, and move in the same direction for three or more days.
narrow-range day (NRD)
in a candlestick chart, a trading day with an exceptionally small trading range.
•
Look for the setup following the three-day pattern. The setup will usually consist of either a
narrow-range day (
NRD) or a day with exceptionally high volume. The NRD is easily recognized; the rectangle and shadows are quite small.
An NRD is considered a strong signal that the established trend may be ending. This is especially true when accompanied by a high-volume day. So when you see (1) a trend lasting three days or more, (2) an NRD, and (3) exceptionally high volume on the same day as the NRD, that combination gives you the strongest setup possible. On the upside, it is a sell signal; on the downside, it is a buy signal.
Smart Investor Tip
A narrow-range day signifies price consolidation at the end of a trend. When this occurs with unusually high volume, it is the clearest possible setup, indicating time to take action.
Testing the Theory
The two- to five-day price trends and setups can be tested by reviewing a typical candlestick chart.
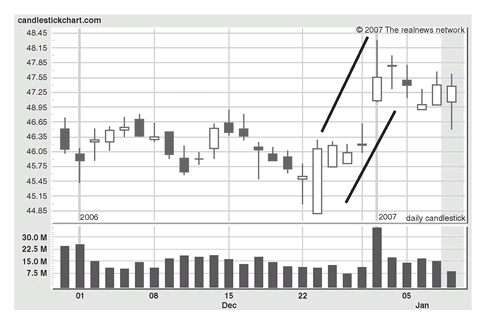
Figure 11.3 is a good example.
This is a 30-day candlestick chart for Wal-Mart. The latest few days of this chart did not present a clear signal in either direction; but look at the activity from December 26 (the trading day after December 22) through January 4. In these six trading days, there was a clear uptrend and sell signal. Five uptrend days ended with a peak in prices and exceptionally high volume. The following day was an NRD day, which is recognized by the virtual flat line in place of a more obvious trading range. This means that opening and closing prices were quite close together. A stronger signal would have involved the NRD and high volume in a single day. But if you had bought a call in late December, the development of this uptrend pattern ending on January 4 would have provided a clear sell signal.
Smart Investor Tip
It is not any one signal that indicates time to take action, but a combination of an established short-term trend with a reversal signal. That is what swing traders depend on before making a move.
A clearer pattern emerged for Apple, the well-known computer company, during the period of December through early January.
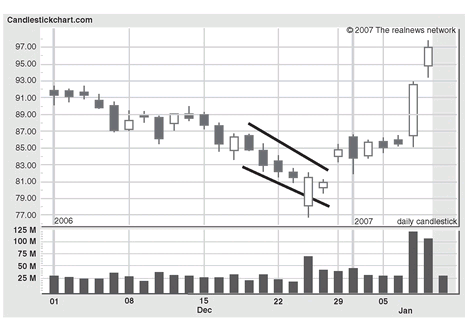
Figure 11.4 shows a one-month candlestick chart for the company.
The range of trades marked off includes four days of declining price, followed by two uptrend days. There are five aspects to this pattern, all signaling an end to the downtrend:
1.
Consecutive downtrend days. The stock had fallen in value for four days in a row. This is the preliminary signal that, in fact, the short-term downtrend is probably coming to an end, and the most common pattern swing traders seek.
2. A narrowing trading day. On December 26, a down day also showed a narrowing range, but it was not necessarily an NRD. You would expect an NRD to be quite thin (like the last day shown on the chart, for example).
3. A reversal in direction with higher volume. December 27 was a day when price rose for the first time in five trading days, and volume picked up as well.
4. A second narrowing trading day. December 28 was yet another up day and also with relatively narrow trading.
5. A price gap. Chart watchers invariably point to a gap as significant. In the case of Apple, after the signals indicating that the downtrend had ended, the stock’s price gapped between December 28 and 29. This is a strong indication that the stock will be rising in price, and it foreshadowed trading over the next seven to eight trading days.
In using options for swing trading, the signal that the downtrend had ended was clear by December 27 or 28. If you had bought a call on one of those days, especially one in the money and due to expire in the near future, you would have made a profit within eight trading days. For example, on December 27, when the stock opened under $79 per share, the January 80 call was selling for approximately 4 ($400). On January 11 (the last day on the chart and an NRD following a strong uptrend), the same call was worth 15.80, nearly 400 percent higher.
gap
a trading pattern in which the range between days includes a gap in price, with the second day’s trading range opening above the highest price of the previous day or below the lowest price of the previous day.
confirmation
a signal providing support for another signal, reinforcing the belief that a trend is ending and about to reverse.
Of course, hindsight is always perfect in swing-trading situations being reviewed. At the time, the price decline followed news that Apple CEO Steve Jobs may have been awarded stock options without proper approval. The stock’s price was reacting to the news, so the price decline caused a lot of fear among Apple investors. However, swing traders are supposed to ignore the news and just trade the price patterns and investor emotions. In this situation, the signals that the downtrend had ended were quite strong, and five separate indicators provided strong confirmation of that fact. Even so, using options the maximum risk in this situation would have been less than $500 for a single January call, far less than the purchase price of $7,900 for 100 shares. A comparison of the percentage return also bolsters the argument favoring the use of options over stock. A profit of $1,180 on 100 shares bought at $79 per share would be 15 percent, but the profit on a 4.50 option would be 262 percent. The option would have required less capital, involved less risk, and created a far higher return.
Smart Investor Tip
The more confirmation you have that an established short-term trend is on the verge of reversing, the better. But if you wait too long—even one day—you could also miss the opportunity.
This leverage feature is compelling. A swing trader faces the constant problem of capital limitation. With a finite amount of money, you can swing trade only a limited number of stocks if you are going to be buying shares. But slightly in-the-money, soon-to-expire options are quite cheap. In the example earlier in this chapter, when Wal-Mart stock was selling at about $48 per share, the closest in-the-money call was available for 2.37, or about 5 percent of the stock’s price. The next-expiring in-the-money put was at 0.60, or about 1 percent of the stock price. So your capital is easily leveraged with options in place of stock. Rather than having to buy 100 shares for $4,800, you could put $237 into a call and have the same potential upside profit; or invest only $60 in a put for the same downside potential (not to mention avoiding the risk of selling shares short).
A Strategic View of Options for Swing Trading
The success of a swing-trading program relies on following the rules: identifying the setup after an uptrend or downtrend and acting quickly to take advantage of the short-term price swing. But many stock-related considerations should be kept in mind as well, including:
• Selection of stocks based on value. No matter what potential profits you might earn using options for swing trading and other strategies, it remains a sensible approach to limit your trading activity to high-value stocks. Using the relatively logical and simple theory of value investing, you may limit your options trading to stocks that also offer long-term growth and profits for well-managed companies.
• A stock’s price volatility. Options traders face a dilemma when considering strategies like swing trading. The strategy will not work on the exceptionally safe stocks because, by definition, they tend to trade only in a narrow price range. So the opportunities for even moderate price volatility are simply not there. At the same time, exceptionally volatile stocks are difficult to predict. Even trying to apply the principles of swing trading to erratic stock trends is difficult and risky, so swing traders also want to avoid risky stocks. The ideal stock is one with moderate volatility, that is likely to experience price swings of a few points within a few days, but not likely to go through wide swings in either direction due to high market interest and high market overreaction to news and rumor.
Smart Investor Tip
No matter what options strategies you employ, limiting your activity to high-quality companies is simply smart investing. Those stocks will be more predictable, less volatile, and better for all types of option trading.
• Price history (recent) and potential. The definition of various volatility levels is invariably based on past price performance. But the potential price history can be further clarified by checking the size of the stock’s recent trading range. Stocks with relatively narrow trading ranges of 10 points or less are excellent candidates for swing trading in the $40 to $80 price range. These stocks display historical volatility of 12.5 percent to 25 percent. If this range has been consistent, it is reasonable to extrapolate the same volatility levels into the future. This may oversimplify the task, however. In an ever changing market, yesterday’s sedate stock may be tomorrow’s most volatile, and vice versa. But investors and traders have to rely on trends and trust them. Without the trend, you would have no basis for selecting one stock over another for swing-trading purposes.
•
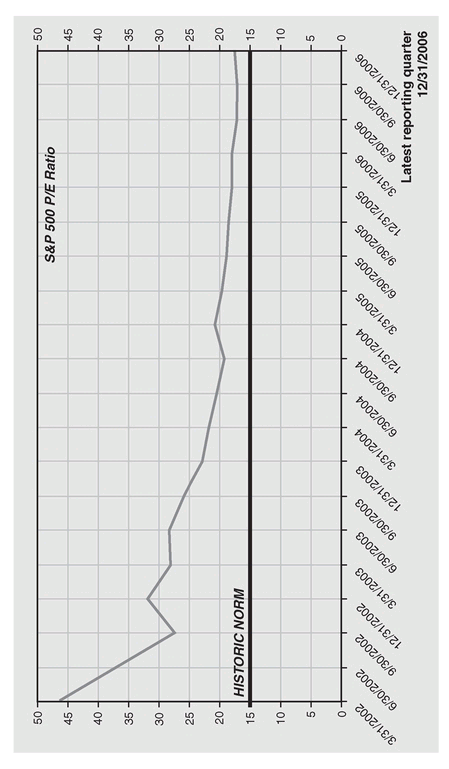
The price-to-earnings (P/E) ratio of the stock. The P/E ratio tells you how much the market anticipates future price appreciation. So a P/E multiple of 20 represents a price per share 20 times higher than last year’s earnings per share. The P/E can be used to limit the range of stocks you consider for swing trading. An exceptionally high P/E often indicates that the market has driven the stock’s price too high, that enthusiasm is higher than justified. An exceptionally low P/E ratio is a symptom of a lack of interest in the stock. The P/E ratio may foreshadow future volatility as well. High-P/E stocks will tend to overreact to marketwide price movements and be highly volatile. Low-P/E stocks will tend to underreact, making them poor candidates for swing trading. With this in mind, limiting a stock portfolio to those with P/E ratio between 10 and 20, for example, will help avoid companies with overpriced stocks as well as those lacking the moderate price volatility swing traders desire. The range of 10 to 20 for P/E ratio is subjective, but if you check typical P/E ranges, you will find that this range represents the midrange of stocks. Historically, a P/E of 15 has been considered the “norm” for the market’s P/E ratio, and the stocks in the S&P 500 have often ranged between 15 and 20, but in more volatile markets, such as the year 2002, the P/E range for the S&P 500 rose as high as 45.
Smart Investor Tip
Picking a range of P/E in which to consider stocks is a matter of personal preference. The multiples between 10 and 20 are reasonable, but some investors will prefer P/E ranges far higher.
The history of the S&P 500 collective P/E over several years is summarized in
Figure 11.5.
This period ends with the last quarter of 2006, when the P/E was below 20 for the S&P 500. During 2008, the P/E inched up to about 25, reflecting a combination of lower earnings reports coupled with lower stock price ranges. The historic norm remained at the long-established level of 15. This indicates that even with the disastrous 2008 stock market history, the historical P/E reflected a degree of optimism about the market’s future. The difference between a 15 (historical average) and 25 (end of 2008) P/E is substantial.
Smart Investor Tip
For a good overview of financial and economic indicators as part of your portfolio analysis, check
www.bullandbearwise.com. Indicators such as P/E as well as broader indications classified as “bullish” or “bearish” help you to gauge the current market mood.
• Fundamental and technical tests of the company and stock. Any stock you pick for options trading as part of a swing-trading strategy should also pass a few basic fundamental and technical tests. You may develop your own short list of essential tests. On the fundamental side, these should include tests of working capital, the trend in debt versus equity capitalization, revenue, and net return. On the technical side, you will want to test price history and volatility, expressed in terms of the volatility percentage and breadth of the trading range for stocks at various price levels.
Options Used for Other Trading Strategies
day trader
an individual who trades within a single day, usually closing positions before the end of the trading day, and often making such trades on high volume.
pattern day trader
any individual executing four or more transactions on the same security within five consecutive trading days; these traders are required to maintain no less than $25,000 in their brokerage accounts.
Swing trading is only one of many possible trading strategies in which options can play a valuable role. In fact, swing trading is an extension of a better-known strategy called day trading. The day trader typically moves in and out of positions within a single trading day, so that the open positions do not extend from one day to the next. Day traders also tend to be high-volume traders, moving in and out of positions frequently and on the same stock, often tracking prices minute to minute. Day trading is perfectly suited to options in the same way and for the same reasons as swing trading: greater leverage and lower risk. Because day trading is extremely short term in nature, cheap options near expiration and slightly in the money are real bargains. With little or no time value, options enable day traders to control 100 shares of stock per contract, for only a fraction of the cost of trading stock. The risks are limited as well, due to lower investment requirements and the ability to use calls and puts equally in long positions.
Day traders are able to avoid a margin requirement, and this has caused problems for regulators. Under the rules, margin requirements are based on positions open at the end of each trading day. So a day trader could avoid having to meet margin requirements while still placing a large amount of capital into positions, as long as those positions were closed before the end of the day. Because this practice can lead to large losses for the trader as well as for the brokerage firm, a qualification was enacted and applied to day traders. Anyone who trades on high volume (meaning moving in and out of the same positions four or more times within five consecutive trading days) is classified as a pattern day trader. Anyone meeting this standard is required to leave at least $25,000 in their account. If they do not maintain the required level, they will not be allowed to execute further trades once the pattern day trader status is triggered.
Smart Investor Tip
Swing trading is the perfect solution for avoiding being classified as a pattern day trader. The typical entry and exit takes at least three days, so executing four trades within five days under these guidelines would be unlikely.
Swing- and Day-Trading Advanced Strategies
Most examples used in this book involve single option contracts, for the sake of clarity. However, swing and day trading do not necessarily have to be limited to single contracts to control 100 shares of stock. Especially when option premium levels are quite low, using multiple contracts saves on brokerage fees while increasing profit potential. In addition, using multiple contracts vastly expands your strategic potential for swing trading, including taking partial profits while keeping the remainder of a position open, and expanding swing trading into more advanced options strategies such as straddles and spreads.
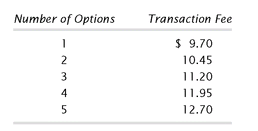
For example, one popular online brokerage firm (Charles Schwab) charges $9.95 for a single option trade, plus $0.75 per contract. However, when multiple contracts are involved, the savings are substantial:
At five contracts, the cost per option is only $2.54. So substantial transaction cost savings are going to be realized when trading in multiple option contracts. But there are other and more important reasons to use multiple contracts. It adds flexibility to swing- and day-trading strategies. Example of how you can vary your strategies with multiple contracts include:
• Take partial profits. In many cases when swing trades are executed, you face a dilemma. Do you take your profits even when setup signals are not present or do you wait? Because no system is perfect, you will at times miss profit opportunities by waiting one day too long. But with the use of multiple contracts, you can sell part of your holdings and keep the balance in the position. When profits are exceptional, this enables you to make a profit on the entire position, while keeping a portion in play and awaiting the setup signal.
• Partial exercise. As a holder of a long call, you have the right to exercise or to sell. For example, if you are swing trading on a stock you might want to also own, multiple contracts open the possibility of combining strategies. You can sell part of the overall position to gain a profit on the swing trade and exercise the remainder. This strategy is valuable when you realize that the stock was selling at a great price a few days earlier. With a long call in hand, you can buy at the striking price and then hold the stock for the long term (or revert to a covered call strategy, for example).
• Add more option contracts in times of price momentum. From time to time, a stock’s price not only moves in one direction, but gains momentum. For example, you might open a single-contract position only to later get a second setup signal going in the same direction. You can simply wait out the trend or buy additional option contracts based on the strong momentum of the stock’s price.
Multiple contracts give you greater flexibility in a swing- or day-trading program, while also enabling you to execute trades for very little additional cost. Yet another interesting twist involves combining a swing-trading strategy with covered calls.
One of the great advantages in using options rather than stock is that you can use puts instead of the high-risk shorting of stock. But there is a mirror strategy of this, and it involves using covered calls instead of buying puts. If you do not own shares of stock and you reach a sell setup point, the obvious move is to buy puts. Then, when the stock declines, the put becomes profitable. However, if you also own stock, you can write covered calls rather than buying puts. This provides you with a double advantage.
First, the covered call is safer than the long put because time value is involved. As time value declines, your short call becomes less valuable and can be closed out (bought to close) at a profit. Second, you have to pay money for the long put, but when you write a covered call, it produces cash that goes into your account.
Smart Investor Tip
Covered calls are conservative strategies in their own right. But as part of a swing-trade strategy, covered calls make even more sense because they are tied to a sell setup. You can take profits within a few days without having to sell stock. This approach also produces cash rather than spending it.
You might consider many options-trading strategies to work as swing trades. But the strategy itself is invariably based on short-term price swings identified with specific setup signals. Swing-trading signals improve your profitability even when using options near expiration. The same advantages applied to listed stock options can be applied with equal benefit to options traded on futures contracts. The next chapter shows how this works.


