Statistical appendix
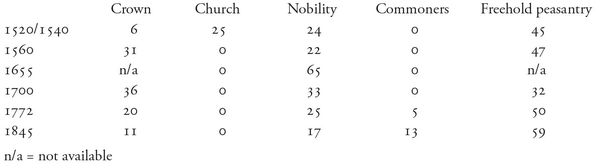
1. Landownership by social category
For the earliest period the percentages in Table 1.1 refer to the number of farms, but thereafter they refer to mantal or hemman; two terms with partly overlapping meanings, where hemman originally meant physical farms and cadastral units while mantal measured the taxable capacity of the farms.
The nobility’s land was tax-exempt (frälsejord ), whereas freehold peasants’ land was taxed (skattejord). By the mid seventeenth century, however, about a third of the land controlled by the nobility was comprised of freehold farms where the nobility had acquired from the Crown the right to tax the freehold peasants who farmed them–but not full ownership of the farms in question. Of the remaining 35 per cent of the land, roughly half was in the hands of the Crown and the other half in the hands of freehold peasants.
The first historian to summarize the landownership figures was Eli Heckscher. Subsequently his results have been revised several times. For the eighteenth and nineteenth century his figures are misleading: he calculated by cadastral category (tax-exempt land, Crown land, and taxed land) and disregarded the fact that an increasing share of the tax-exempt land, originally owned by the nobility, passed into the hands of the bourgeoisie and non-noble persons of rank, and finally even to freehold peasants.
From the mid nineteenth century Swedish landownership was not normally related to social class, while the cadastral categories of agricultural land had by then lost much of their social connotations.
References:
Carlsson 1956, 192; Carlsson 1973, 170; Ferm 1990, 387; Heckscher 1935, app. 4; L.-O. Larsson 1985; Myrdal 1988; Nilsson 1964, 88; Rydeberg 1985, 162.
2. Number of agricultural households and number of holdings
During the eighteenth and nineteenth centuries the social structure of the countryside underwent radical changes. Notably, there was an increase in the number of households with no access to land or (insecure) access to very marginal amounts of land. Statare (see pp. 141 and 175) exemplified the first category (farm-hands living in the peasant-farmers’ or farmers’ households are not independently counted). This development is shown in Table 2.1. However, other categories of agriculturalist also emerged, particularly in the late nineteenth century, so that particularly by the end of the period the figures in Table 2.1 underestimate the total number of farm holdings shown in Table 2.2. However, the statistics on the number of crofts are notoriously unreliable, and the number of crofters’ households is therefore used as a proxy for the number of crofts in Table 2.2. By 1919 crofts and crofters had disappeared from the official statistics–crofters were lumped in with other tenants. For this reason, the official statistical series Bidrag till Sveriges officiella statistik (SCB BISOS) that ended in 1911 is not fully compatible with later official statistics. Statare remained a very special category of agricultural worker, acquiring an almost mythical position in literary accounts of the Swedish countryside right up to the 1940s. However, even though statare made up an important category of labour in large-scale farming, their number remained comparatively low, as Table 2.1 shows, although their decline started later than other categories of unlanded labour. These other categories–crofters, day labourers, farm-hands living in farmers’ households, etc.–outnumbered the statare, especially before 1870.
Table 2.1 Number of peasant-farmer, crofter, and cottager households, 1751–1910, and statare households 1830–1943.

Sources: Wohlin 1909, sammandragstabell C, D, E, råtabeller for peasants, crofters, and cottagers; Bagge, Lundberg & Svenilsson 1933, 194–5 for statare 1870–1920; Furuland 1962, 175 for statare 1930; M. Olsson 2008, 71 for statare 1938 and 1943.
Table 2.2 Number of agricultural holdings by size of arable area, 1885–2004.
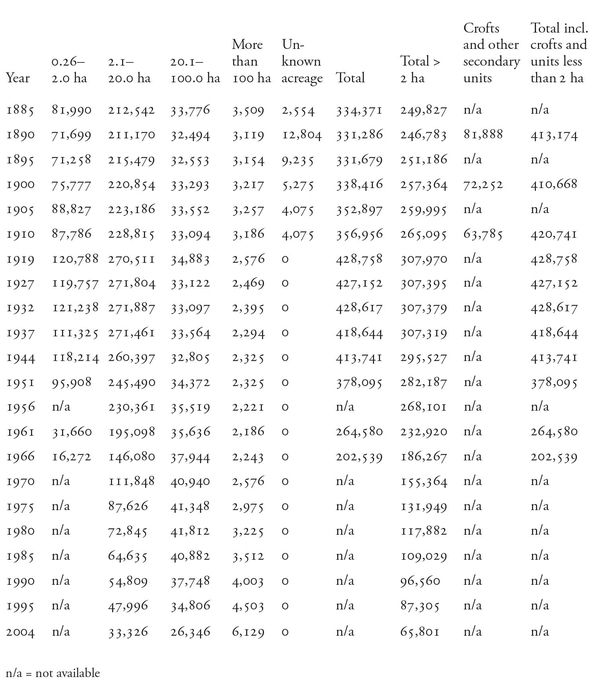
Sources: Jordbruksverket 2005a, Table 1.1; for number of crofts 1890–1900, Wohlin 1909, raw data tables; for 1910, SOS 1910 Folkräkningen; from 1919–1943 crofts were included among other units and not registered separately.
Table 2.3 Percentage arable acreage by size of holding in hectares, 1919–1999.
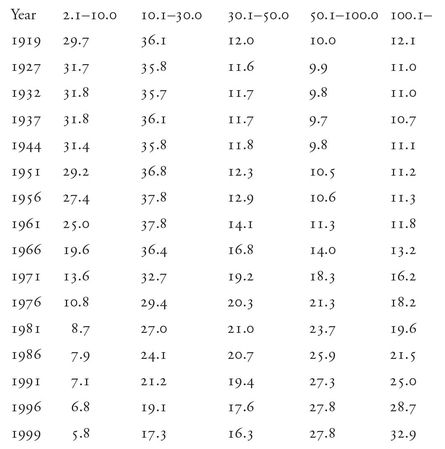
Sources: SCB 1920; SOS 1927–37, Jordbruksräkningen; Jordbruksverket, Jordbruksstatistisk årsbok 1970–2000.
3. Agriculture’s share of national income and employment
Several historical GDP series exist. Hitherto, agriculture’s contribution to GDP has been underestimated for the early nineteenth century, for although the official underestimation of acreage (discussed in greater detail in section 4 below) was compensated for, the proportion of harvests used for forage and thus as input in animal production was grossly overestimated, leading to a decreased market value of total production. The series presented here are duly revised, taking into account provisional recalculations of grain harvests made by Carl-Johan Gadd (Gadd 2008).
Data on agricultural employment is notoriously problematic, as many groups worked part-time –there are immense problems with arriving at a definition of the agricultural work-force. For example, many farmers and farm workers worked in forestry or had industrial occupations on the side, and the farm work performed by farmers’ wives and family members is an uncertain point. Above all, the distinction between household work on farms and agricultural work is very unclear. The figure for agriculture’s share of total employment given here is therefore very approximate.
Table 3.1 Agriculture’s percentage share of GDP at fixed prices, 1801–2000, and of employment, 1851–2000 (ten-year averages).
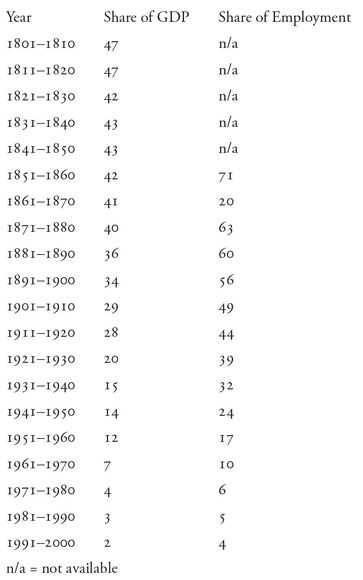
Sources: for GDP the data was generously provided by Rodney Edvinsson of Stockholm University; for employment, LU MADD 1850–2000.
4. The arable acreage
The first attempts to construct national agricultural statistics were made in the early nineteenth century when parish priests were requested to collect not only population data, but also figures for arable acreage, amount of barrels sown, yields, and number of farm animals. It has been shown–using cadastral maps and quantities of seed deducted from probate inventories–that the clergy’s data on acreage, seed, and total harvests involved gross underestimations. However, their data on the proportions of different grains, seed–yield ratios, and number of farm animals are believed to be reasonably realistic. Around 1820 the responsibility for agricultural statistics was taken over by the county administrations and the results were printed in the county governors’ quinquennial reports. In 1865 the responsibility was shifted again, this time to the county agricultural societies. The quality of figures improved gradually, but the figures for arable acreage (and implicitly for total harvests) remained the weak point until the early twentieth century. While, for example, the figure for the acreage given by the clergy in around 1805 needs to be increased by about 100 per cent, official statistics for the arable acreage of the 1860s need only be increased by about 30 per cent. As data collection methods improved, official figures in time came closer to reality, giving the impression that there was a strong increase in acreage even in the late nineteenth century (see Svensson 1965). By the early twentieth century, official data appears reasonably correct. These observations have informed both Table 4.1 below and Table 3.1. in the previous section.
Table 4.1 National total acreage of arable, 1800–2000.
| Year | Hectares (’000) | |
|---|---|---|
| 1800 | 1,500 | |
| 1850 | 2,600 | |
| 1865–1869 | 3,200 | |
| 1879–1881 | 3,400 | |
| 1897–1901 | 3,700 | |
| 1910 | 3,645 | |
| 1919 | 3,790 | |
| 1927 | 3,716 | |
| 1932 | 3,725 | |
| 1937 | 3,731 | |
| 1944 | 3,715 | |
| 1951 | 3,647 | |
| 1951* | 3,526* | |
| 1956 | 3,488 | |
| 1961 | 3,296 | Until 1951, figures refer to all arable land. From 1956 onwards, figures refer to arable land on farms with 2 hectares of arable or more. |
| 1966 | 3,058 | |
| 1971 | 3,032 | |
| 1975 | 2,980 | * = figures for farms with 2 hectares or more in 1951, given for the sake of comparison. |
| 1981 | 2,938 | |
| 1988 | 2,872 | |
| 1995 | 2,767 | |
| 1999 | 2,747 | |
| 2004 | 2,601 |
Sources: for 1800–1850, Hannerberg 1971 (approximate estimate from cadastral maps); for 1865–69 to 1897–1901, Holgersson 1974, 47, Table 12 column 4 (estimates from consumption and trade data); for 1910, SCB BISOS N 1919, and SOS 1920, Jordbruk och boskapsskötsel, 4; for 1927–51, SCB 1959, 27, Table D 15; for 1956–2004, Jordbruksverket 2005a, Table 1.5.
5. Use of land for different crops
Table 5.1 Percentage of sowings of grain and peas in Swedish counties, 1802–1805.
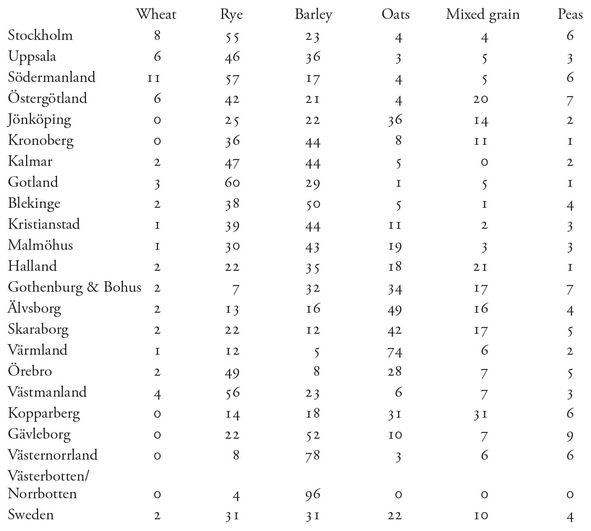
Source: SCB archive, Stockholm, Tabellkommissionens arkiv, Statistiskt material A. II a ‘Mortalitetstabeller’.
Table 5.2 Percentage of arable land used for different crops in Sweden, 1866–2004, five-year averages.
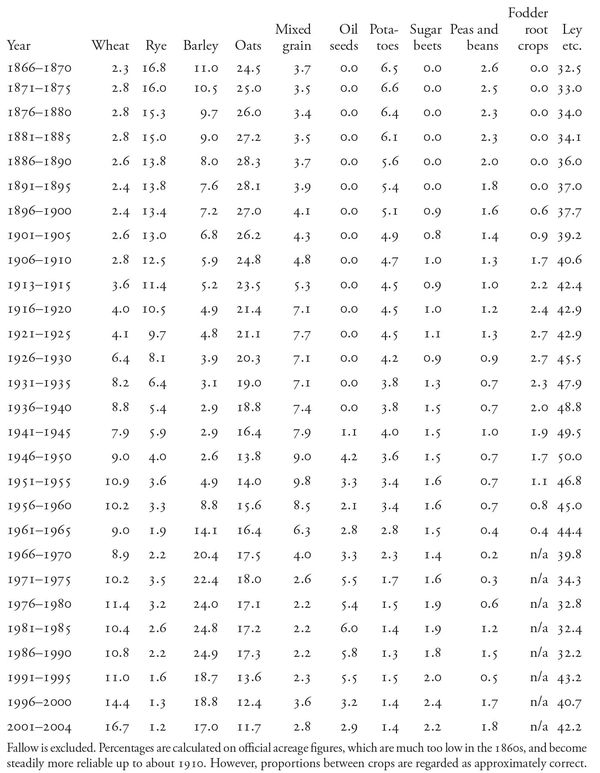
Source: Jordbruksverket 2005a, Tables 1.6, 1.7, 1.8. NB. There was a restructuring of agricultural statistics in 1912 and therefore no figures comparable to 1913–1915 exists for 1911 and 1912.
6. Yields of grains and other vegetables
Yields can be measured as output per unit land or output per unit seed. As long as yields were small, farmers were interested in the seed-yield ratio, because the seed-corn was a major part of the investment. When yields rose and investment in land increased, farmers instead wanted to know how much grain was grown per unit land. That is why statistics from the Middle Ages up to the early nineteenth century normally gave the volume of the harvest relative to seed-corn, while today it is always given in volume of harvest per hectare.
In the central Swedish plains around Mälaren in the later Middle Ages, the seed-yield ratio was 2–4, but in the sixteenth century it rose to 6–8, and then fell during the seventeenth century (Myrdal & Söderberg 1991, 289; Leijonhufvud 2001). For most of the rest of Sweden accounts have survived from the sixteenth century, and especially the seventeenth century onwards. In Skåne, yields increased somewhat from the mid sixteenth century until the beginning of the seventeenth, but stayed within the range of 2–4 on large farms (Olsson 2002, 169–70, 406, 463). In much of the forested area the yield ratio was 2–4 (Myrdal & Söderberg 1991, 273–281; Andersson Palm 1993; Leijonhufvud 2001). There are long runs of surviving records for some of the manors that show a rather stable yield ratio during the sixteenth century, but often a certain lowering of yields during the latter part of the seventeenth century (Leijonhufvud 2001). A change in climate may have played a role here.
From the early nineteenth century reasonably trustworthy official statistics for yields are available (see section 4, above). From the 1860s, seed-yield ratios as well as hectare yields are available. Table 6.1 shows seed-yield ratios up to 1870; Table 6.2 hectare yields from 1866 onwards. For the five-year period 1866–70 the tables overlap, a period of comparatively low yields that reflects Sweden’s last devastating crop failure in 1867–8.
Table 6.1 Average seed-yield ratios in certain periods 1802–1866, four- to five-year averages.
Sources: SCB 1959; SCB 1969; Kungl. Maj:ts Befallningshavandes femårsberättelser 1823 and 1828; SCB BISOS N 1866–1875.
Table 6.2 Hectare yields of certain crops, 1866–2000 (five-year averages, kg per ha).
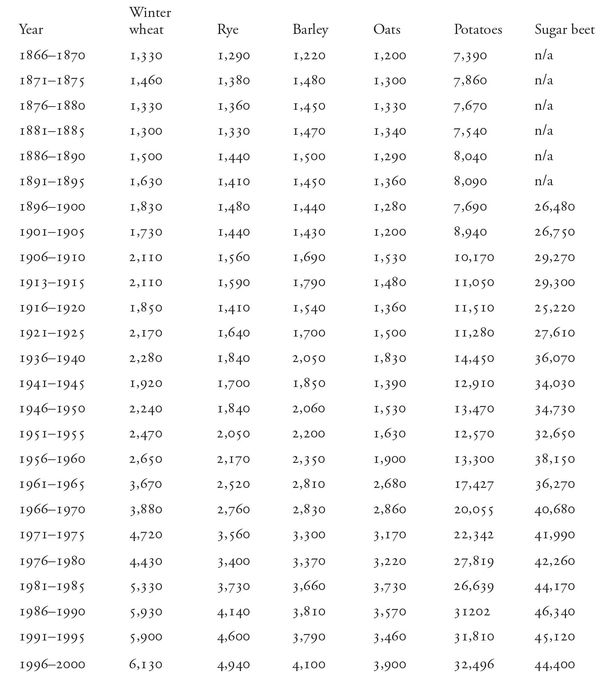
Source: Jordbruksverket 2005a, Tables 1.8, 2.2, 2.4, and 2.5. n/a = not available
NB. There was a restructuring of agricultural statistics in 1912 and therefore no figures comparable to 1913–1915 exists for 1911 and 1912.
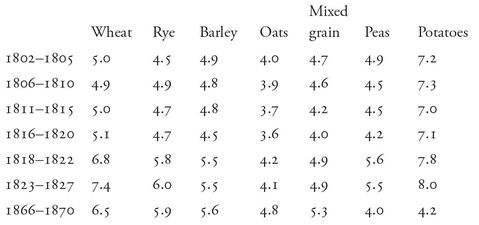
Table 6.3 Seed-yield ratios by county, 1802–1805.
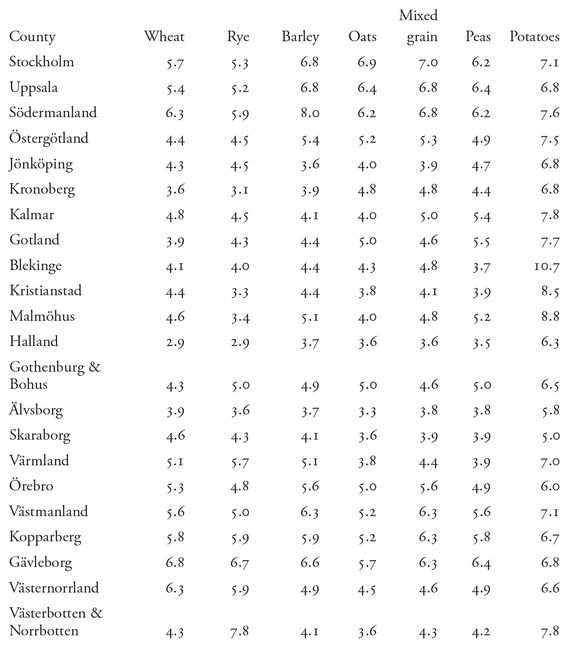
Sources: SCB archive, Stockholm, Tabellkommissionens arkiv, Statistiskt material A. II a ‘Mortalitetstabeller’; SCB 1949, 181–3.
7. Number of animals
In Sweden, the 1571 tax rolls recorded assets at the household level, and the number of animals, coins, etc. was registered. Accounts for 53,000 households in Sweden and Finland have been preserved (Myrdal & Söderberg 1991). For an estimated total of 84,000 households, the number of animals can thus be estimated at 61,000 oxen, 339,000 cows, 404,000 sheep, 130,000 goats, and 206,000 pigs. The number of horses cannot be estimated as they varied in value, but there were more than 100,000 horses in the country. The figures probably underestimate the normal number of animals for two reasons. Firstly, Sweden had been engaged in a devastating war with Denmark immediately prior to the tax register being drawn up; secondly, the registration of assets or production to be taxed tends to elicit underestimates. After 1571, no comprehensive data on farm animals was collected in Sweden before 1805. In Table 7.2, data from 1571 is combined with later data from the official statistics. For 1805, data is given using the 1571 categories adhering to Sweden’s 1571 borders.
Although the official nineteenth-century agricultural statistics are thought more reliable as regards animals than as regards acreages, there may have been some underestimates. Comparisons with probate inventories for certain areas indicate that the number of cows and small animals in particular may have been underestimated in the early statistics (Gadd 1983, 124).
Table 7.1 compares the arable acreages in hectares per horse equivalent (1 horse = 0.67 oxen) in around 1800 for Sweden, England and Wales, and France. It shows that the number of draught animals per ha was comparatively high in Sweden. This is at least partially explained by the short growing season in Sweden, which meant each draught animal could only be used to work a relatively small acreage (see p. 158).
Table 7.1 Arable and horse equivalents in Sweden, England and Wales, and France, c. 1800.
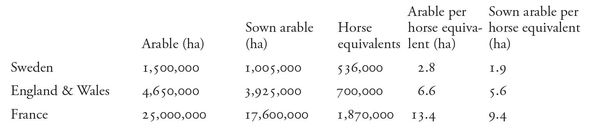
Sources: Hannerberg 1971, 31; Gadd 2008; SCB 1949, 193; Wrigley 1991, 328–9; Overton 1996, 76; Mazoyer & Roudart 2006, 330. NB: 1 horse equivalent = 1 horse or 1,5 oxen.
Table 7.2 Number of farm animals 1571 and 1805–2004.
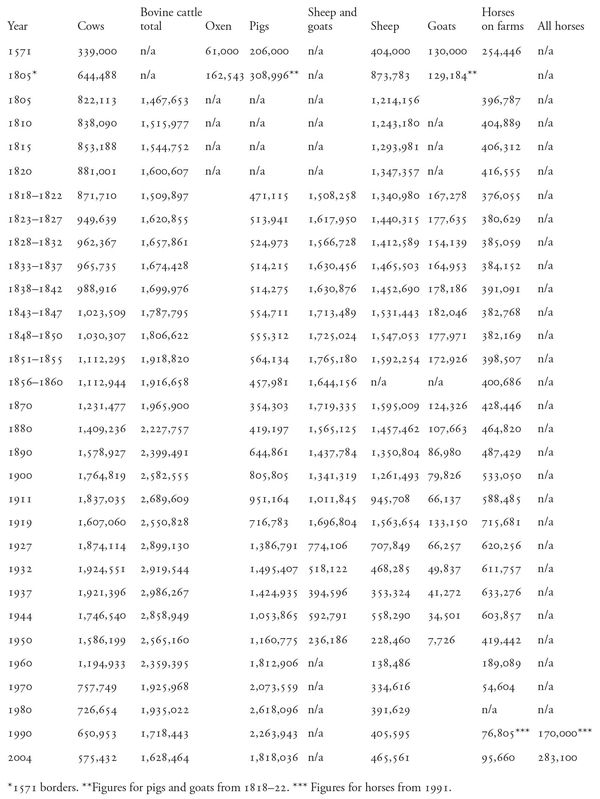
Sources: for 1571, Myrdal & Söderberg 1991; for 1805 (Sweden’s 1571 borders), SCB 1949, 193; for 1810–1955, SCB 1959, Tables E 31–34; for 1960–2004, Jordbruksverket 2005a, Tables 1.12, 1.13, and 1.14 for exceptions, horses in agriculture 1990 (1991) and 2004, Statistics Sweden, Husdjur i riket efter djurslag 1981–2007 (<www.ssd.scb>); all horses 1990, Jordbruksstatistisk årsbok 1995; all horses 2004, Jordbruksverket JO 24 SMO501.
8. Animal yields
From the sixteenth century onwards, it was primarily the amount of butter per cow that was recorded. This was because butter was the principal commodity produced for sale and to pay taxes. In the sixteenth century normally about 20 kg of butter could be made from the milk of an average cow in one year. According to contemporary sources, 20 litres of milk yielded 1 kg of butter (which implies the milk had a rather high fat content). Thus a cow would have milked 400 litres a year. In the southern Swedish uplands the average milk quantity per cow and year was somewhat lower (Björnhag & Myrdal 1994).
One uncertainty concerns the amount of milk given to calves. The accounts from royal farms in the sixteenth century are very detailed, and indicate that very little milk was given to calves, which seem to have been weaned after only a few days. From then on they only got skimmed milk. Consequently, mortality rates among calves were very high: about a half to a third of calves died prematurely.
In the eighteenth century normally more milk was given to calves. Accounts record that a calf would get up to 100 litres. However, the amount of butter made per cow remained around 20 kg. Therefore the average milk quantity per cow and year must have risen to about 500–550 litres.
It remains a possibility that the sixteenth-century accounts hide a more substantial provision of fresh milk to calves (Palm 1998). However, the fact that the size of cows increased speaks in favour of the hypothesis that calves received more fresh (fat) milk after the sixteenth century. The size of cows, as of all living creatures, is determined by nutritional status during the period of growth. In housekeeping books of the late seventeenth and early eighteenth century, the habit of giving calves too little full-fat milk is criticized.
To further test the possibility of low milk yields in the sixteenth century, a calculation of possible metabolism has been made. The sixteenth-century accounts show the amount of hay and straw given to cows. Calculations show that the low milk yields correspond to the amount of fodder provided. It is therefore probable that cows in sixteenth-century Sweden–and surely also late medieval Sweden–thus yielded somewhat more than zebu cows in India did in the 1950s.
In the nineteenth century, milk yields started to rise. This followed from better care and, from the end of the century, from scientific breeding. The exact figures are still uncertain, however. An average cow probably milked 800–1000 litres by the mid nineteenth century, while quantities of around 1,500 litres were normal by the end of the century (Staffansson 1995, 761) (see Table 8.1).
Table 8.1 Annual total milk production and milk yields per cow and year, certain five-year periods, 1871–2000.
| Total milk production, ’000 tonnes | Milk yield per cow, kg | |
|---|---|---|
| 1871–1875 | 1,340 | 1,020 |
| 1896–1900 | 2,375 | 1,360 |
| 1911–1913 | 3,320 | 1,790 |
| 1927 | 4,077 | 2,176 |
| 1938 | 4,664 | 2,531 |
| 1943 | 3,983 | 2,338 |
| 1950 | 4,852 | 2,933 |
| 1961 | 3,717 | 3,110 |
| 1970 | 2,932 | 3,870 |
| 1980 | 3,338 | 5,090 |
| 1990 | 3,432 | 5,955 |
| 2000 | 3,297 | 7,710 |
Sources: for yields and output to 1913, Höijer 1921, 49, and Åmark 1924, 78; for 1927, Höijer 1931, 118; for 1938, SCB 1959, Table E45; for 1943 and 1950, SCB 1959, Table E44; for data from 1961 on, Jordbruksverket Jordbruksstatistisk årsbok 1970, 1980, 1986, 1991, 2002.
Table 8.2 Total annual production of beef etc. (including veal, mutton, and horsemeat) and pork, five-year averages, 1871–2000.
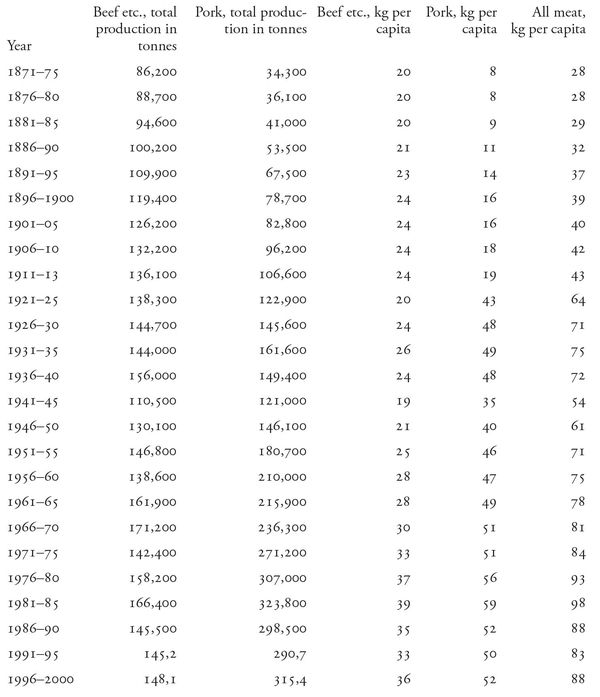
Sources: for production in 1871–1913, Åmark 1924, Table 2; for 1920–39, Juréen, undated; for 1940–55, SCB 1959, Table E44; for 1956–9, Jordbruksverket, Jordbruksstatistisk årsbok 1970; for 1960, 1965, 1970, 1975, 1985, 1990, 1995, and 2000, Jordbruksverket 2005a, Table 2.8; for remaining years 1960–79, SOS 1980; for 1981–4, SOS 1986; for 1986–8, SOS 1991; for 1989 and 1991–4, SOS 1995 ; for 1996–9, SOS 2002; for population data, SCB 2010.
Table 9.1 Annual use of artificial fertilizers (nitrogen, phosphorus, and potassium) in certain five-year periods, 1886–1995 (kg per ha).
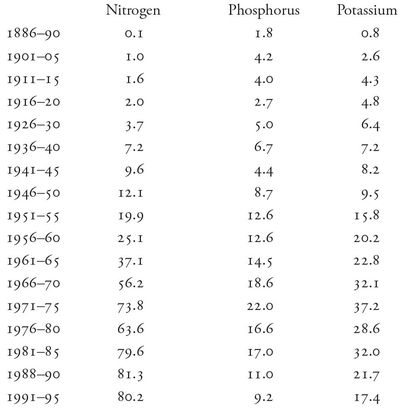
Sources: Jansson 1962; Jordbruksverket, Jordbruksstatistisk årsbok 1970, 1980, 1981, 1986, 1991, 1996.
Table 9.2 Number of tractors in Swedish agriculture in certain years, 1914–1970.
| Year | Tractors |
|---|---|
| 1914 | 60 |
| 1920 | 1,330 |
| 1925 | 3,000 |
| 1930 | 4,900 |
| 1935 | 6,700 |
| 1940 | 20,900 |
| 1945 | 21,000 |
| 1950 | 57,225 |
| 1955 | 116,100 |
| 1960 | 152,600 |
| 1966 | 165,647 |
| 1970 | 181,519 |
Sources: for 1914–25, Thunström 2000; for 1930–70, Morell 1989.