Warren Buffett’s first investment in Capital Cities came in 1977, when he invested $10.9 million at an after-tax earnings multiple of approximately 10 times. In his annual letter that year, he goes on to praise both the quality of Capital Cities’s business as well as its management, led by Tom Murphy.1
However, the significant part of Buffett’s investment in Capital Cities came in 1985, in the aftermath of the purchase of ABC by Capital Cities through a friendly takeover. My analysis of the investment focuses on this time period.
As background: Facing threats of corporate raiders, ABC asked Tom Murphy, the CEO of Capital Cities, to consider a merger. Corporate raiders were not uncommon at the time, and ABC was popular. It was one of the three major American television networks (CBS and NBC being the other two). By the mid-1980s, Buffett had also built a mentoring relationship with Murphy, and so it came as no surprise that, when Buffett recommended Murphy to find a “gorilla” investor to further protect the joint company from corporate raiders, Murphy recommended that Buffett himself become this investor.
The deal was announced on March 18, 1985. Buffett, whose investment is detailed later in this chapter, had a part in the transaction. Berkshire Hathaway was to contribute approximately $517 million in cash for three million shares of new equity in the combined entity. The transaction was completed January 3, 1986.
The annual report of Capital Cities/ABC year-end 1985 provides valuable insight into its fundamental business. The financial information is detailed for both the calendar years 1985 and 1984, and a potential investor would have had access to this information. On page three, there is a segmental breakdown of the combined Capital Cities and ABC business, which is calculated excluding the discontinued operations that had to be sold to fulfill the regulatory requirements of the merger. I have summarized the breakdown of revenues as well as operating margins in the different Capital Cities and ABC divisions in table 12.1. Note that for segmental margins, I have allocated group selling, general, and administrative costs to divisions based on divisional revenues. I have also included the financial statements of both the aforementioned Capital Cities/ABC 1985 annual report as well those from the 1984 ABC annual report at the end of the chapter.
Table 12.1.
Overview of operating segments (1984)
| Business segment |
Revenues |
% total revenue |
EBIT |
% total EBIT |
EBIT margin |
| Cap cities |
| Broadcasting |
$271.8m |
6% |
$138.7m |
21% |
52% |
| Publishing |
$591.6m |
14% |
$126.4m |
20% |
21% |
| Cable TV |
$76.3m |
1% |
$2.3m |
0% |
11% |
| ABC |
| Broadcasting |
$3304.3m |
71% |
$392.3m |
61% |
13% |
| Publishing |
$316.2m |
7% |
$30.8m |
5% |
11% |
| Other |
$64.3m |
1% |
−$45.3m |
−7% |
−69% |
| Total |
$4623.5m |
100% |
$645.3m |
100% |
14% |
As we can see, even though Capital Cities was acquiring ABC, ABC was the larger business based on 1984 year-end figures, both in terms of revenues (about 80 percent) and EBIT (about 59 percent) of the overall group. However, we can also see that the Capital Cities businesses were higher-margin businesses.
To analyze the business divisions of both Capital Cities and ABC and what would result after the merger, detailed information is presented in the operational discussions in the 1985 annual report. Starting with Capital Cities’s broadcasting business in 1985, the business consisted of a number of fairly prominent TV stations and radio stations across the United States. Out of this, three TV stations and five radio stations were to be divested from the Capital Cities side. A similar number of required divestitures also had to be made from the ABC side. The business that was to result from the merger is detailed on pages eight and nine of the annual report. It would include eight TV stations that together had an estimated total outreach2 to about 24.4 percent of the country’s TV audience. The FCC had a regulatory requirement that any television company could at a maximum reach 25 percent of total ADI television homes, so the combined Capital Cities/ABC TV stations would be just below the regulatory maximum. This indicated that Capital Cities/ABC would have the maximum scale and penetration advantage allowed by law. Even more impressive, all of the remaining eight TV stations were, judged by the rankings of their respective news programs, ranked number one or number two in their markets, all of which were major metropolitan U.S. cities. This suggested that the TV assets of the combined Capital Cities/ABC entity would be even better than the individual networks of the two predecessors and thus constitute a truly superb set of assets with major draw of viewership and advertisers.
On the radio stations front, the picture looked similarly strong from a fundamental perspective. At the beginning of 1986, Capital Cities/ABC owned 17 radio stations, seven of which occupied strong roles in the top 10 metropolitan areas in the United States. Although FCC regulation at the time3 required the company to divest some of its radio assets, it had a very strong portfolio and would likely keep the best combination of assets possible under the regulation.
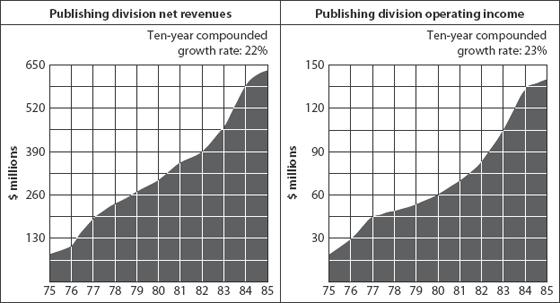
The publishing business of Capital Cities was a very diverse mix of traditional publishing businesses. This included specialty publications like Institutional Investor, an electronic database, and a large number of newspapers. The individual newspapers and magazines are discussed at length in the operational review. The main point that arises, however, is that the business was one that grew in circulation and advertising revenues, and included leading publications in niche market segments. To sum up this point, Figure 12.1 illustrates the development of Capital Cities’s publishing business over the previous 10 years, which is detailed on pages 12 and 13 in the operational business review.
Figure 12.1.
Publishing division—development of revenues and income (1975–1985).
Clearly, the annual compounded growth rate for the publishing business had been an impressive 20 percent-plus both in terms of revenues and operating earnings.
The last business from the original Capital Cities group was the cable television business. In note 11 of the Notes to Consolidated Finance Statements, which is the segmental data, we can see that the cable business first became positive income (going through breakeven) in 1982, and had been growing both revenues and operating profit like the other business units. Still, with $5 million in annual operating income, it was by far the smallest of the three Capital Cities divisions.
Taking a look at the financial statement of Capital Cities, one can calculate based on the 1984 year-end balance sheet what the return on tangible capital (ROTCE) of the overall Capital Cities business was.
Table 12.2.
| Category |
Amount in $ |
As a % of revenues |
| PPE |
$317.9m |
31.1% |
| Intangibles excluding goodwill |
$481.5m |
47.2% |
| Inventories |
$9.8m |
1.0% |
| Accounts receivables |
$145.4m |
14.2% |
| Accounts payables |
−$31.6m |
−3.1% |
| Total capital employed (TCE) |
$923.0m |
90.4% |
The tangible capital base is calculated as $923 million. However, this includes an amount of $482 million (a bit more than half of the total TCE), which are intangible assets such as broadcasting licenses, network affiliation contracts, and publishing franchises. Although strictly speaking, these assets are not goodwill, I would tend to agree with the management that their amortization is theoretically incorrect as their value does not tend to be consumed over time. I have included the note of the management, which is note 8 of the notes to the consolidated financial statements, to further clarify this asset.
The broadcasting and substantially all publishing intangible assets represent broadcasting licenses, network affiliation contracts and effective economic publishing franchises, all of which may be characterized as scarce assets, with very long and productive lives. Such assets have historically increased in value with the passage of time. In accordance with Accounting Principles Board Opinion No. 17, those intangible assets acquired subsequent to 1970 are being amortized over periods of up to 40 years, even though in the opinion of Management, there has been no diminution of value of the properties. Cable television intangible assets principally represent amounts related to individual cable television franchises. Such franchise intangibles are amortized over the remaining lives of the franchises; other cable television intangible assets are amortized over 40 years. At December 31, 1985, the Company’s intangible assets were as follows (000s omitted):
Table 12.3.
| |
Total |
Broadcasting |
Cable television |
Publishing |
| Intangible assets not subject to amortization |
$123,815 |
$103,099 |
– |
$20,716 |
| Intangible assets required to be amortized |
438,700 |
54,877 |
120,769 |
263,054 |
| |
562,515 |
157,976 |
120,769 |
283,770 |
| Accumulated amortization |
81,003 |
4,398 |
30,817 |
45,788 |
| |
$481,512 |
$153,578 |
$89,952 |
237,982 |
* Note 8 from Capital Cities/ABC 1985 Annual Report.
A conservative but fair adjustment—to consider only 25 percent of the total intangible assets in calculating the total capital employed base—would result in figures as follows:
Table 12.4.
| Category |
Amount in $ |
As a % of revenues |
| PPE |
$317.9m |
31.1% |
| Intangibles excluding goodwill |
$120.4m |
11.8% |
| Inventories |
$9.8m |
1.0% |
| Accounts receivables |
$145.4m |
14.2% |
| Accounts payables |
−$31.6m |
−3.1% |
| Total capital employed (TCE) |
$561.9m |
55.0% |
For the after-tax earnings, I use NOPAT based on EBITA (excluding amortization of intangibles) and then adjusted for a prevailing tax rate, which is about 50 percent in 1984. I agree with the management’s viewpoint that these intangibles are for the most part not consumed over time. The costs of maintaining these franchises and licenses are already included in the P&L, and thus should not be considered additional expenses that are capitalized as an asset and then consumed over time. Based on this, the NOPAT in 1984, based on pro forma figures is:
Table 12.5.
| Reported operating income |
$277.5m |
| Add-back of amortization |
+$19.7m |
| EBITA |
$297.2m |
| Adjustment for tax (50%) |
−$148.6m |
| NOPAT |
$148.6m |
Based on these figures the ROTCE is $148.6m/$561.9m = 26.4 percent. This number is based on the after-tax earnings for assuming an unleveraged business.
This is a very healthy return indicating a business that is a good inherent compounder of capital given its double-digit growth (see details in the 10-year financial summary on pages 20 and 21 in the Capital Cities/ABC annual report for year-end 1985).
Switching over to the ABC business, ABC’s largest division was also their broadcasting division. Besides the aforementioned television stations and radio stations, the largest part of ABC’s broadcasting division was the ABC television network. This was the distribution and sales arm responsible for delivering the content produced by ABC Entertainment, ABC News, and ABC Sports with a reach of 99 percent of the nation’s 84.9 million television homes at the time in 1984.
Delivering such prominent TV shows as Dynasty in entertainment (“ranked as the most watched series many weeks [in 1984]”) and 20/20 in news, ABC claimed on page two of its annual report to be “the world’s largest advertising medium for the eighth consecutive year.” Whether this was a clear case of dominance or not, it is certain that ABC was one of the three largest broadcasting networks along with NBC and CBS. With it came advantages of scale and bargaining power with content providers and advertisers.
In 1984, ABC had the very unique position of having the rights to cover both the 1984 Winter Olympics in Sarajevo, Yugoslavia as well as the 1984 Summer Olympics in Los Angeles. The effect of higher advertising coverage on revenues and income was obvious. Although ABC’s revenues had increased by 11 percent between 1982 and 1983, this figure accelerated to 27 percent between 1983 and 1984. Likewise, the operating earnings increased seven percent between 1982 and 1983 and 18 percent between 1983 and 1984. As such, there was a level of “exceptional” profits and earnings, which one should note would not have been expected in 1985 without any Olympic events.
Given that the broadcasting division was by far the dominant business of ABC at the time, as a potential investor I would likely have looked at its other two divisions at a more basic level. The publishing business was an aggregation of several magazine and niche periodicals as well as a book publishing business, which fundamentally was similar to the publishing business of Capital Cities. However, with an 11 percent operating margin, it seemed significantly less well managed or advantaged compared to Capital Cities’s publishing division, which has an operating margin of 21 percent. The last division designated as “other” in the Overview of Operating Segments in table 12.1 includes a set of cable businesses, with ownership of ESPN and a motion pictures studio. Fundamentally, cable television would have seemed a decent quality business as it usually involves recurring subscriptions, but this division was unprofitable at the time.
Looking at the overall financials of the ABC business, one can calculate the following ROTCE based on its 1984 annual report:
Table 12.6.
| Category |
Amount in $ |
As a % of revenues |
| PPE |
$563.2m |
15.2% |
| Program rights, production costs* |
$409.9m |
11.1% |
| Inventories |
$24.8m |
0.7% |
| Accounts receivables |
$422.5m |
11.4% |
| Prepaid expenses |
$136.3m |
−3.7% |
| Accounts payables |
−$31.6m |
−0.9% |
| Accrued program costs |
−$213.7m |
−5.8% |
| Accrued compensation |
−$81.1m |
−2.2% |
| Total capital employed (TCE) |
$957.7m |
25.8% |
*ABC makes a distinction between program rights that are for production of programming and other intangible assets like those related to a brand. The former are considered an asset, while the latter have been excluded (the same as Capital Cities had done).
The NOPAT calculation is as follows:
Table 12.7.
| Reported operating income |
$368.8m |
| Add-back of amortization |
+$5.8m |
| Add-back of interest |
+$5.8m |
| EBITA |
$380.4m |
| Adjustment for tax (47%) |
−$178.8m |
| NOPAT |
$201.6m |
Based on these figures, the ROTCE is 21.1 percent. This is somewhat lower than at Capital Cities, but still over 20 percent, again indicating a good business. This is consistent with an understanding of ABC as one of the leading television networks in the United States with successful TV, radio station, and publishing businesses.
Although it is clear and detailed in the 1985 annual report that some parts of the businesses were to be divested between 1985 and 1986, the core combined entity of Capital Cities/ABC would become a very good-quality business. This entailed that it would certainly be as good of an inherently compounding business, with growth and high ROTCE, as the two original parts.
Turning now to valuation, according to page two (as marked) of the Capital Cities/ABC 1985 annual report, the merger incorporated an investment of $517 million for three million new shares of common stock of the combined Cap Cities/ABC company. This suggests that Buffett paid $172.5 per share. This is consistent with the information given on page 18 of the Berkshire Hathaway annual letter to clients dated March 4, 1986 (1985 year-end). The shares would come into effect at the completion of the merger.
According to the annual report, at year-end 1985 13.08 million shares of Capital Cities were already outstanding. As part of the merger, another $100 million in warrants would be issued, which would give the right of holders to acquire up to 2.9 million shares at a price of $250, i.e., it was out of the money when issued, but would be dilutive once the share price of Capital Cities/ABC went above $250 per share. Hence upon the completion of the merger, a shareholder of the company could be expected to face an outstanding share count of common shares of approximately 16 million shares with dilutive options, further increasing share count to about 19 million shares in the case the stock price went above $250 per share. The 16 million shares were simple enough to handle; any earnings figures would simply be divided by the 16 million shares rather than 13 million shares postmerger.
The cost of the warrants would have been another story. As the value of options is inherently uncertain, there would have been many ways to account for the options. The typical way to handle stock options these days would be to use the Black-Scholes formula in calculating the value of the outstanding options and including it as a liability. Because this method makes use of various assumptions like the beta of a stock, which I find questionable, and was certainly less prevalent as an accepted method at the time, I would not have preferred this method. As there was a market transaction involving these options, a second method for calculating the value of the options would have been attributing the price directly of about $34.48 per warrant, i.e., $100 million for the entire 2.9 million shares. A third method, and the most conservative, would have been to see the full effect of the maximum dilution; in this case, it would be if all warrants were exercised and the share count increased to 19 million shares. In that case, one would have added the additional capital paid in to net cash, which would be $250 × 2.9 million or $725 million, but then would have had to consider the effect of dilution to 19 million outstanding shares. In reality, of course, the actual cost of the options would be based on the share price developments. If the share price never exceeded $250 per share, the options would be worthless. Alternatively, if the share price increased to $1,000 per share, the options would be very valuable.
To start, I assume as a base case that there are 16 million shares outstanding and the cost of the warrants is a liability worth $100 million, not yet considered in the balance sheet. Given the information detailed in the annual report, I come to the following calculation of enterprise value (EV):
Table 12.8.
| Share price |
$172.50 |
| Number of shares outstanding |
16.1m |
| Market capitalization |
$2777.3m |
| Net financial debt (including cost of options)* |
$2027.9m |
| EV |
$4805.2m |
*Note that for the net financial debt, I calculated the figure based on the balance sheet dated December 31, 1985 plus the additional debt that was to be assumed to finance the merger. The calculation includes $768.8m in cash and short-term investments, minus $714.2m in outstanding debt, minus $250m in used cash, minus $1,375 in additional debt, minus $357.5m in commercial paper. As at the end of 1984, ABC itself did not have significant debt, and I assumed that the merger would not have included any additional assumption of debt not already covered by the previously mentioned financing.
The second part of the valuation involves the earnings. As Capital Cities/ABC was to divest a somewhat significant part of its combined business in the merger, the postmerger operating earnings and net earnings would presumably be less than the pro forma figures based on 1984 fiscal year earnings of the Capital Cities and ABC businesses. That figure, as presented previously in table 12.1, was $645.3 million for operating earnings. Moreover, there would be adjustments based on amortization of intangibles and interest to get to EBITA, a metric that reflects the unleveraged earnings power of a business. The EBITA figure for fiscal year 1985 would have been $677.6 million.
Because the exact amount of divestitures necessary would be unknown, I would have approximated that 26 percent of EBITA of the ABC business or about $100 million of EBITA would have been divested postmerger, consistent in the timeframe with how the EV was calculated. This assumption is based on the statement in the 1985 annual report that $920 million in cash would be raised through the divestitures premerger (information one would roughly have known as an investor premerger). The amount represents 26 percent of the total acquisition price of ABC, which was $3.52 billion. Given this assumption that the divestitures made by Capital Cities/ABC are at the same multiples as the overall business, the resulting EBITA would have been $577.6 million. Adjusting for the interest payments and in calculating the EBTA, one would have needed to consider the additional debt load on the new business. If I assumed that the average cost of debt is 10 percent (which given the terms of the outstanding debt seems roughly accurate), the interest cost of the $2027 million net debt would be approximately $200 million. Adjusting for this, the EBTA would be 377.6 million. Assuming a 49 percent tax rate for the overall group (fiscal year 1984 tax rate was 50 percent for Capital Cities and 47 percent for ABC), the adjusted net earnings figure would be $192.6 million. On a per share basis (counting 16.1 million shares outstanding), the figure is $12.0 per share. I use this as the figure for EPS adjusted.
Looking at the EV/EBITA, one sees the following:
Table 12.9.
| EV/EBITA |
1984 pro forma |
| EBIT |
$577.6m |
| EBIT margin |
14% |
| EV/EBITA |
8.3× |
Based on the EV/EBITA figures, Capital Cities/ABC would have appeared somewhat undervalued, but not tremendously so. On the positive side, the Capital Cities/ABC business was certainly a quality business and one that could compound due to its high ROTCE and 10 percent-plus per annum growth rate. On the negative side, a 8.3× EV/EBITA when the tax rate is almost 50 percent is not a very low multiple.
Looking at the PER, one sees the following:
Table 12.10.
| PER |
1984 pro forma |
| EPS (adjusted) |
$12.00 |
| PER |
14.4× |
This is consistent with the assessment of EV/EBITA, that for an inherently great business, Buffett seems to be paying a reasonable but not cheap multiple. One could argue that the resulting business is better than the sum of the parts, and that there are synergies, which I did not consider. This is by choice, as I generally do not want to value things that may be possible but are not there yet. On the negative side, it could also be argued that the year 1984 obviously includes the Olympic effect for ABC and overstates somewhat the inherent earnings power of the company. This is also true, and we should keep this in mind when looking at the 14.4× PER.
Given the fair but not cheap multiples paid, Buffett’s rationale for purchasing Capital Cities/ABC seems to be because the resulting Capital Cities/ABC business would be a great quality business. Both individual businesses had long histories of high steady growth with a high return on tangible capital. Moreover, the fundamental scale and leadership economics that made the two businesses successful would only increase as a result of the merger. Buffett already knew the managerial competence of Tom Murphy, the CEO of Capital Cities, who was to lead the merged company. In speaking about Murphy in his annual letter to Berkshire Hathaway shareholders dated March 4, 1986, Buffett states, “I have been on record for many years about the management of Cap Cities: I think it is the best of any publicly-owned company in the country.” In numbers, according to a story recounted by Alice Schroeder in her book, The Snowball, Charlie Munger wrote to Buffett that Murphy had been able to compound the intrinsic value of Capital Cities since 1958 (for 25 years) at 23 percent per annum.4
In sum, Capital Cities/ABC was a case where Buffett had confidence in the inherent quality of the business and management to a degree where he paid a fair valuation. He did this when he was presented with the opportunity to purchase a large block of shares at a price of $175.25 per share. As an interesting final fact, he did not seem to care about the share price movement previous to his acquisition because the range of the share price of Capital Cities in 1984 was between $123.5 and $174.5, indicating that Buffett paid near the 52-week high of the year.5
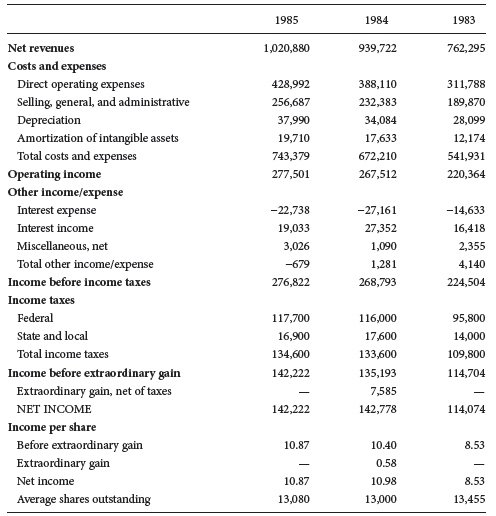
Table 12.11.
Consolidated income statement (Capital Cities/ABC, Inc. 1983–1985)
Year ended Dec. 31
($ in thousands except per share data)
Source: Capital Cities/ABC, Inc., 1985 Annual Report, 22.
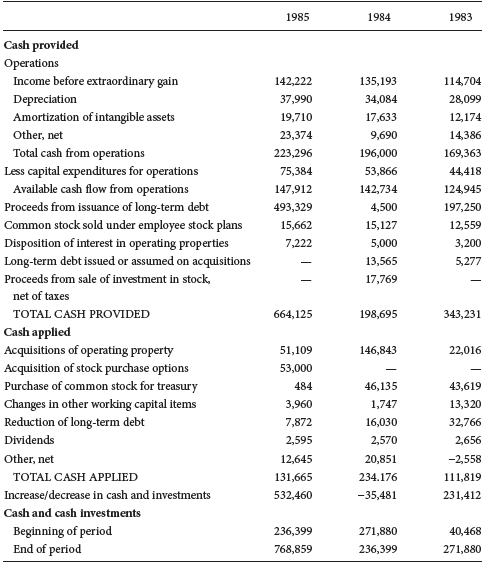
Table 12.12.
Cash-flow statement (Capital Cities/ABC, Inc. 1983–1985)
Year ended Dec. 31
($ in thousands except per share data)
Source: Capital Cities/ABC, Inc., 1985 Annual Report, 23.
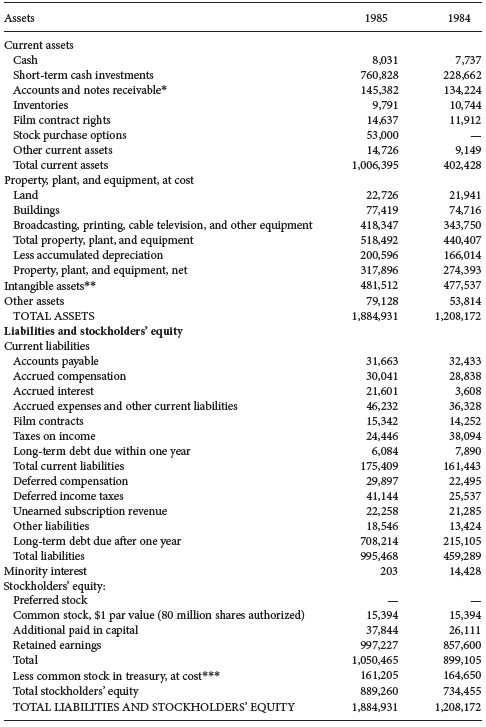
Table 12.13.
Consolidated balance sheet (Capital Cities/ABC, Inc. 1984–1985)
Year ended Dec. 31
($ in thousands except per share data)
Source: Capital Cities/ABC, Inc., 1985 Annual Report, 24–25.
*Less allowance for doubtful accounts of $6,745 in 1985 and $7,369 in 1984.
**Net of accumulated amortization of $81,003 in 1985 and $61,497 in 1984.
***2,395,831 shares in 1985 and 2,526,305 shares in 1984.
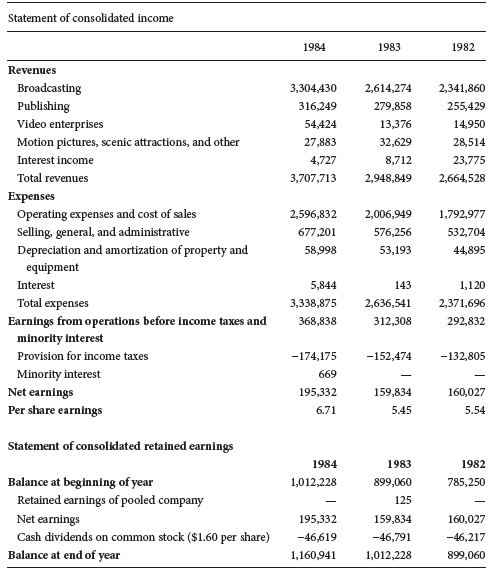
Table 12.14.
Consolidated income statement and statement of retained earnings (ABC, Inc. 1982–1984)
Year ended Dec. 31
($ in thousands except per share data)
Source: American Broadcasting Companies Inc., 1984 Annual Report, 53.
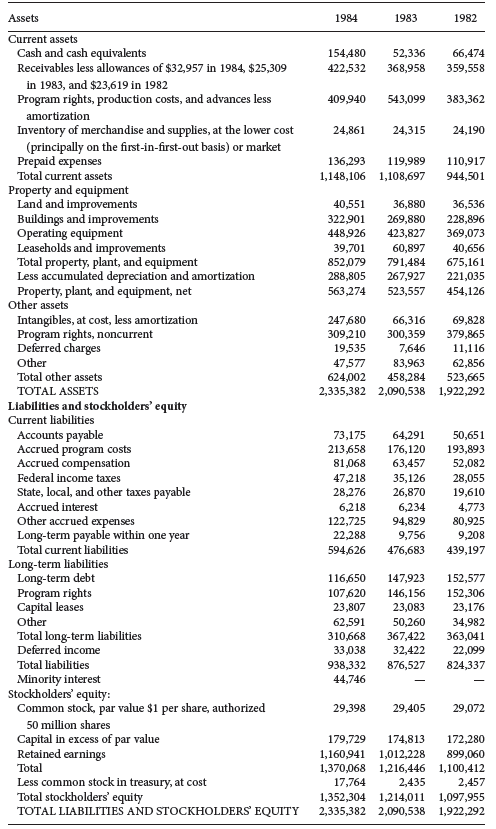
Table 12.15.
Consolidated balance sheet (ABC, Inc. 1982–1984)
($ in thousands except per share data)
Source: American Broadcasting Companies Inc., 1984 Annual Report, 54–55.