This chapter discusses the final subprocess in the Lean Business System Reference Model. Performance reporting and measurement include collecting, analyzing, and reporting information regarding the plus or minus gap between desired and actual outcomes in everything from profit margins to detailed process performance to the selection of associates for promotion. The Lean Business System Reference Model also incorporates four formal assessments:
 The Adaptive Leadership Assessment
The Architecture and Operating Practices Assessment
The Organizational Design and Dynamics Assessment
The Improvement Kata Assessment
These assessments determine gaps and probable root causes between current and desired XYZ Lean Business System performance. These assessments also help to design, measure, and analyze how well an organization’s XYZ Business System is working relative to strategic, operational, financial, technology, and cultural development needs. A key word in this statement is gap. Great organizations are always in the process of closing the gap and exceeding desired expectations—it’s the target value of Kata at work behind an individual, group, organization, system, or component performance metric.
Lean is the mantra of our times. To achieve the long-term successes of Toyota and a few other organizations, the economics of Lean must pencil out across the board—strategic, operation, financial, and cultural development success. The purpose of this chapter is not to expound upon the subject of performance measurement in its entirety but to share some of the best practices from the reference model. Everyone knows about performance measurement. People’s lives are touched by performance measurement every day—at work, driving on the freeway, or at sporting events. There are numerous reporting and measurement activities throughout organizations. Some organizations claim to have a balanced scorecard of metrics that guide their way. Many other organizations are measuring so many conflicting activities that create more confusion than guidance. The Lean Business System Reference Model includes this subprocess for obvious reasons. However, the purpose of its existence is to guide organizations to think about their portfolio of performance reporting and measurement.
Let’s go back to the basics. What is performance measurement? It is a critical process of helping organizations understand, manage, and improve their business. Performance measurement provides financial feedback about how well an organization is performing with respect to goals. It lets organizations know if their customers are satisfied. It provides quantitative data about products, services, and all the processes that produce them. It highlights where the major gaps exist between current and desired performance. Most important of all it provides a variety of information necessary to make the right decisions about improving performance. Is that all there is to performance measurement? Absolutely not. Organizations can have all these attributes in their performance measurement system and fail miserably at performance measurement. Performance measurement also drives the right (or wrong) behaviors to take the right (or wrong) actions to achieve the right (or wrong) results. Performance measurement has a major impact on improvement Kata.
Consider the typical organization. It is measuring the right metrics and the wrong metrics and has set up a process of conflicting metrics between functional areas. Associates in sales are working very hard during the last week of the month trying to sell anything and everything available in inventory with deep discounts in order to hit their quotas. Order entry is making unrealistic commitments to customers to get the order delivered. Purchasing is using premium freight to ship materials from China. Engineering is looking for the cheapest suppliers because its designs must hit a unit cost goal. Following executive directives, sales and operations planning (S&OP) is loading offshore suppliers way beyond their demonstrated production capacity and process capability. Manufacturing is jumping through hoops to ship unplanned products with negative margins, while the planned products and their respective inventories sit on a contractor’s production floor, a warehouse, or a ship. How is the leveling working out in the Lean manufacturing system? Engineers, buyers, and production managers are flying around the world every week attempting to resolve these issues. Finance is pointing out missed targets, returns, warranty problems, high inventories, and operating costs that are over budget. Sales representatives are paid commissions for creating part of this mess.
Think about all the waste of people sitting in hot-list meetings, doing things over, the nonstandard workarounds, and other activities and behaviors that metrics can set off. Functional areas are undermining the metrics of other areas at different times of the month and quarter. Somehow the monthly financial performance numbers are met, but at significant cost, waste, and pain. This is not intentional; it is a dysfunctional measurement process that evolves over time. This probably does not occur in your organization but it is very common, especially at month end—and it destroys Lean! As a Lean practitioner, when was the last time your organization initiated a major effort to improve the process of performance reporting and measurement? When an organization runs with a measurement system that is counterproductive, it creates a chaotic, immediate reason culture that does not think and does not evolve to a higher level. Instead, these organizations operate in vicious cycles of insanity and hyperinsanity. In terms of PDCA (plan-do-check-act), people are always in A mode. These measurement systems create bad improvement Kata. Organizations require strong Adaptive Leadership to pull themselves out of these vicious cycles. More specifically, leadership must create the environment for success, including the right metrics that drive the right desired behaviors, achieve the right desired results, and create the right thinking and behaviors to repeat the process no matter what.
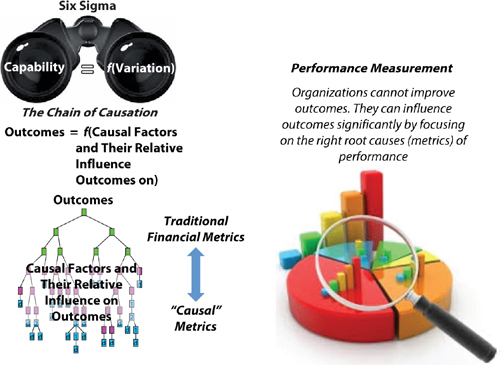
In a Lean Business System organizations need to rethink their complete infrastructure of performance reporting and measurement. Performance measurement must be deliberately designed as a cascading process of defining the right causal metrics that drive the right behaviors and achieve the right desired results. Every organization knows this intuitively, but they fall down in daily practice. Performance measurement is not just about short-term financial performance; it is also about aligning behaviors and developing a culture of excellence. Performance measurement is about creating the right Kata in organizations. For many organizations this is a departure from classical performance metrics and a mindset change for the positive. Organizations must step back and think deeply about the most influential factors of a more holistic performance management system. Figure 8.1 provides an overview of this initial process.
Figure 8.1 Performance Measurement—Lean Business System Reference Model
Copyright © 2015, The Center for Excellence in Operations, Inc.
In Six Sigma one learns a very important principle about variation that applies well to performance management system design. Process capability is a function of variation. One cannot improve process capability without understanding and eliminating, reducing, or managing to their advantage (i.e., a designed sigma shift), the root causes of variation. In practice this involves chasing down the most influential root causes of variation based on Pareto thinking. The final part of this principle is that organizations cannot improve outcomes, especially by edict. Organizations can and should measure top-level outcomes because these metrics are very important to the health and well-being of organizations. Executives can express their concerns about profitability, inventory levels, operating costs, cash flow, margins, revenue growth, and other outcomes. But the best way to improve these outcomes is by understanding and improving the underlying reasons with root-cause-oriented metrics. Mandating a reduction in inventory or more month end shipments seems to work for some executives. In effect, they are asking their people to temporarily change their logic-driven behaviors and react to their requests—often in the absence of data and facts. Attempting to improve outcomes does not address the root causes of these problems. It changes behavior for the worse—because it is constantly changing behaviors in every direction. Many variations of brute force are applied and usually create other larger problems and whack-a-mole behaviors. There is no constancy of purpose. One manager recently explained his role to me this way: “My job has deteriorated to the point where I come to work every day thinking about how I can get myself in the least amount of trouble.” It just is not fun working in environments where performance measurement systems place people in a damned if you do, damned if you don’t position and compromise any chances for real improvement. It destroys every principle of Lean and structured and deliberate continuous improvement. It also drives behaviors and culture backwards. Yet it is easy for organizations to drift into this mode when organizational anxieties run high and the focus is on instant acceptable financial results.
Metric mania, which is described below, is another situation to avoid. Have you ever worked in an organization that had a war room with a hundred charts covering the walls? Again, these are well-intentioned efforts at creating a performance-minded culture. This can lead to several serious performance issues:
First of all, these displays tend to be overwhelming, conflicting, and confusing in terms of where and how to begin corrective actions. Organizations measure too many irrelevant activities. It can become a game of cover one’s back side or pick the metric that best supports one’s position.
It is difficult to distinguish root causes and outcomes. This often leads to discussions about what happened based on intuition, opinions, and perceptions.
Many performance measurement systems are tilted toward short-term financial performance and overlook the longer-term and wider perspectives of infrastructure and human capital investment, market expansion, internal core business processes, and the voice of the customer.
Many performance measurement practices are ineffective at driving improvement because they report outcomes long after the path to the root causes has run cold.
Too many conflicting metrics drive disconcerting behavior patterns and achieve the wrong results.
These efforts become nonactionable, non-value-added work in themselves. This condition becomes exponentially more dangerous as organizations add technologies such as business analytics and digital performance dashboard capabilities into the mix. Technology is a powerful enabler of a Lean Business System, but it can also become an inhibitor of success.
The performance reporting and measurement subprocess of the reference model includes best practices and criteria for analyzing and improving an organization’s performance management system. A robust performance measurement system is very selective in terms of identifying and aligning the right cascading metrics and encouraging the right uniform behaviors for success. Performance measurement systems must support the organization’s strategy and purpose from the highest organizational level downward to the various performance points of origin. At the top of an organization are the typical financial measures. A profit and loss (P&L) statement, balance sheet, and other key financial ratios will remain because they are relevant. However, they must be broadened and balanced to include customer experience, key operating processes, learning and development, and other critical performance categories. Financial performance by itself is a misleading measure of an organization’s health and well-being. Organizations that focus narrowly on financial performance are accumulating very real and hidden waste in the background.
A well-designed performance management system incorporates more root-cause metrics as one goes deeper into the organization and its processes. This design cascades more activity-based process measurements that are known (through data and facts) to influence the higher-level metrics. The design is a broader portfolio of measurements that measure both process and cultural performance. Ideally, performance measures should be expressed in units of measure that are the most meaningful to those who must use them or make decisions on the spot using them. The process metrics are hard metrics, while the cultural metrics are more soft metrics and will require more thought. Performance measures are developed with a less is more mindset and deep analysis of what factors most influence performance. Reengineering a performance measurement system is not a matter of displaying more metric charts on the walls or automating an existing manual process. It requires deep thinking and a perspective that is different from the current practices in place. There is a science to this reengineering process where organizations take the time to understand the relative influence of their performance metrics on performance. They focus on the major influencers and stop measuring trivial factors of performance. The design focuses on eliminating all the waste caused by measuring, tracking, and explaining away trivial metrics. Here are a few common examples of performance inefficiencies in organizations:
Some organizations spend more time and resources on assigning, counting, moving, losing, damaging, and storing a part than the actual value of the part. It makes more sense to expense these items and treat them as point-of-use floor stock rather than treat them as inventoried items.
Other organizations spend more time and resources processing more transactions on the floor than they do in building their products. The accounting department knows where every part is sitting on the floor to the nearest square inch, but is this value-added? Practices such as backflushing, phantom BOM structures, or a single transaction point simplify these situations.
A new product development organization was always under pressure to meet design cost targets—its primary metric. Engineers would search for the lowest quoted cost supplier in China, often a new supplier that the organization had not previously worked with. Additionally they would choose to use through-hole versus SMT (surface mount technology) components because the cost was lower. Design projects were consistently late and over budget. However, as the product development organization met its target design cost goals, one can guess the millions of dollars of waste that was generated because of poor supplier quality and delivery issues, hand assembly and postwave solder rework, scrap, and obsolete inventory. Additionally the hidden costs were millions of dollars in airline tickets, and a design group that spent over 25 percent of its resources on ECOs (engineering change orders) and sustaining engineering after release, rather than developing the next new products.
Another waste is the concise measurement and tracking of labor for cost accounting purposes. In some organizations factory labor represents less than 5 percent of labor, material, and overhead (LMO) costs. Again the cost accounting department spends more time and resources chasing down insignificant labor costs, and the numbers are typically imaginary anyway because of poor standards, unexpected supplier issues, training, design for manufacturability (DFM) issues, and the like. So everything the accounting department uses these numbers for is also imaginary. Many organizations spend too much time managing with imaginary numbers. Asking a production supervisor to explain his or her direct labor variances last month is also non-value-added. An activity-based or pooled costing approach eliminates these wastes—and the overhead to count them.
A final example is a quality department that had 162 defect codes for associates to classify their quality issues on the floor. The intent was good, attempting to classify defects as accurately as possible. Some of these were redundant, and the whole process was left up to an operator’s judgment. This was a measurement repeatability and reproducibility problem. An attribute gage R&R study demonstrated that the measurement system had an 82 percent error rate. To put things into perspective, a game of darts has a much lower error rate. In essence the consistency and accuracy of a single operator or group of operators to classify defects in the right categories was incorrect 82 percent of the time. The quality reports were driving people to work on symptoms and the wrong problems. We looked at the number of annual transactions and the time per defect transaction and estimated that this quality system consumed the full-time equivalent resources of 34 people transacting, adjusting, analyzing, and reporting defect data. The measurement system was reengineered to a more simplified, real-time-based system, and this particular organization increased yield performance by $15 million within the next 18 months.
There are literally hundreds of other examples where organizations are spending too much time measuring the trivial many activities and not focusing enough on the vital few activities. Their metrics are actually hiding rather than exposing problems. It is easy for these practices to become institutionalized by the wrong metrics. Also, it is very difficult for organizations to step back and see these wastes when they are immersed in all of it. These are a few examples to think about when evaluating a performance measurement system. No organization is perfect, and every organization has a few of these performance anomalies. There will be “must do” metrics governed by compliance or regulatory requirements that we do not just arbitrarily throw out of the picture.
It is not surprising that the performance reporting and measurement subprocess of our reference model encourages well-designed visual performance management systems. Like several other traditional mimic the TPS practices, visual performance management is often a going through the motions activity in organizations. Storyboards display A3s, plans, and performance charts, and over time many other data elements end up on these boards. Some of the storyboards and production boards that I have observed could benefit from a 5S exercise. Please keep in mind that this condition is not intended to be a personal criticism, but to encourage managers and practitioners to think more deeply about what is going on and how it is adding value to their organizations. Many organizations can “crisp up” their visual performance management boards and use them to a much greater extent to add value to their organizations.
Taiichi Ohno was the Toyota executive who is credited with much of what is today known as the Toyota Production System (TPS). Toyota’s advancement of fundamental industrial engineering principles and techniques over the past 70 years is nothing short of brilliant. Ohno was known to have drawn several circles on Toyota’s production floor as designated process observation points. He would draw the circles at points where there was a clear view of each process. Then he would go to the gemba and stand in the circle for a short period of time (e.g., 10–15 minutes) and observe, think, and analyze what was going on in the process. During the routine he would use “the TPS 10-second rule.” If he did not fully understand what was going on within 10 seconds, he would record the situation. This routine practice would provide Ohno with new knowledge and ideas to improve the process. After his observations were complete, Ohno would step out of the circle and further analyze his findings and think of incremental improvements to the process. How can one not admire Ohno’s commitment, persistence, patterned behavior, attention to detail, and sheer spirit of improvement? This wonderful professional and his followers spent a good deal of their working lives standing in and out of circles for the cause of continuous improvement. Ohno’s circles are but one of many testimonies to Toyota’s long-term commitment to continuous improvement.
The lesson here is to rediscover Ohno’s circles. Coincidently, his practice can be found in any Western motion and time study book written in the 1950s and 1960s. A key principle is to find a perfect observation point in the process from which to conduct a study (these old references did not suggest drawing a circle on the floor). Another principle is to follow operators and discuss the process with them. Ohno’s deliberate actions and structured approaches evolved this basic principle, and he made the right changes to get the processes to talk to him. Many organizations talk about Toyota’s 10-second rule, but sometimes it takes hours to dig out the real story of what is going on. A big problem is the chosen metrics themselves, and in the design, understanding, and associates’ acceptance of production boards or performance boards. The right aligned causal metrics and associate emotional engagement are the key; otherwise a stand-up review meeting is just another empty ritual of blank stares. Beyond this factor, organizations must plan on placing many new circles throughout their entire enterprise with a Lean Business System. This is more challenging in the professional, knowledge-based transactional processes, but technology is pulling visual management to new heights in these areas.
Another practice in the reference model is called good day, bad day metrics. If you were to roam around the organization, how can you tell if the department where you are standing is having a good day or a bad day? This is more obvious in production because it is the early adapter of visual performance boards. Additionally, you can use your normal senses (see, feel, hear, smell, taste) to evaluate performance. But what about the transactional areas? You cannot assess performance by the normal senses because it is more concealed or hidden altogether. Walk into an engineering department, or an order entry department, or a financial organization, or an R&D laboratory. Are they having a good day or a bad day? Determining this is the objective of good day, bad day metrics.
Many large customer service organizations are experts at good day, bad day metrics. One of these is usually a great organization to visit and stand in an Ohno circle for a while. Many customer service organizations resemble a mini-stock market with real-time digital dashboards for call volumes, wait times, queues, average incident handling times, hold times and abandonment rates, number of unreturned calls, unresolved problems, calls escalated to the help desk, first contact resolution rates, number of problems resolved within an hour and within 24 hours, and other relevant metrics. These digital dashboards are being used by associates to make real-time decisions. The visualization design and built-in intelligence enables instant interpretation and response. They are beating the TPS 10-second rule. In one organization these metrics were strategically placed along the top of the walls to create a pattern and a standard place to look for certain information. For example, staffing can instantly be adjusted by channel to call volumes, which might be on the top left side of the room. This organization can avoid responding to customers with, “I don’t know, it’s not my job” by immediately engaging the help desk. It can flex the help desk when the incident workload display shows a dramatic increasing or decreasing trend. It coaches and develops associates constantly by scheduled listening in opportunities. Beyond metrics, representatives are trained to treat customers like family. It is very simple to see what is going on in these areas. This information is also consolidated into various reports used for coaching and cross-training, individual and group performance, technology upgrades, staff and resource planning, and product and channel problems as well as for engaging other organizational talent in customer service improvement needs. The entire organization operates like groups of fluid, morphing work cells, continuously synchronizing resources to different types of customer incident demand streams. Technology-enabled customer service organizations (internal and external) often provide a good benchmark for good day, bad day metrics. Large consumer products, fashion and merchandising, or retail mail order/Internet catalog industries are benchmark examples because they usually have very impressive, relevant, and actionable customer service performance dashboards.
One of the practices in the reference model is to request the transactional organizations to select and display one to three real-time metrics based on our rule of three: try to pick no more than three most critical metrics that instantly demonstrate to themselves and to executives and process partners if the department is having a good day or a bad day. These are one to three metrics (max) that are inclusive, and not in conflict with the organization’s balanced scorecard system. Here are a few other examples of good day, bad day metric practices:
An order entry department displays the number of orders, dollar value of orders, and number of “dirty” orders that cannot be released (e.g., credit hold, missing configuration information and options, etc.). The dashboard is further customized to display both daily and month-to-date information compared to goals. People inside and outside the organization visit this dashboard frequently throughout the day and discuss how to improve the situation.
The sales and supply chain organizations collaborated on a broader digital dashboard. This system measures and tracks in real time actual sales performance (dollar amounts and gross margins) to the sales and operations plan (S&OP) by customer, dealer, product, geographic region and territory, sales manager, and down to the individual sales representative. It also tracks in real time planned versus actual inventory performance, bookings, backlogs, and forecasting and planning errors. This performance dashboard is not used to point fingers; it is a real motivator for pulling and driving the right consistent behaviors between these organizations. It is used to achieve uniformity among the S&OP, the operating plan, and the financial plan. It has substantially leveled the monthly demand streams and eliminated much of the previous end-of-month volatility. It has also been used to evaluate sales relative to sourcing topology and reshoring manufacturing back to the United States.
New product development is a bit more complex than dealing with existing products and requires a variation on the standard theme. For example, a new product development organization could display just the late projects, the root causes, the corrective actions in progress, and the individual(s) responsible for getting the project out of its late status. One organization created an automated stage-gate scheduling system with due dates and responsibilities for each task of each open development project. It used cycle time guidelines and development team inputs to create the initial schedules. As task due dates approached, a yellow flag would be displayed on the dashboard. As tasks reached a late status, a red flag would be displayed on the dashboard. At any given time all product development managers, engineers, and support resources could view several cuts of the status. One display looked at individual projects and the green, yellow, and red flags (and responsible owners) that were activated. Another display could look at the number of green, yellow, and red flags by resource for either performance or bottleneck situations. Development teams used this digital visual system to better manage and pull shared technical resources to the most important demands and to prevent yellow flags from drifting into red status. Just like production, a red flag triggered an instant shutdown and a meeting of the development team to resolve the problem as quickly as possible.
You can see that it is nearly impossible to achieve this level of performance engagement and integration with manual charts on a storyboard. These are examples of real-time, event-driven metrics. Things change so quickly in business that it is becoming increasingly more difficult to maintain manual performance dashboards and other manual practices (e.g., manual kanbans, magnetic boards, fixed cell configurations, pull systems design, etc.). Technology is providing larger opportunities for improvement in a Lean Business System by automating and evolving key Lean principles and engaging and developing the invisible behaviors of cultural excellence.
The architecture of a Lean Business System is the overarching process of improvement. How does an organization know if its Lean Business System is functioning effectively? Organizations deserve to know the answer to this question and to confirm that their Lean Business System architecture and the key subprocesses are enabling systematic improvement and not detracting from it. The reference model encourages organizations to measure architecture performance and initiate the right corrective actions to this overall process of improvement. A Lean business is never in steady state; there are many factors and events that introduce new challenges or drive subprocess activities and practices to slower rates or off point. In the past Lean and the Toyota Production System have been implemented in many Western organizations with a complete absence of this precision success infrastructure. When Lean initiatives drift off point, there is a high risk of continued drifting without a fully integrated systematic process of improvement. The Lean Business System Reference Model provides an orientation framework for architecting, measuring performance, and sustaining the gains of a Lean Business System.
A good place to start is by referring to the basic aims of the Toyota Production System:
1. Provide world-class quality and service to the customer.
2. Develop each employee’s potential, based on mutual respect, trust, and cooperation.
3. Reduce cost through the elimination of waste and maximize profit.
4. Develop flexible production standards based on market demand.
5. Strive for perfection everywhere.
The reference model is not abandoning these proven aims; rather, it is both scaling and enhancing these goals across the enterprise. These aims have been practiced by other organizations more specifically in relation to manufacturing. In a Lean Business System, executive practitioners will need to think more in a responsive-business-based-on-market-demands goal. This includes both flexible production standards and nimble core business processes.
Organizations should avoid many of the traditional practices (or lack thereof) of the past to gauge the success of their Lean business. Statements like, “People are happier,” or “Everyone likes the new process better,” are nice to know, but they are not performance metrics. Some organizations have measured effectiveness by the number of teams, the percent of associates involved in teams, the longevity of teams, the number of associates trained, the number of black belts per $100 million of revenue, and other irrelevant performance metrics. Last, organizations should avoid measuring and posting the performance of everything. Measuring the effectiveness of a Lean Business System is not a simple and easy practice.
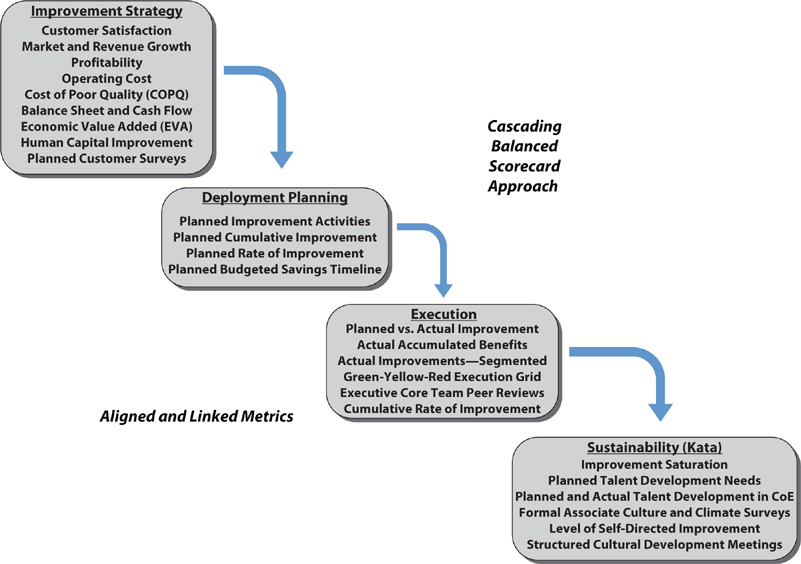
The reference model includes process-oriented metrics for improvement strategy and vision, deployment planning, execution, sustainability and internalization (see Figure 8.2). Metrics should measure improvement progress and soft behavioral alignment as well as cultural development progress. The performance reporting and measurement subprocess of the reference model is focused on Lean Business System performance and does not attempt to measure the effectiveness of business strategy directly. However, a well-designed performance management system will provide quick indications and clue data about the business strategy.
Figure 8.2 Lean Business System Metrics
Copyright © 2015, The Center for Excellence in Operations, Inc.
There are two ways of thinking about measuring the effectiveness of improvement strategy and vision. First, the top-level metrics of a balanced scorecard provide an indication of effectiveness. These might include the following categories:
Customer satisfaction
Market and revenue growth
Profitability
Operating cost
Cost of poor quality (COPQ)
Balance sheet and cash flow
Economic value added (EVA)
Human capital improvement
Planned customer surveys
There is a margin for error in limiting the measurements to the above list. It is very possible that these metrics are improving or declining for reasons outside the Lean Business System scope of activities. For example, winning a new large customer(s), changing customer needs, an unknown supplier material substitution, and many other events can influence these metrics.
To measure the effectiveness of strategy and vision, one of the best practices of the reference model is called performance pegging. This is a process of linking benefits from improvement to the specific chart of account categories in the P&L and balance sheet that they impact. The process adds clarity to the improvement strategy and vision (i.e., are the improvement themes correct, and is the vision becoming reality). The idea is to link and analyze the value contribution for a particular improvement activity. This process requires assistance from the financial organization which conducts a rigorous evaluation of benefits before and after an improvement activity is implemented. All assumptions for calculating benefits are provided by and signed off on by the financial organization. In practice, improvements may be classified as strategic, cost reduction, quality improvement, cash flow, cost avoidance, and so on. There are also ongoing pegging activities. For example, reducing design verification spins may be viewed as strategic and may not produce an immediate financial benefit up front. But this improvement might save tens of millions of dollars in development and quality costs over the next three to five years. Performance pegging reinforces self-respect in teams and individuals and enables them to deliver on what they initially set out to accomplish. It also serves as a learning experience in terms of finance and benefits analysis. This process is not conducted thoroughly for every single improvement activity and Kaizen event, but the financial assumptions and validation still apply. Think of it as a detailed, skip-level financial audit of improvement activities and their actual benefits.
The MacroCharter and MicroCharter provide a useful repository of information for measuring the effectiveness of deployment planning. In Chapter 4 we discuss how these informational templates are typically used to support performance management. Some of the more effective deployment planning metrics include:
Planned improvement activities by major improvement theme, responsible executive, business unit, core business process, functional area, key customer, product families, channels, and so on.
Expected value contribution and timing from planned improvement activities and their alignment to higher improvement themes.
Planned timeline of savings that can be budgeted into the operating plan.
In this area the executive core team and others are using these templates to ensure that the planned and teed-up improvement activities are direct hits to the larger improvement themes. The reference model encourages meticulous attention to planning and maximizing value contributions from limited resources. A Lean business is a precise systematic process; scattered improvement and demonstrations that give the impression of improvement are non-value-added activities.
The MacroCharter and MicroCharter provide a useful repository of information for measuring the effectiveness of execution. Some of the deployment planning metrics include:
Planned versus actual improvement performance (i.e., performance to the deployment plan or schedule, money, and timing).
Actual accumulated benefits achieved and validated by the financial organization.
Actual improvements achieved by major improvement theme, responsible executive, business unit, core business process, functional area, key customer, product families, channels, and so on.
Green-yellow-red execution grid.
Executive core team peer reviews.
Cumulative rate of improvement, aggregate and by other designated organizational and/or core process segments.
These metrics are validating the right results of a Lean Business System. The last metric is very interesting. In the beginning, the cumulate rate of improvement is higher because organizations are making the most obvious strategic and operating improvements. Over time it becomes more difficult to maintain or grow the cumulative rate of improvement without innovation and/or technology. Even in a Lean Business System, organizations must continue to think and rediscover new levels of improvement and superior performance.
The MacroCharter and MicroCharter were deliberately designed to support performance measurement, and they are useful in this category. This is a challenging area because it is the measurement of Kata in a sense. Some of the more effective sustainability and internalization metrics include:
Improvement saturation, measuring the level of engagement of executive sponsors, functional or core business process areas, or individual associates.
Planned talent development schedule (what, who, when, why, where, how) and accomplishments.
Planned and actual talent development offerings in the center of excellence.
Formal periodic associate culture and climate surveys aimed at measuring changes over time compared with best-practice Kata goals.
Level of self-directed improvement (Kaizen events) outside of the MicroCharter by core process, functional area, supervisor, and so forth.
Structured 360 degree, peer review, town hall, communities of practice, and individual meetings.
This section has provided a new best practice: measuring the process by which organizations improve. We have not provided an all-inclusive list of metrics to measure a Lean Business System. Rather, we have provided a partial list to get organizations thinking about the best means of measuring their own Lean business infrastructure.
This process of improvement (especially in Western organizations) has remained the same for decades and has not worked very well in terms of achieving continuous systematic improvement and the associated behavioral patterns and other cultural attributes needed to sustain continuous progress. This traditional process became the accepted norm and was never really challenged as various improvement programs traveled through their respective birth-death cycles. A Lean Business System is dynamic. The reference model architecture is a process and group of subprocesses that are susceptible to the same casualties as any other process. This includes a variation of the traditional TPS wastes: defects, underproductivity, waiting and delays, non-value-added activities, movement between changing priorities, misused resources, unfocused activities, underutilized associates, security and lost opportunities, and an unenthusiastic workforce. The reference model provides a new process architecture for adaptive systematic improvement, and it also provides a means of measuring its effectiveness. If the architecture is not working effectively, the reference model encourages leadership interventions to readapt, change, modify, adjust, or take whatever actions are necessary to sustain a high-yielding Lean Business System. It is leadership’s role to set up an environment for success; the architecture is the process or means by which to accomplish this ever-challenging role.
A balanced scorecard is a performance measurement framework that integrates strategic, learning and development, and traditional financial metrics to provide a more balanced and holistic view of organizational performance. The balanced scorecard approach is very compatible with hoshin kanri and other best practices of the reference model. The balanced scorecard framework is a means of aligning strategy, deployment, and execution. It views performance from both an actionable activity and a behavioral and culture development perspective. The Lean Business System Reference Model stresses the importance of measuring the visible and invisible (Kata) attributes of performance. Figure 8.3 illustrates a generic balanced scorecard from the reference model, including a potential list of key metrics. This is a guide for provoking thinking about balanced scorecards; its actual design uses the strategy map or value creation diagram that we mention in Chapter 4. Organizations should choose the right metrics based on their strategic and operating objectives; they should also be prepared to modify or add their own appropriate metrics.
Figure 8.3 Lean Business System Reference Model Balanced Scorecard—Generic Template
Copyright © 2015, The Center for Excellence in Operations, Inc.
A balanced scorecard retains traditional financial measures of performance. This is a must-do: Executives are bound legally to shareholders, and this is not going away anytime soon. The other dilemma is that executive performance and rewards tilt the game toward short-term financial performance. Financial measures by themselves report on historical events, which is important in order for organizations to gauge their financial health and well-being and to plan for longer-term capital investments. Financial measures are not adequate for evaluating potential future value creation through customer relationships, associate talent development, and an integrated supply base. Additionally, financial metrics do not measure core business processes or value contributions from technology and innovation. A balanced scorecard displays a more complete and well-rounded view of performance by including these future value creation categories. It plays a critical role in translating business strategy into measurable actions, but it also develops the right behaviors and cultural standards of excellence to continue on the cycle of superior performance. Therefore, the challenge to balanced scorecard design is finding the sweet spot between short-term and long-term performance—and also visible business performance versus invisible behavioral and cultural performance. In a Lean Business System executives must learn how to achieve the total scorecard, and not focus on one category at the expense of the other categories.
A balanced scorecard is typically referred to as a management system rather than a measurement system. It is organized into four performance categories:
1. Customer experience. This involves moving beyond traditional customer focus and customer satisfaction and striving for customer intimacy and maximizing the total customer experience. These are leading metrics: unhappy customers have a low tolerance for poor performance in this area and will choose to conduct business with another supplier. This condition will negatively impact future revenues, while the current financials are in healthy shape.
2. Financial management. Timely and accurate financial reporting will always be a priority, and current practices can be improved by the addition of activity-based costing, improved program/project and resource costing, and risk and cost/benefit analysis capabilities. A balanced scorecard does not downplay the importance of financial metrics, but too much emphasis on financial performance leads to imbalances in other important performance categories.
3. Core business processes. This perspective addresses the effectiveness and efficiency of key internal business processes. This category of metrics enables organizations to gauge how well their business is functioning and is very specific to core business process performance.
4. Learning and growth. This perspective includes talent development, behavioral alignment, and cultural development related to both individual and corporate self-improvement. Organizations must deliberately keep their people in a continuous learning mode through structured education, coaching and mentoring, and constant exposure to a variety of workplace experiences. These metrics are the most related to Kata and create the right patterns of behavior in organizations.
In some organizations it might be useful to add another category for environmental, regulatory, and compliance issues. A balanced scorecard also uses a cascading approach with top-level metrics and additional tier metrics for business units, departments, improvement teams, and individuals. Organizations have constructed most balanced scorecards based on experience, intuition, and perceptions of what really matters to success. Although the measurements are more balanced than a pure financial perspective, there is the risk of measuring the wrong things. Not to sound like a broken record, but the danger is that the wrong metrics drive the wrong behaviors, choices, and actions and achieve the wrong results. Too many irrelevant metrics cause a loss of focus on the things that really matter.
How does an organization know if its balanced scorecard management process is, in fact, balanced? Our friend Monsieur Tallpole can help us out. The answer is, “They don’t know what they don’t know”—it has not been balanced by analytical facts. This is not a criticism; it is another opportunity to add precision. A fact is a type of information, but all information is not factual. Analytics reveal that 80 percent of the results in organizations are best managed by 20 percent of their performance metrics. Another way of thinking about this is that resources are spending too much time on efforts that have an insignificant influence on fact-based and data-driven performance. One of the common transactional improvements is something that we have nicknamed balancing the scorecard, an analytical process of achieving perfectly correlated and aligned metrics. This involves an experimental design of sorts, attempting to understand the factors (the lower-tier metrics) that most influence the top-level scorecard metrics. Using several months of detailed financial and human resource data as a sample, the analytics includes predictive analytics, regression and correlation, probability, and modeling to determine the most influential metrics. The analysis also involves the use of variable timing offsets (i.e., this year’s profitability significantly influences next year’s capital budget; this month’s inventory performance influences the next three months of delivery performance; etc.). Every analysis has revealed not only the most influential and leveraged metrics in top-level scorecard performance, but that organizations are measuring many activities that are insignificant to success. One must recognize that this is a statistical analysis and open to anomalies. But the analysis provides insight into the metrics where organizations should focus more and less of their efforts. For example, analyzing and understanding every detail about direct labor variances in a technology manufacturing organization with automated equipment and robotics will have no impact on profitability or revenue growth. In effect, it is non-value-added performance measurement.
Technology is definitely accelerating the transformation of organizations into a complex global network of interdependent transactional enterprises. The physical content of work is being replaced with professional and knowledge-based processes. As the shift in improvement occurs from the manufacturing floor to the transactional process areas, our ability to use our natural senses to solve problems diminishes greatly through traditional Lean performance practices. Additionally, the problems become much more complex and occur at a higher velocity. Even on the manufacturing floor, manually maintained magnetic production boards, pull systems, kanbans, and other principles are rapidly being replaced by technology. Manual cards, kanban labels, cell adjustments, and pull scheduling boards cannot be updated fast enough. When this happens, Lean slides backwards to the push and expedite, whack-a-mole free-for-all mode of production. For those who are dedicated TPS disciples hanging onto these decades, old manual principles, stop—because technology is coming at organizations like a freight train.
One of the future best practices in the Lean Business System Reference Model includes the seamless integration of improvement and technology. No longer can these roles be managed as separate silos. Technology is also morphing from add-on software applications to an integral part of future physical and business processes. Robotics, additive manufacturing, subtractive finishing, 3D modeling and printing, global virtual meetings, real-time digital performance dashboards, and real-time improvement (SIDAM) are but a few examples. Many organizations understand this shift in technology-enabled improvement and are using many technology capabilities in their Lean Business System and particularly in their performance measurement system. Following are a few examples.
Big data and data warehousing: A central repository of data and information which is created by integrating data from multiple disparate sources. Data warehousing improves data quality and integrity by offering a repository of information that represents a single version of the truth. This is a must when you’re attempting to improve complex, enterprisewide transactional processes. The real challenge here is harnessing and leveraging the right data because technology’s ability to generate data is light-years beyond the capability of organizations to analyze and synthesize it correctly. No amount of technology can transform mediocre performance into great performance.
Business analytics: The ability to analyze process performance in real time and make the right evidence-based adjustments. Business analytics enables us to execute what was once completed in a project in real time using a critical thinking cycle that we refer to as a SIDAM (sense, interpret, decide, act, monitor) and continue repeating the process, which is what we refer to as preemptive improvement. Business analytics provides that “sixth sense” needed for transactional process improvement because users and practitioners cannot sense problems before and during the point at which they happen, (i.e., feel an invoicing error, hear an incorrect shipment, touch new products that will be late to market or include field reliability issues, see premium freight, or smell a customer service or warranty problem). Business analytics enables organizations to bring their complex problems into focus with data. In the transactional space, most organizations learn about problems after the fact, and this is not the intent of Lean.
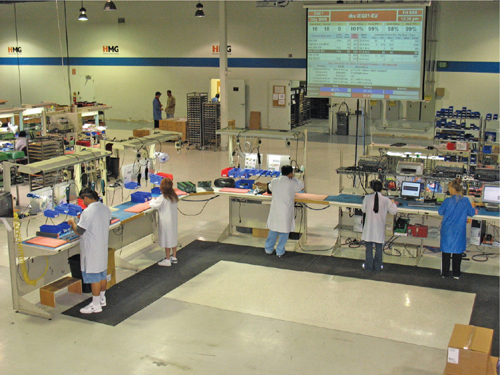
Digital performance dashboards: These provide the ability to measure performance as it is occurring, almost like the stock market. Some of our clients have multilayered dashboards in manufacturing work cells where assemblers complete their work, wand the product bar code, and pass it on to the next associate in the cell. Productivity and quality are updated in real time at the cell and individual level. A second digital panel provides a Pareto analysis of problems experienced during prior builds and standard work instructions plus associate hints (from prior builds) to prevent these unexpected defects. Other organizations view real-time sales progress down to key global distributors; evaluate global supply versus demand positions in real time; monitor contractor and supplier quality performance; monitor distribution center and third-party logistics (3PL) performance around the globe—and take the right data-driven actions to minimize problems. These digital dashboards pull the right people together immediately—sometimes from different global locations—when there are problems. Well-designed digital performance dashboards encourage real-time engagement, empowerment, and self-management. Figure 8.4 is a photo of the cell we describe at the beginning of this paragraph. Note that it incorporates many design best practices which we provide later in this chapter.
Figure 8.4 Manufacturing Work Cell with Digital Performance Dashboard
Virtualization, mobility, cloud technology: This allows for the ultimate management by walking around while being totally connected—anywhere and everywhere. Technology is rapidly placing the gemba at our fingertips on our iPads, iPhones, and other mobility devices—on a table at Starbucks, in a go-to-meeting session, in our automobiles and more often than not at our children’s soccer games and baseball games, and everywhere else. We are connected 24/7 in our work and personal lives thanks to technology.
Data visualization: This is related to technology and deals with the emerging science of displaying data and information to convey ideas and conclusions effectively, both in terms of aesthetic form and functionality. Data visualization attempts to achieve a balance between form and function, thereby reducing perceptions and opinions about different individuals’ interpretations of the end result. This is an emerging science as practitioners and researchers create data visualizations that not only communicate information but reduce measurement system error by engaging people in the right single interpretation of the results and the right evidence-based corrective actions. Data-driven and fact-based decision making is very important. But how organizations choose to design, display, and communicate these facts is critical in order for groups of people to draw the right uniform conclusions and pursue the right improvement needs.
This is just the beginning! Wearable body-adapted electronics, screenless displays, brain-computer interfaces, Xbox-type video business architectures, cognitive computing, advanced virtual 3D conferencing and coaching, and the “fully integrated self” (connected continuously to data about everything in one’s life) are on the near horizon. There is no doubt that technology is evolving faster than organizations can assimilate it successfully. If technology is integrated into a Lean Business System correctly, it will provide new breakthrough opportunities and far-reaching benefits. Technology is definitely a game changer for Lean and continuous improvement because it enables organizations to mine for and uncover their unknown opportunities. One of the largest threats to Lean and root-cause problem solving is that technology is pushing the immediacy and instant gratification factors of decision making. Today, many X and Y generation people who grew up in the digital and gaming age take this technology for granted. They send a text or e-mail—from anywhere, any time of the day or night—and expect an answer immediately. The window of critical thinking is shrinking—or maybe closing a bit. The new generation of workers is using technology in many cases as an end rather than a means (or enabler) to the end. Just because something shows up on a display does not mean that it is the truth or a fact or the right data. The other side of this is that data can often provide a conclusion that does not agree with expectations, but the facts are the facts. A major consideration of technology-enabled improvement that must not be overlooked is that the real intelligence still lies in the improvement practitioner and the user community in the form of human intelligence. There is no improvement intelligence software available that instructs and/or executes improvement automatically, and we cannot replace the tough work of improvement with some new mobile iPhone application—at least not yet!
The process of improvement still relies on human intelligence to define and segment the right root-cause information, analyze data with the right methodologies and tools, draw the right data-driven conclusions, take the right fact-based actions, close the loop with the right performance metrics, and continuously repeat this cycle. The bottom line is that if technology is placed into the hands of a user community that either does not know how to conduct true root-cause problem solving, doesn’t have the time, or does not believe that all of this is necessary, the organization is reduced to “winging it” with new technology and achieving the wrong results. Regardless of what technology is available, people must not forget that they still need to think and go through the basics of interpreting and synthesizing information, drawing the right conclusions from fact-based information, making the right data-driven decisions, taking the right actions with technology, and making sure that technology is working well as an enabler of whatever they are trying to accomplish.
For the most part, traditional Lean manufacturing and the Toyota Production System as we know them are a commodity especially in their principles and tools state and their focus on production. Emerging technology such as business analytics, real-time digital performance dashboards, data visualization, and mobility are having an enormous positive impact on Lean and continuous improvement in general. These technologies are powerful in terms of increasing productivity and eliminating waste, but misuse of technology can introduce waste at much higher rates of speed. These technologies are limited not only to improving performance management, but they also improve the velocity, quality, and effectiveness of the larger Lean Business System architecture and all physical and transactional processes in organizations. The reference model does not include all technology possibilities because they are evolving every day. However, be assured that technology will continue to play a larger role in a Lean Business System.
Digital performance dashboards are having a positive impact on Lean initiatives in which developers think through the process of their design, display, interpretation, and responses. As we mentioned, many of these dashboards can easily incorporate an Andon feature to summon the right people to a performance issue. We share a few examples earlier in this chapter. Some organizations have not had good luck with technology. The largest reason is their failure to think through and map requirements and how the technology will be used. The reference model includes design guidance for digital performance dashboards and visualization. Below is a partial list of the most important design criteria:
1. Design for communication. The objective of performance dashboards is not to be pretty and colorful, but to communicate the right information with clarity and velocity to enable rapid but uniform fact-based decision making. There is a design concept called augmented reality, the science of transforming the vital signs of processes with graphics, metrics, visualization technology, and so on, in a way that results in uniform conclusions and uniform decisions. Take the time to think about and design the best visual display formats (e.g., simple data tables, pie charts, run charts, barometer charts, scatter plots, Pareto charts, etc.).
2. Web-based architectures. Manually maintained storyboards and performance charts are becoming dated because of evolving technology. Performance dashboards must be near real time, promoting instantaneous dialogue and quick responses to problems.
3. The effective quick snapshot. Areas should not have several different dashboards. There should be a single dashboard that displays the headlines of a process. It is acceptable to design referenceable layers in a single dashboard to fill in the answers to the five whys. Another design concept is cognitive design, or designing performance dashboards that are compatible with how the human brain visualizes and processes information. This concept enables quick conclusions, not more questions.
4. A precise logical story. Performance dashboards should be designed with a logical sequence in mind. For example, the first glance is the big news. Below that may be more detail to support the big news. Below that may be the corrective actions in process. Performance dashboards can have layers. If this is the design, then each layer should reveal deeper details. Performance dashboards should not be autostereograms (i.e., posters that one must stare at long enough to see another 3D image emerge from within it) with a blurred picture of what is going on.
5. Exception and alert Andons. This design criterion contains two practices. First, the use of color selectively to highlight the most important information or problematic conditions. A section of a dashboard that changes colors (green, yellow, red) is a good practice. Second, performance dashboards can be integrated into mobility and other technologies to proactively signal and pull the right people together as necessary. A dashboard should never be a static information center waiting to be noticed and acted upon.
6. Ease and simplicity. Performance dashboards should be simple to understand and easy to maintain. Metrics should be readily available without excessive behind-the-scenes analysis and aligned with the balanced scorecard metrics. The last point facilitates ease and simplicity by automating standard countermeasure activity while reducing the Toyota 10-second rule to real time.
7. Connectivity. There must be a direct connection between the data displayed and how associates using the dashboard influence the numbers. The poorer performance dashboards leave people wondering how any of this information relates to what they are doing every day.
8. Consistency and quality. This is a no brainer. The data elements in performance dashboards must be timely and accurate. Timing differences in data can create disagreement about the real story and priorities. Performance data must include the right cascading balanced scorecard metrics that surface the right issues, drive the right behavior patterns, and achieve the right results. The goal is a single version of the truth.
9. Design the total performance dashboard architecture. This means a mapping of how data will be acquired, displayed, and distributed to the right people in the organization. Performance dashboards should be designed up front to integrate other technologies such as mobility, e-mail, texts, customized analytics, and so on. Performance dashboards include much more than developing and hanging up a flat screen display.
10. Experimentation. There is no single recommendation for designing a dashboard, what colors or fonts to use, which graphical techniques are best, or the best design for interpretation methodology. Technology groups should collaborate with users about design criteria. There are references on the Internet as well. The key here is customization to what works best in a particular organization and in a particular situation.
Eckerson, W. 2011. Performance Dashboards: Measuring, Monitoring, and Managing Your Business. John Wiley & Sons, Hoboken, New Jersey.
Few, S. 2009. Now You See It: Simple Visualization Techniques for Quantitative Analysis. Analytics Press, Oakland, California.
Few, S. 2013. Information Dashboard Design: Displaying Data for At-A-Glance. Analytics Press, Burlingame, California.
Kaplan, R., and Norton, D. 1996. The Balanced Scorecard. Harvard Business School Press, Cambridge, Massachusetts.
Kaplan, R., and Norton, D. 2004. Strategy Maps. Harvard Business School Press, Cambridge, Massachusetts.
Vorhauser-Smith, S. 2013. Three Reasons Performance Management Will Change in 2013. Forbes Magazine online. http://www.forbes.com/sites/sylviavorhausersmith/2012/12/16/the-new-face-of-performance-management-trading-annual-reviews-for-agile-management/.