Chapter 16
ISE Reporting and Logging
Abstract
This chapter covers all logging, reporting, and monitoring features you would utilize in ISE after your deployment is up and running. We start off with common/more helpful reports, move into logging configuration including sending logs to remote syslog servers, and then go over internal monitoring in ISE that can be used to alert you to possible issues. Finally we’ll finish with some examples including using ISE logs to augment an Identity Firewall with Cisco ASAs as well as the configuration of an easy-to-search archive of all ISE logs.
Keywords
reporting
logging
syslog
monitoring
IDFW
Introduction
A lot of what we do within ISE covers things happening in real time; anything AAA related is occurring “right now”; profiling happens while a device is actively connected, data in the authentication view is all real time (or at least an active session) but what about when we want to go further back than 24 h? That’s part of what reporting provides to you as well as being able to look at guest access, ISE deployment stats, and if you are wild enough TrustSec info.
Reporting
Reporting is located under: Operations → Reports and the reports are broken down into five categories:
• Authentication Service status: This report focuses on machines/users and their AAA interactions with ISE.
• Deployment status: Information about your ISE deployment such as administrator logins, audit/change logs, and misconfigured supplicants/NADs.
• Endpoints and users: Profiling, posture, Adaptive Network Control (ANC) (formally Endpoint Protection Service [EPS]), MDM, and Supplicant Provisioning reports are here. This area does have some overlap with the first category but the authorization reports are more cumulative in nature.
• Guest access reports: Anything specifically guest related will be here such as sponsor logins and AUP acceptance.
• TrustSec: This area provides reporting for some specific features dealing with TrustSec but it’s not widely deployed right now.
When you first start using reports, be ready to run a couple of different types to really figure out what you want to find. Like we mentioned above, there is some overlap in different categories that can cause some confusion right off but hopefully we can provide some common examples to smooth out the edges.
Globally there is one setting that can impact your ability to look at reporting data in ISE and that is the Data Purging setting. Administration → Maintenance → Data Purging should be configured to retain as much data as your institution feels necessary to get what it might need for historical reporting. When deciding what to set this value, too, there is a really quality chart that’s available on the ISE Hardware Installation guide under VMWare (http://bit.ly/1LVSVdu).
This chart should hold true for most deployments. If you have a low number of authentications from your endpoints (they aren’t moving around or you have long/no reauthentication timers), then you will probably see more days than listed here. Conversely, if you have a highly dynamic environment with people moving around, bringing on new devices, etc., you might see a smaller number of days than listed above. You of course can’t have 50,000 endpoints with a 200-GB monitor node, set the data purge value to 365 days, and expect to keep those many days. Data will be purged as needed to reclaim space but keeping the value set to what you really need will keep your monitor nodes nice and snappy—and everyone likes that!
If you have a Security Information and Event Management (SIEM) that you use for security event monitoring and correlation, keeping logs on the ISE monitor nodes for a long period of time may not even be desirable. In that case, feel free to reduce the data purge timeout to what you feel would be useful for troubleshooting and then configure syslog export for your historical data needs.
Running reports in ISE is pretty easy; to get basic output for your selected report just click Run and you will see the relevant data for “today.” You have other time range options as well but anything more than 30 days will inform you that the report can take a fair amount of time to run. You can either let it run normally (if you don’t think the report will generate that much data) or tell ISE to let the report run in the background. The background option prompts you to select a repository where a CSV file of the results will be saved.1
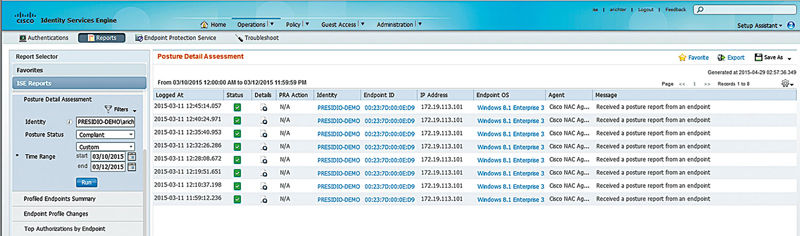
After the time range selection, you will probably notice that there is a whole lot of data there that might not be relevant to you; this is where filters come in. Adding filters is as easy as clicking a button and then checking off what you want to filter by. You will probably use Identity (username) and Endpoint ID (MAC or IP address) the most but anything in the report can be used as a filter. When inputting your filters, ISE will help you out if it can; Identity/Endpoint ID fields will search through the information ISE has already to let you select something. If a field has only a few fixed values, then ISE will give you a dropdown that lets you select the possible options. Some reports have very few filter options, such as the AAA Diagnostics Report (which out of the box won’t produce anything as it requires you to enable specific logging categories), so don’t expect to always be able to filter by user/MAC/IP. Here is a quick example of how to get quality information from a report. One of our favorite reports is the posture details report. You may want to know all the times a user may be complaint with posture or uncompliant and on what identity (MAC) they’re using over a specific time period. Here we selected time period, an identity (username), and the posture state we want to report on.
The final section of reporting is in the top right corner of the reports area. Here you will see options to favorite a report, export the report data, and save the report as a custom report or schedule it to run on its own. Favoriting a report adds it to the Favorites section on the left-hand side of the page and is handy if you are running a single report a fair amount. We recommend adding the RADIUS Authentications and the Current Active Sessions reports right off; you will more than likely use them a lot but add others as needed. Exporting a report lets you dump the contents to a configured repository as a CSV file to you can do more with it (creating graphs, advanced filtering, etc.). Saving custom reports lets you save the additional criteria you might define while trying to filter specific data, so if you find yourself always running the RADIUS Authentications report looking for failed attempts because a subject wasn’t found in the identity store then you can save that information into its own report. When you get back into ISE to run the report later, it’s only a single click instead of having to add the filters again. Similarly if you are exporting a reports data a lot, you can schedule that report to run once, daily, weekly, monthly, etc., and then export out to a repository of your choice as well as optionally sending you an email to let you know it was run/exported.
Scheduled reports open up a lot of possibilities for automating reporting; exporting to a system with some scripts/programs running to consume the data and reformat it can greatly improve your view of ISE when starting your day.
Let’s look at some common scenarios and some reports that might help out with them.
Scenario: Management wants to see weekly views of a new ISE deployment.
Report: Authentication Summary with time range set to “Last 7 days.” This report has some good information including a daily bar chart of passed/failed authentications, a table of the same information with some addition context, and failure reason/NAD/location summaries.
Scenario: Some users are reporting their mobile devices are no longer getting network access one morning and a profiler feed update was performed the previous night.
Report: Endpoint Profile Changes with the filter “Show only changes due to feed service” added and checked off. This report will let you know if any of your devices had their profiles changed because new/more exact profiles were synced to ISE. From here you could either roll back the change or (since you are following best practices and using logical profiles) add the new groups to your logical mobile device profile so your users can gain network access.
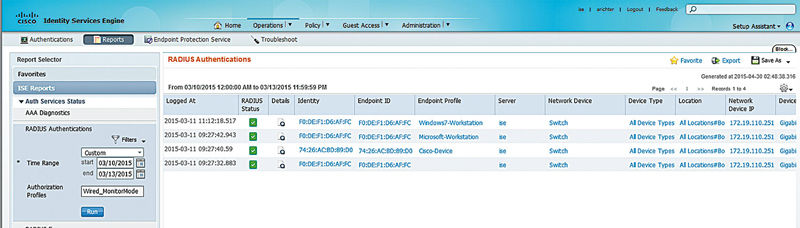
Scenario: You have deployed a wired deployment in monitor mode and you want to see how many clients are hitting your monitor mode rule before you change the deployment to enforcement.
Report: Radius Authentications in the Authentication Services report menu will help you determine which clients are hitting which authorization rules. In this case simply configure your filters to specify which authorization profile (result) you would like to see the utilization on. You’d need to be sure you had a specific authorization result if you care about a specific rule, but if you’re looking to see what devices are using monitor mode, you’ll see both their MAC addresses but also the switches they’re utilizing and what switchports they’re connecting on.
Scenario: Clients are failing posture rules after a deployment and you want to know which rules and what clients.
Report: Posture Detail Assessment with the Posture Status filter set to NonCompliant. You will be shown a list of failed posture reports from clients that includes their username, MAC, IP, OS, and the posture agent being used (NAC or AnyConnect). From here you can get detailed reports per client to see which rules are failing and why. If you need more information, you can run the Posture Troubleshooting tool under Operations → Troubleshooting.
Logging
When it comes to logging, ISE has a few options available to you depending on what you prefer to use or what you might already have deployed in your own environment. Logging categories list the types of messages that ISE can generate, their targets, the severity level, and whether they are being logged locally. Targets are remote machines that ISE will send events to so they can be stored there; we’ll cover them more in a bit. The severity level is mainly cosmetic; if you don’t think an event is important or you want to rate another more critical, then you can change the category. Local logging, out of the box, is enabled for all categories except passed authentications (those are passed to the monitor node(s) anyway) and can be useful for debugging issues that may come up during operation. The logs are purged from the local store after 30 days by default but that is generally a good enough value and should really only be changed if you have good reason. Like purging on the monitor nodes, space will be reclaimed as needed.
Remote targets are basically just syslog servers that ISE sends information to. ISE will define between two and three on its own; one of them will be used for RADIUS profiling information and one or two more will be defined for your monitor nodes. The ProfilerRadiusProbe target can’t be deleted or edited in any meaningful way since doing so would break some functions of profiling; the LogCollector targets can be disabled if you want to turn off all logging but again this is not recommended. Normally the logging connection between the PAP/PSNs and the monitor nodes is UDP based since it provides low overhead. However, if you require it, you can enable the TCP logging target and replace the UDP target with that instead. TCP provides some benefits if your connection is prone to packets dropping/arriving out of order but it’s slightly more resource intensive because packets need to be acknowledged by the receiving monitor node. If you have network conditions that cause you to evaluate TCP for the above reasons, it’s highly suggested that you resolve the root issues if possible since those issues between nodes can be problematic for other things besides logging; see the deployment section for more information.
Now if we want to define our own log targets, then we have three options: UDP, TCP, and Secured. UDP is the most commonly seen syslog method since it is easy, stateless, and more widely supported by receiving systems. A downside though is that since UDP doesn’t provide acknowledgment of packets ISE will never know that messages didn’t reach your server. TCP on the other hand provides ISE with the ability to detect that a syslog server has gone down and actually buffer messages for a period of time. When the server comes back online, ISE will begin sending those messages, clearing the buffer by First-In, First-Out (which is also the method used to purge messages if the buffer becomes full). Secure syslog builds on TCP syslog and adds public-key encryption to the mix so that messages between ISE and your syslog servers can’t be tampered with or seen by prying eyes. To set up a secure syslog target you need to select a CA certificate that ISE already trusts and is the CA that signed the certificate of the remote server. If you are using a self-signed certificate on your syslog server, then you must upload that certificate as a trusted certificate and trust it for client authentication and syslog. If you’re using a signed certificate in your secure syslog environment, the CA chain of the certificate should be uploaded and also trusted for client authentication and syslog.
All remote targets you create have the option to also include alarms as well as the selected categories of messages but chances are you won’t use this option. Sending alarms might be useful if you have a central platform that handles alerting and you want to only send alarm data to it instead of ISE doing its own alerts but if you are sending typical logging categories then you will see duplicate information by including alarms. The last thing to consider is your maximum message length which will determine how big the syslog message will be before ISE splits it into multiple individual messages. In a small or simple deployment your messages may always be less than 1024 bytes so you don’t have to worry about fragmentation or split messages but in larger and more complex deployments with large AD infrastructures with lots of groups, EAP-Chaining, etc., you can quickly go over even larger packet sizes due to more complicated authentications. ISE does include unique ID per entire message (even if it’s split across multiple packets) but the system you are sending that data to has to be smart enough to stitch them together if they are split up. Without stitching events together you will have partial events that don’t contain relevant information and can cause complications if you are trying to correlate events.
Once you create your remote targets, you need to assign them to logging categories so ISE knows to send that information to your destination. If you are sending messages off for more historical archiving/report running, then you would probably want to duplicate what ISE itself sends to the monitor nodes, so going into each category that already has a “LogCollector” target and adding your remote target probably would fit well. If you want to send information off to another system to be there if you need to troubleshoot ISE system issues down the road, you might want to add your target to all the categories that have “WARN” level severities and contain diagnostic information. If you have SIEM and want to correlate/log user sessions, you would probably want to send Passed Authentications, Failed Attempts, and RADIUS Accounting.
Check with your SIM/SIEM vendor before configuring ISE to send data; you might be able to send more categories and glean more valuable information from what ISE has to offer. There is an ISE/SIEM compatibility matrix that may help you evaluate the correct version of SIEM you should run. ISE supports many popular SIEM platforms.
Logging categories also impact reports you run since the report data is pulled of the monitor nodes. If we go back to the AAA diagnostics report we looked at in the reports section and we run it, we’ll see that, with a default configuration, we get no results. This is because the report looks at diagnostic categories (Authentication Flow, Identity Store, Policy and RADIUS Diagnostics) that aren’t logged by default. In order to run this report you should add your LogCollector target(s) to each of those categories and then rerun the report.
Along with operational and diagnostic logging, ISE also allows you to centrally control the debug logs of your entire deployment right from your PAN. Going to Logging → Debug Log Configuration should show you the list of all your nodes and selecting one will show you a large list of logs that can be tweaked based on your needs. Until you are comfortable with ISE you should probably mess only with these when told to by TAC since making can potentially lead to reduced performance as applications have to log more data about what they are doing. However, if you know what component of ISE is having issues, this area is also a good way to gather information that can possibly lead you to your own answer or make finding Bug IDs on Cisco’s site easier. After you have adjusted the logging level you can get to the logs two ways. The first way is going to Operations → Troubleshoot → Download Logs → 〈node name〉 → Debug Logs tab. You might have to do some checking to find the correct log file (try matching the description from the debug log configuration page with the log description) but you will be able to download individual files here. The second way is using the CLI from the node you have enabled debug logging on; running “show logging application” will list out the files you can select and then running “show logging application 〈log file〉” will paginate the output for you. From the CLI you also have the ability to pipe data through other programs (very similar to how you can in IOS) in order to find some specific data. For example, if we wanted to find any errors in ISE’s main logging file, we could run “show logging application ise-psc.log | inc ERROR” from the CLI and we would see only log lines that have the word ERROR in them.
During upgrades all diagnostic/debug logging is disabled during upgrades or restored from backup operations. If you use this information for day-to-day operations,2 you should make note to re-enable it.
Monitoring
Both reporting and logging are handy and important parts of ISE but once you have your deployment up and running there is a pretty good chance you are going to want to keep it that way. Since ISE is going to play a key role in giving your users access to the network (and in more advanced deployments, controlling access at all levels of the network including servers) you will want to know if something is or starts to go wrong. That’s what we’ll talk about in this section.
When you start off and log into ISE for the first time, what’s the first thing you see?
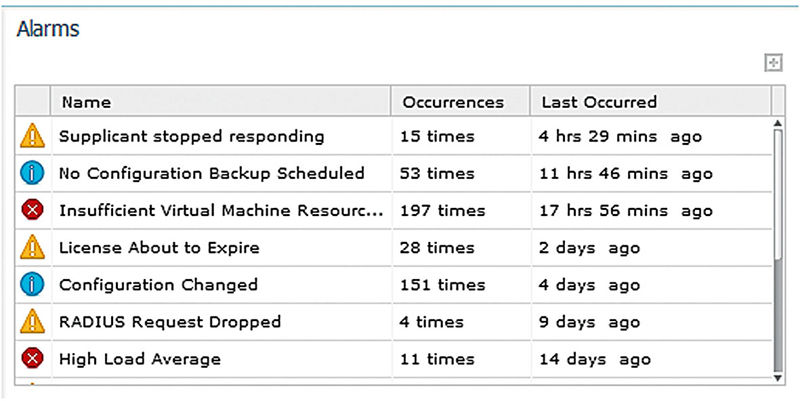
ISE has a ton of alarms to let you know when something is going wrong, or even normal events that you should be away of such as configuration changes/missing configuration backups. Head to Administration → Settings → Alarm settings; ISE 1.3 has 73 alarms built in for you which is good because you can’t create your own—not that there is much else you can cover that isn’t already. From here you can also set up who should get emails when alarms are triggered and the sending email address. It’s highly recommended that you configure these settings before going into production so you can detect if things start to go wrong.
Most of the events and their severities are pretty spot on but you will see in your deployments that some can be a little noisy while others you might way to pay some more attention to:
• Configuration Changed: This event is fairly important for auditing and especially if you have more than one administrator making changes. The downside is that some changes can be very noisy; adding a profiling rule to the “Workstations” profile, for example, can generate >100 emails as the profile is reordered and each step counts as a change.
• Slow Replication: There are three events here that are similar: info, warning, and error. Each one triggers at a certain threshold level when messages for a specific node had queued up beyond a safe level. You should really never see these events at all unless you have a node purposely offline or have WAN replication issues and nodes in other locations. If you see this event, even the info level, you need to look into it.
• Misconfigured Network Device/Supplicant Detected: These events are probably going to be noisy and unless you have complete control over all your supplicants the second one definitely will be. From a NAD perspective bugs in all supported WLC versions until 8.0 will cause this to always fire for WLCs. The recommended configuration for NADs in this book should give you the correct settings needed without having to worry about these alarms.
• CoA Failed/Supplicant Stopped Responding: Similar to the misconfigured supplicant, unless you have perfect control over your supplicants and endpoints these events are going to be very noisy. Neither event indicates anything is wrong and it’s safe to turn them off.
• RADIUS Request Dropped: Another event that can be disabled although could have some valuable information/alert value. This event can fire if users enter the wrong password, supplicants send duplicate information, user wasn’t found in your identity store(s), supplicant abandons its session, etc. Some events could indicate that something is wrong but other alarms should alert you and be much more exact/less noisy.
Now the above is just a guide since you will probably want to enable alarm notifications but also don’t want to get flooded with emails. If you leave notifications turned off, then leaving all the categories turned on can give you a good idea of what you might be seeing and then disable those categories if needed. You also have the option of sending the alarms off to another system via syslog for more specific alerting, throttling, etc.
Besides the alarms ISE also gives you the ability to filter data all over the place within the GUI. Typically you will see blank boxes at the top of columns that let you input strings along with basic patterns to match, like in the authentications activity view. Patterns allow you to expand the traditional searches you could do in previous versions of ISE that only looked to see if what you typed in was contained anywhere in the target strings. You can still just type part of a username into the Identity field and have it match but you can also put “!jdoe” to match all identities that don’t have “jdoe” in them. Along with that, the following patterns are available to you in ISE 1.3 and higher:
• {}: Empty values
• !{}: Not empty
• john*: Matches when the value starts with john
• *doe: Matches when the value ends with doe
If you need a quick reference, hover over the little “i” in each column name.
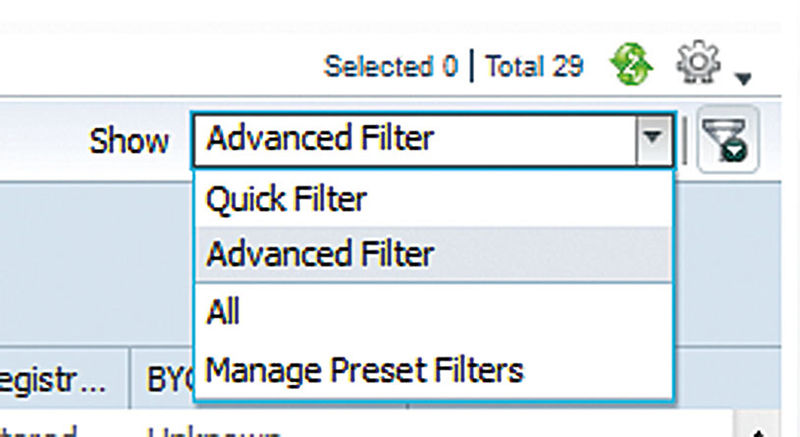
In other areas, like the endpoint/identity views, you have to click the filter button on the upper right of the window listing the results and that will let you put text filters (but not patterns) in to search. These areas will also let you create advanced filters that contain multiple conditions and then save them for later use if you want. Text filters are straightforward so let’s look at the advanced ones and see what we can do with them. First, we’ll want to actually get them on the screen, so go to the “Show” dropdown and select “Advanced Filter”.
Once you do that, you should see the first line presented to you where you can select the property and what value you want to search for. Clicking the “+” next to that line will add another property that can be checked as well as give you the option of making the query match all values you input successfully before matching or if an entry can match only a single one. If we construct a simple advanced query, it might look something like this.
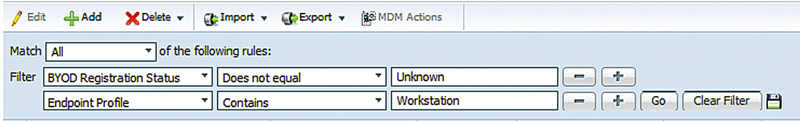
We’re looking for any device that has a BYOD status that isn’t unknown (so it’s done something with the BYOD flow) and has a profile that has “Workstation” in its name. If this is a query we routinely want to run, maybe it’s part of a checkup; we can click the Save icon, give the query a name like “BYOD Workstations,” and then the query will be ready for us to use at any time in the future without having to recreate it.
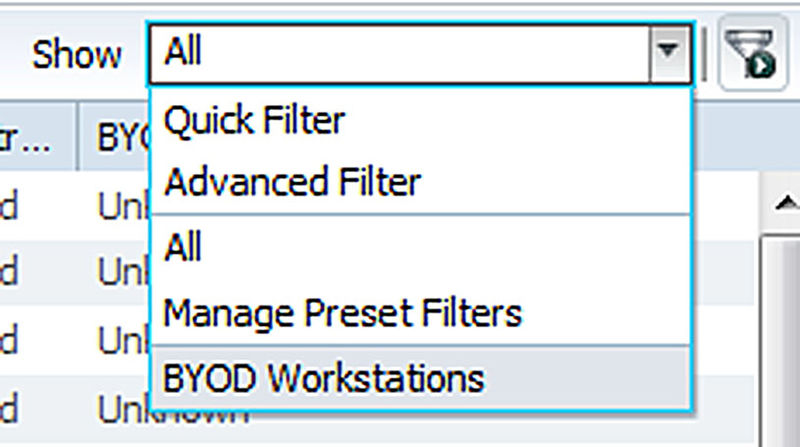
You can also select the “Manage Preset Filter” option to edit or delete any saved filters.
What if you are seeing information from clients that you don’t want to? Collection filters let you do just that, using attributes such as username/MAC/NAD to filter passed/failed/all events for specific clients. Once created, the rules are sent to the policy nodes and impact the PSN’s sending events to the syslog servers defined in your deployment (including the MnT nodes). You can create any number of rules here but for performance reasons it’s recommended to keep the number under 20.
A common use for this would be to filter out the RADIUS test user that is used by your NADs to test the PSNs to make sure they are operating correctly (see Chapter 7 for more information). Since you are going to be seeing passed/failed events from this user roughly every 5 min per NAD and there isn’t much use for it to be logged you can safely drop all events from it. Collection filters are defined in the logging area and this example would look something like that shown here.

You can also bypass any collection filters should you need to get additional events for troubleshooting some clients. Bypass can be configured from the same area we created the example filter, which would also let you define a duration up to 8 h to apply the bypass, or you can do it directly from the authentications live view. Right-clicking the MAC/username of an event will give you the option to bypass suppression for 1 h or if you select “Modify Collection Filter” it will bring you to the collection filter creation page with the selected attribute already populated in a filter that you can edit before saving.
However, what about misconfigured clients? A single bad client can introduce a sizable load to a PSN if it continually tries to authenticate incorrectly. In order to deal with these clients you can configure Anomalous Client Suppression to both detect and then optionally block attempts by these clients to authenticate until they are correctly configured. Anomalous Client Suppression is configured under Administration → System → Settings → Protocols → RADIUS (easy to find right ☺). By default this feature is enabled and its options are turned on which can sometimes make first-time deployment troubleshooting a challenge. If, in the initial stages of your ISE deployment, you would like more real-time information about authentications without suppression, this is safe to disable.3 The default intervals don’t require much tweaking to them out of the box; the only one you may want to change is the rejection interval based on the types of clients you are having issues with. If your anomalous clients are typically misconfigurations and you have lots of transient users, then it might benefit your users to move from 60 to 30 or 15 min. If you have tight control over your supplicants, then you might want to extend 60 to 120 or 240 min giving you time to find and address the endpoint before it can try and authenticate again.
Examples
How about some real-world examples of using logging functions to make use of the information ISE has to help us out?
Send Events to Remote Servers
This is a pretty basic thing and we discussed it a little bit earlier in this chapter but since it is required for the following examples we’ll make sure we cover it well so you have a good starting point.
First, head into Administration → System → Logging → Remote Logging Targets and click the “Add” button. We’ll go through each of the three types so our bases are covered but make sure you are picking the target type that fits you best—secured syslog is pretty cool but unless you have regulatory requirements or traverse untrusted networks you are probably just setting yourself up for more complexity than is really needed.
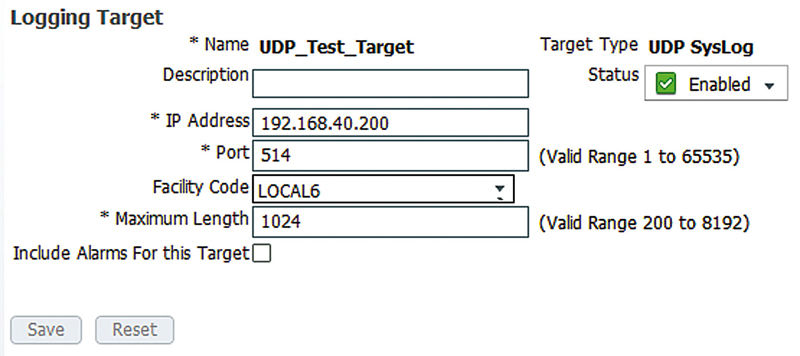
Kicking off with UDP, you can see here our setup is basically right out of the box and we have put in only the name of the target and the IP address that is hosting the syslog server.
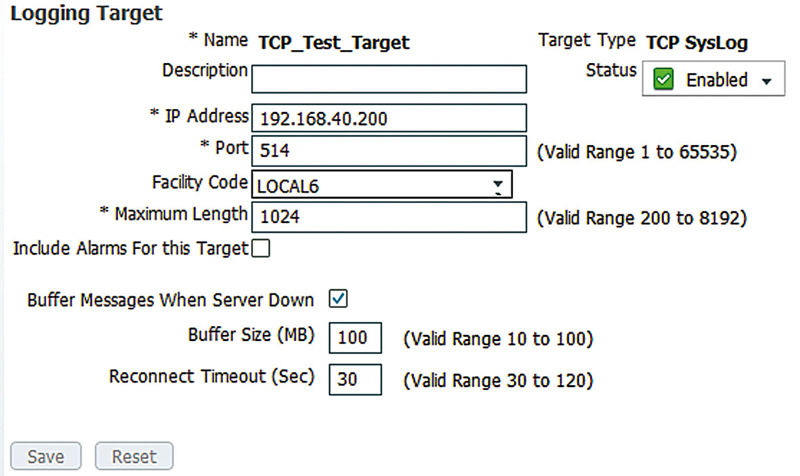
This shows that our setup for a TCP log target is similar. In this case our test server’s port is still 514 so we’ve changed that and we’ve also enabled buffering of messages if the syslog server goes down. The amount of data the buffer can hold depends entirely on how active your ISE environment is but in most cases it should be plenty to support rebooting the syslog server for updates or something similar. For 90% of installations this is probably the type of log target you will want to use.
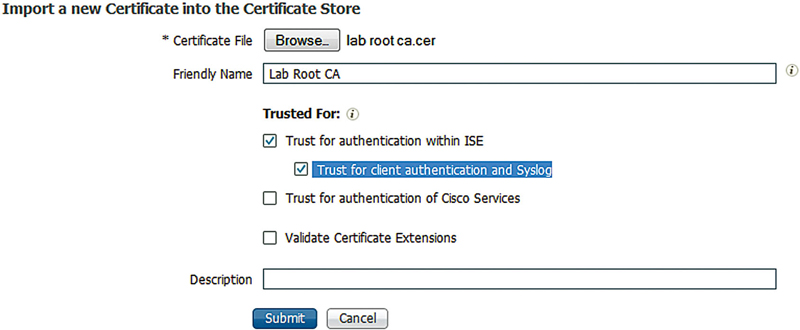
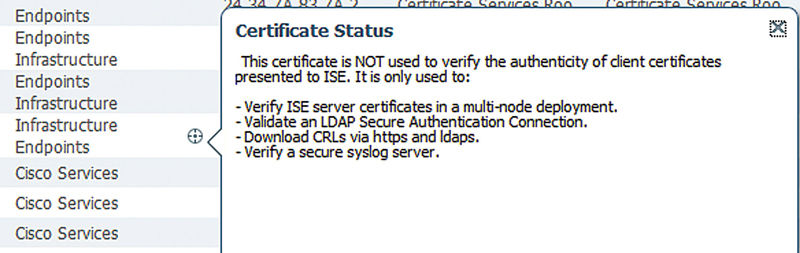
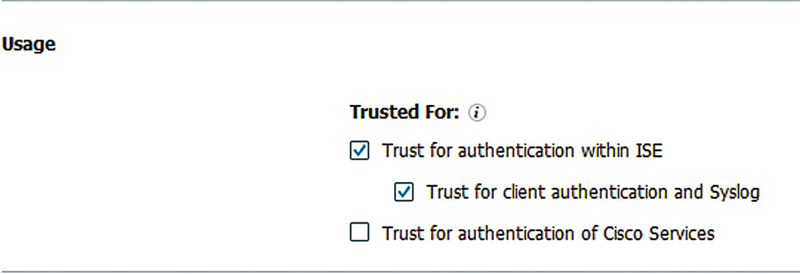
In order to set up a secure syslog target we first need to make sure that the CA certificate used by our syslog server is imported and trusted correctly. The first image shows an example of the settings needed when importing the certificate; make sure the highlighted section is checked off or else ISE won’t actually trust the certificate for what we want to use it for. If you already have certificates imported and want to check them, then in Administration → System → Certificates → Trusted Certificates you can hover over the little “target” in your certificate’s “Trusted For” column and if the last line says “Verify a secure syslog server” then you should be all set.
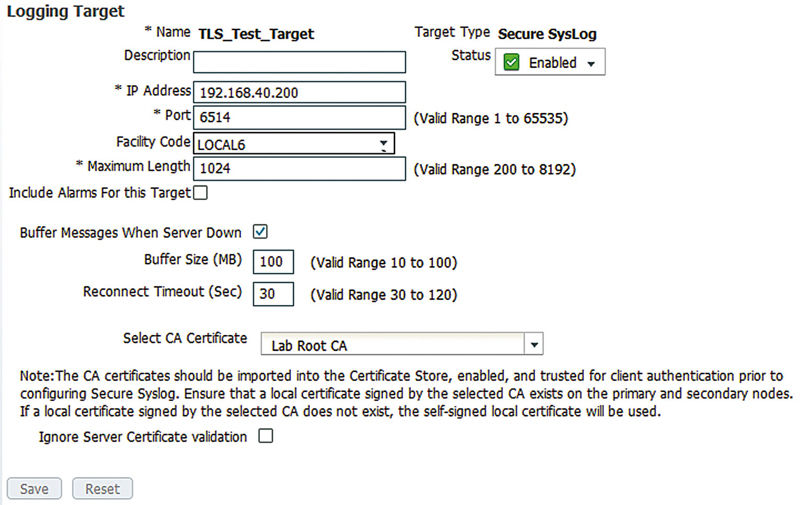
Setup wise our configuration here is going to look similar to the TCP target because that’s what the secure target is based on, just with TLS added into the mix. We’ve got a different port setup here, similar to how you have TCP/80 for HTTP and TCP/443 for HTTPS, and we’ve selected the CA certificate that we imported previously as the certificate that will be used to verify the remote server. Like TCP we’re also going to enable the message buffering so we don’t lose anything should the syslog server go down for a short period of time.
After you have set up your remote targets you need to actually tell ISE what messages to send to the targets, which is done under the Logging Categories section. Select one of the categories, click the Edit button, and then move your configured target(s) to the right-hand column.
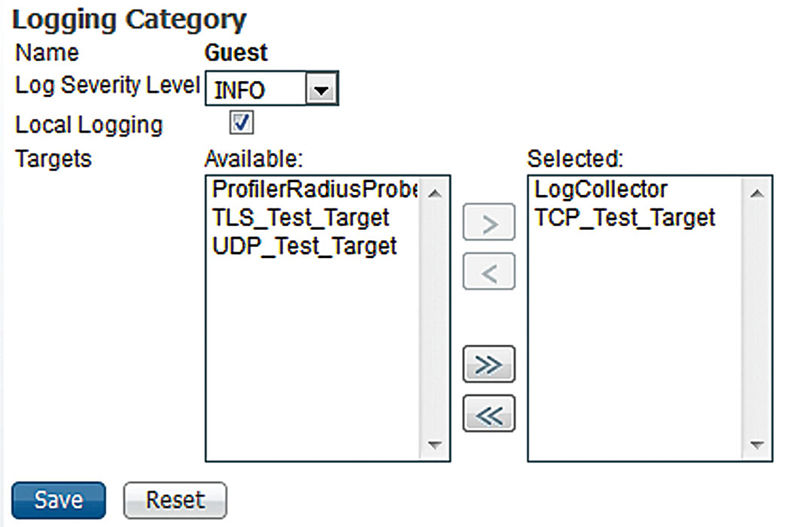
You can see we have started to send events from the Guest category to our syslog server using the TCP target we configured.
That’s the basic setup for sending events to remote servers. Remember that less can be more here; you probably shouldn’t go into each category and send it to your remote server unless you (a) really need it or (b) like to waste resources. Figure out what your remote servers need/support and send only what’s needed; ISE and your remote targets will thank you for it!
Identity Firewall with Context Directory Agent
The Context Directory Agent (CDA) is an appliance that takes information from supported sources and uses that information to map IP addresses to usernames so that usernames can be used by consuming devices (e.g., ASAs, Web Security Appliances (WSAs)) to make policy decisions. For example, using usernames on an ASA could let you limit access to a financial application to only users in a specific AD group without them needing to be in a separate VLAN. Most times CDA is configured to pull login events from AD and depending on your users that might be enough. However, there are some downsides to this, the main one being lag time for users moving between wired and wireless connections. A user moving from their desk (wired) to a conference room (wireless) won’t generate any events that CDA can use to map the new wireless IP to the user. The result is that unless the user has access to a fallback web-UI to generate a login event (either on the device or something centralized) there will be a period of time the user won’t have access to the resources they should. Both of the two outcomes here are undesirable: either users have to go through an extra step or they can’t do their job until a login event is generated.
With ISE though we have the advantage that as a user moves around the network we can almost immediately glean the IP of the user and then pass that information on to the CDA, ensuring that users always have access to their resources.
The process to set up ISE/CDA integration is pretty straightforward. The first thing we’ll want to do is configure CDA to receive events from PSNs.
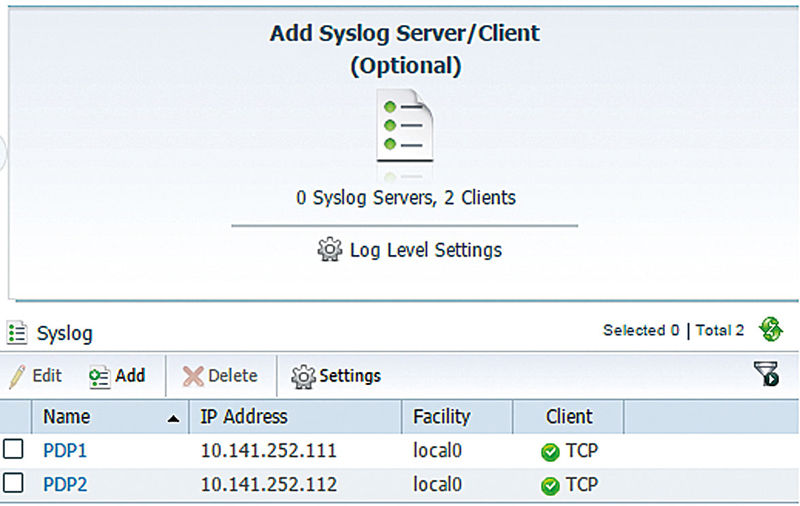
This shows part of the dashboard from a CDA appliance that already has two ISE policy nodes configured as syslog clients. These clients are using TCP to maintain packet order for some larger syslog messages but you have the option to use UDP or TLS-secured TCP as well.
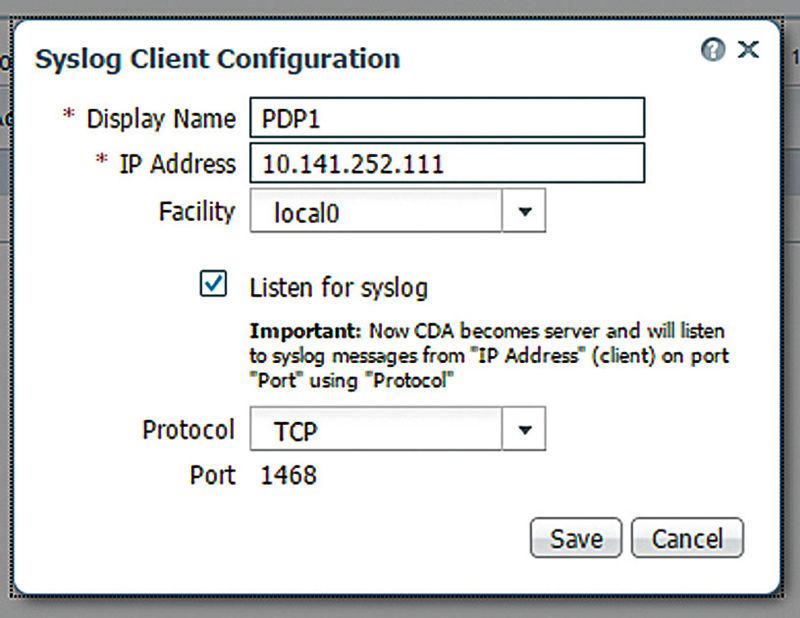
The key part to configuring these clients is checking off the “Listen for syslog” for each one. This tells CDA to listen for events instead of sending mapping events/updates to the IP address you define.
Once you have CDA configured to get syslogs, it’s time to configure ISE to send them. First, you need to define the CDA appliance as a remote log target similar to how we went over previously. Once you do that, you want to add that new target into three ISE logging categories: AAA Audit, Passed Authentications, and RADIUS Accounting. Save your changes and go back to the CDA appliance and look at the Live Log and you should start to see events coming in that indicate mappings are being created/updated from RADIUS information.
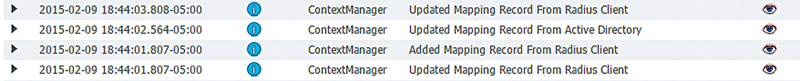
Here we see CDA adding/updating mappings from ISE as well as a traditional AD integration. Both can be configured side by side and work together.
If you see warning events about messages being in the wrong format, be sure that both ISE and CDA have NTP properly configured and that you are using message sizes large enough to accommodate the information CDA needs to perform mappings. Clicking on the “eye” will give you more information about those warnings. In a distributed deployment you may also see warnings about messages from unknown servers. This is normal and it’s likely from not having the Admin/monitor nodes defined as syslog clients. The messages they are sending aren’t critical to identity mapping so they are safe to leave off but if you want to get rid of the errors feel free to define them.
Set Up a Remote Syslog Server
The term SIEM has been thrown around a couple of times in this chapter but we understand that not everyone will have the funds to purchase one. Luckily with a couple of open-source packages you can put together a fairly easy-to-use and flexible log management system for ISE as well as other devices on your network. We’ll be making use of rsyslog, elasticsearch, and kibana to create our log system; rsyslog will be receiving the syslog data, formatting it, and then sending it to elasticsearch where it will be stored and indexed for our searching needs. Finally kibana will give us a nice web-UI where we can search the log data.
Required packages are as follows:
• Rsyslog (tested with 8.6.0)
• Elasticsearch (tested with 1.4.4)
• Kibana (tested with 4.0.0)
Depending on your preferred distribution how you go about getting these packages will differ but the configurations should still be the same. There are some minor changes that could be made to this setup; the use of Logstash with elasticsearch is very common but in terms of ease of setup rsyslog is both easier to configure and possibly even already installed depending on your chosen distribution. If you are planning on creating a truly universal logging system, then Logstash might be a better option but for our purposes rsyslog provides a lot of flexibility with the ease of use we need to get started quickly.
Configuring Rsyslog
The first thing we’ll want to do is configure rsyslog to listen for events from remote servers as well as configure the output of those events to our elasticsearch instance. Listening for remote events is a simple two-line affair in /etc/rsyslog.conf:
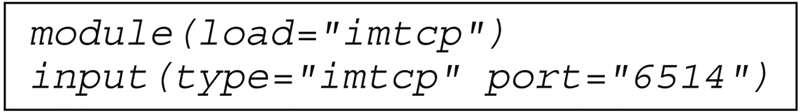
This tells rsyslog to load the module needed to listen on TCP ports and then creates a listener on port 6514. If you want to use UDP instead, change “tcp” to “udp” in the lines above.
Next we have to tell rsyslog to output our logs to elasticsearch but since elasticsearch is expecting a structure format we need to create that format and use it, else our logs won’t get parsed correctly/at all. Place the following into “/etc/rsyslog.d/55-elasticsearch.conf”:
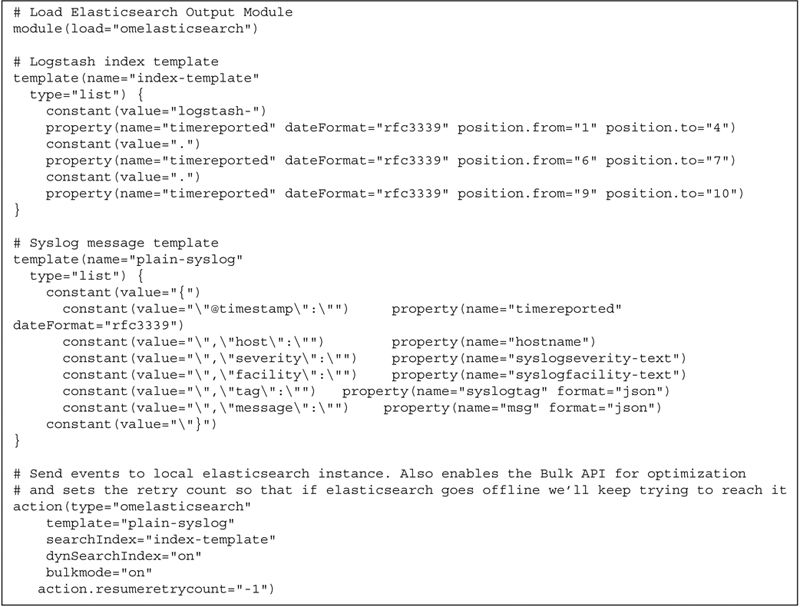
That should cover the basics for rsyslog; at this point (re)starting the daemon will give you a working syslog server listening on a TCP port of your choice and sending all events to the elasticsearch instance we’ll set up next.
Configuring Elasticsearch
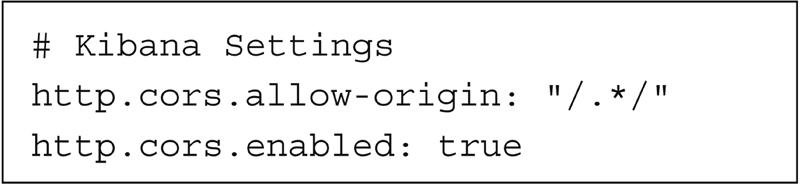
Now we need to set up elasticsearch, which luckily for us is fairly simple. The default configuration provided works well enough for us in this example; just copy the example files that come with the package into /etc/elasticsearch/. The only change we’ll need to make is an addition in “elasticsearch.yml” to support kibana, which is our next step:
Configuring Kibana
The newest version of kibana simplifies our start-up a little bit since we no longer need to worry about the web server part. After installation you just need to start the application, probably with your distribution choice of init script/systemd. Assuming you haven’t made any changes to the default elasticsearch configuration other than the ones we specified the default kibana settings will give you a log interface located at http://<serverFQDN>:5601.
The first time you access the UI you will need to select the format the indices are in so that they can be read correctly. We’re replicating the naming scheme used by Logstash which means the configuration is easy. Check off both “Index contains time-based events” and “Use event times to create index names” while making sure that the “Index pattern interval” is set to Daily. Finally select the “@timestamp” as our time-field and click “Create” to finish the Index Pattern.
From here clicking the “Discover” tab will show you a nicely visualized and indexed system to search your ISE (or any other syslog source with the configuration we have here) logs with. In the upper left-hand corner you can click and select the time range you want to look in and if you want a refresh interval at all. The search bar at the top of the dashboard uses LUCENE query syntax and includes some contextual help, but here are some examples to get you started (use quotation marks if indicated):
• All events for the user “jdoe”: “jdoe”
• All passed events for user “jdoe”: “tag:CISE_Passed_Authentications AND jdoe”
• All profiling events: “tag: CISE_Profiler”