Chapter 17
ISE CLI
Abstract
This chapter is the final one and it covers basics of the command-line interface (CLI), of ISE for both day-to-day work and troubleshooting needs. We start with basic use and movement through the CLI and then move into how to manipulate output to find what we’re looking for. Next we go through the more helpful commands and include tools that you will be making use of while working with ISE. Finally we finish up with a couple of examples such as creating another CLI admin as well as gathering support information for TAC.
Keywords
CLI
ADE-OS
troubleshooting
TAC
support
Introduction
The large majority of your time with ISE will be spent in the GUI and obviously most of this book is dedicated to just that. However, the command-line interface (CLI) has its place and in fact if you stand up a new ISE environment (or if you did your current one) you will see that your first basic setup is CLI based.
ADE-OS—what is it?
If you have used almost any prebuilt VM or installed medium from Cisco lately, you will probably notice that they all feel similar. There is good reason for this; all of them are built off of Cisco’s Application Deployment Engine (ADE) OS which itself is built of Red Hat Enterprise Linux 6, 64-bit in its current iteration. Along with that comes a custom shell used when remote users log in that makes the system feel/act very much like IOS. This shell, named CARS (Cisco Application Restricted Shell —Cisco ADE Restricted Shell, who knows), limits what you can and cannot do to provide a little protection to the OS under it while still allowing you to do things you should without TAC support. If needed, you can obtain root access with the help of TAC but we’ll cover that later on.
Anyone coming from IOS should feel right at home even though this is Linux and anyone else familiar with a Linux or Windows CLI should feel comfortable soon enough. The first thing you should do is type in “?” and as soon as you do you will be presented with a list similar to this.
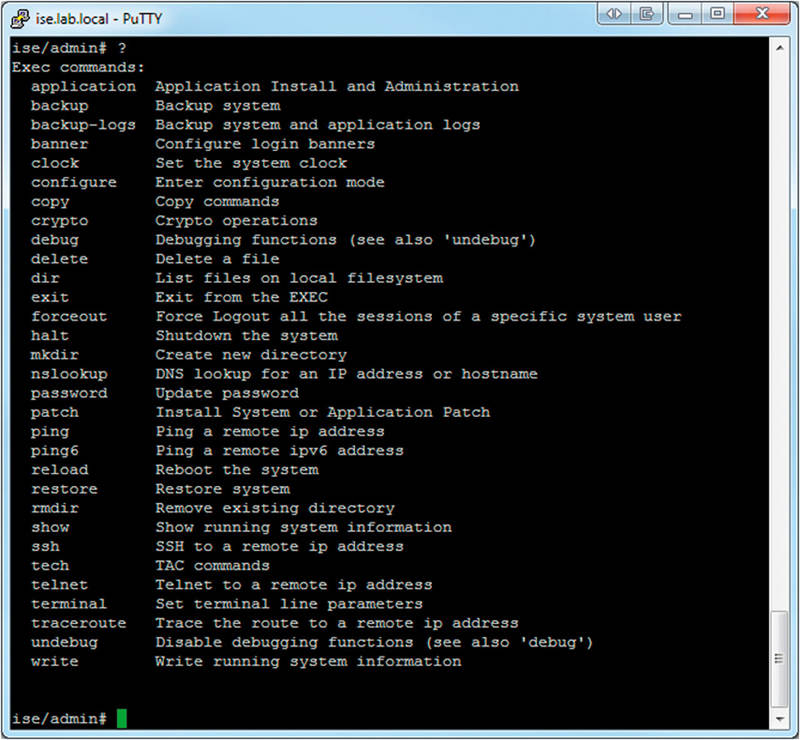
Remember that “?” trick, since like IOS, it can be used after any command you type in to get more information about what else you can do or what you need to put after the command.
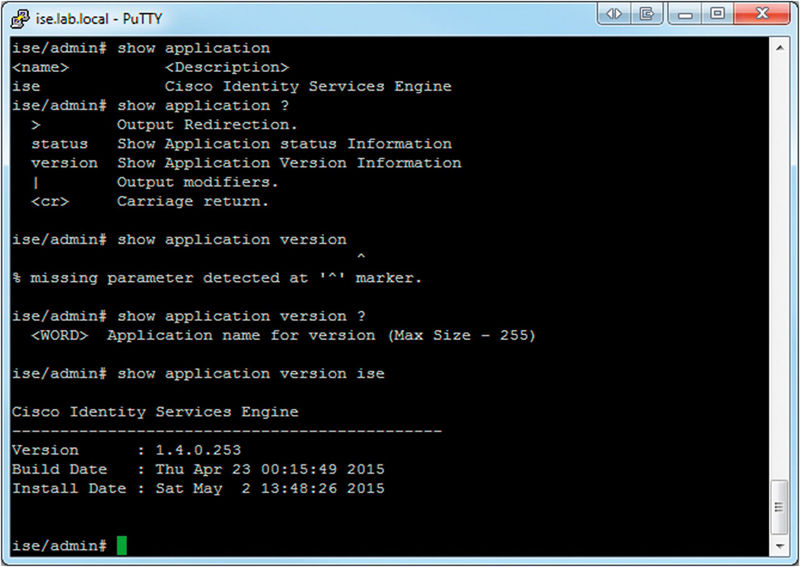
Also notice that the CLI will tell you if you are missing something and where your error starts. We first did a “show application” to see what the name of the application running on the VM was and obviously it was “ise.”1 Next we typed “?” to see if there was anything else we could look at and for the sake of argument here we were interested in the version. Unfortunately we typed the command wrong (on purpose) but we’re told where we went wrong; something needs to be put after “version.” “?” reveals that the CLI is expecting an application name to be put in (since you could technically have multiple applications installed) and then after putting that in we can see the version information for ISE running on this VM.
Manipulating output
A key skill/tool to know about when working with the CLI is that nearly any output from any command can be manipulated in some way. These manipulations are accessed at the end of a command by typing the pipe character and then continuing the command by adding the manipulation and any needed commands to that. It’s a little hard to describe but let’s take a look at an example.
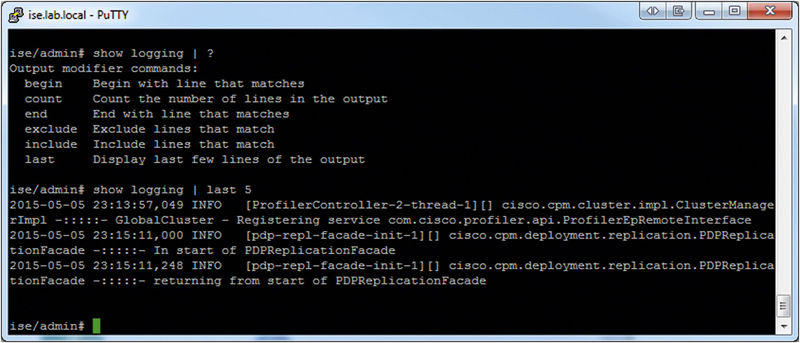
We can see the first thing we ran was “show logging | ?” and that the “?” did the same thing as with a normal command; it told us what other options we had available for use. There are six commands we can use to change the resulting output and they are all fairly self-explanatory but what are sometimes you might use them?
• begin: Good when you want to start looking at logs on a specific date. Depending on your setup logs could go back a ways so being able to run something like “show logging | begin 2015-05-08” to start on May 8 could be handy if you had an issue that started around then.
• count: This one isn’t normally used by itself and is normally tracked onto the end of another modifier.
• end: Just like begin but this time we’re going to spit out anything until that pattern matches. Could be used in a similar date-fashion or you can use it in conjunction with “begin” to pull out only sections of logs to look at.
• exclude: Removes any lines that match the pattern from being shown. Handy to remove stuff you know is normal and gets in the way of finding what you really want.
• include: The one you will probably use the most, displays only the lines you want and optionally, using the “next” and/or “prev” options, the specified number of lines before/after a matching line. This means if you know you are looking for the string “restart failed on node,” you can specify the full command “show logging | include “restart failed on node” next 5 prev 5” and you will get the five lines of the log file before and after that error, possibly giving you some important information about why the error happened.
• last: The second most used command, will display the last specified number of lines from the log file. The previous image shows this; if we’re looking for stuff we know just happened, then this can save a lot of time.
Now in two places you just read that you could use something in conjunction with another command—what does that mean? It means that you can chain output modifiers together so that you can get exactly what you are looking for. Use both include and exclude to find what you need and then exclude some lines you know you don’t. Use include multiple times to narrow down the output (since at this point we don’t have access to regular expressions) and then track on count to see how many times that event took place. Manipulating output with these tools can save you a lot of time while troubleshooting any problems you may have.
Show commands
Running through all the possible “show” commands is a good place to start when you are looking at the ISE CLI for the first time since running them won’t break anything; you can safely get a feel for things without worrying that ISE is going to burst into flames if you type something wrong. We won’t go through all of the commands but here are some that will come in handy while you work with ISE:
• “show application status ise”:
• This command will show you the ISE processes, their state, and their ID. If you ever have anything go wrong/act weird, here would be a good place to start. It’s normal to see processes listed as “disabled” here if you aren’t using them (pxGrid) or if you are in a distributed deployment (PAP/PSNs won’t have the MnT services running).
• “show backup history”:
• This command will give you a list of the backups that have run, the date they ran, the name of the file, and what repository it was copied to. Good to make sure your backups are running successfully.
• “show clock”:
• You can guess what this does but proper time keeping is a critical part of ISE and authentication in general. ISE and AD must be within 5 min of each other or authentications will fail. Certificate validity is based on dates/times and if they are off then valid certificates could be marked as invalid or vice versa. Keep good time!
• “show disks”:
• Disk space, one of those things you don’t think about until it’s gone. If you are running appliances or OVAs, then you should be fine here but if you customized at all then you could run into space issues. This command will not only tell you how much free space all the individual file systems have but also do a sanity check to ensure that the space is enough for ISE to operate normally.
• “show interface”:
• Linux people will recognize the output of this command right away since it’s just redirected from “ifconfig.” Here you can see the address assigned to each interface, its status and RX/TX packet counts, errors, dropped, etc. Can be useful when troubleshooting any network issues.
• “show ip route”:
• Displays the machine’s routing table, another handy command for troubleshooting network issues.
• “show ntp”:
• Remember how we said time was important? This command will give you detailed info about your configured time servers, if you are synchronized, with which server, etc. If you are getting login/AD errors, then check this.
• “show running-config”/“show startup-config”:
• Network folks will recognize these; they show the current configuration and the saved configuration (used at boot up) of the ISE appliance. While not nearly as important as in the IOS/NX-OS worlds, this command will still show you the interface configurations, locally configured repositories, time zone, and some service info.
• “show tech-support”:
• A favorite for anyone troubleshooting, this command is more of a metacommand and runs a bunch of other commands to simplify collecting data needed for a TAC case. You probably don’t want to just run it by itself but rather as “show tech-support file 〈filename〉” which will dump the output into the local disk where you can then grab it.
• “show udi”:
• Handy for licensing your ISE appliance(s) or troubleshooting why a license won’t install (verifying the UDI).
• “show version”:
• A quick listing of version information for both the appliance level software and the running ISE package.
Now that’s a large list but some commands are still not listed here. Their exclusion doesn’t mean you won’t use them, just that for most troubleshooting or day-to-day operations we haven’t seen them used that often.
Logging
There is one command above you might notice isn’t there and that’s “show logging.” Why isn’t it there? Well, basically because it deserves its own section. Of all the “show” commands the logging one probably has the most depth and possibility for confusion.
First, we’ll want to take a look at the base command. Running just “show logging” by itself will output information from the ADE-OS platform logs and ISE application log; the first will show you output from some system stuff such as the hourly cron jobs running, some Oracle DB output, Secure Shell (SSH) logins, etc., while the second will show you more ISE-specific logs about Tomcat, more Oracle output, patch output, ISE heartbeat node info and a whole bunch more. Here’s the catch though: most of that information will not be useful to you at all. There is some info in there that can be helpful but the nonspecificity of it and the sheer amount of information (a PAP in a 6-node distributed deployment with ∼4000 clients has >1.1 million lines from that output, a test month-old stand-alone node with 3 clients has ∼250,000) make it impractical to sift through unless you know what you are looking for.
A better option is to look at the subcommands of the command and start targeting your searches a little bit.
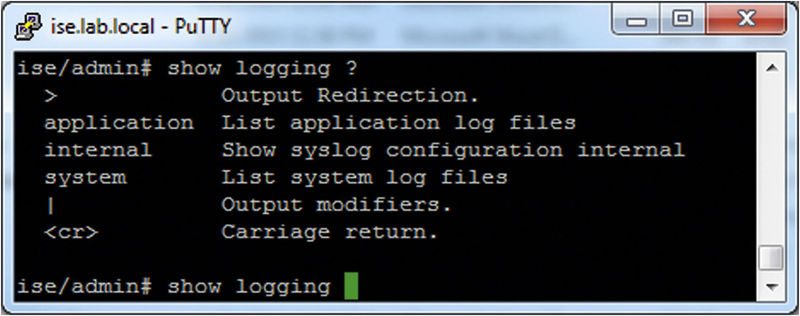
This shows what we have for options. “internal” won’t be very helpful for us; it just shows you what the system log server is and if logging is enabled or not. Instead we’ll want to concentrate on looking what “application” and “system” have to offer. Running each one of those commands will result in a list of log files you can look at being shown to you.
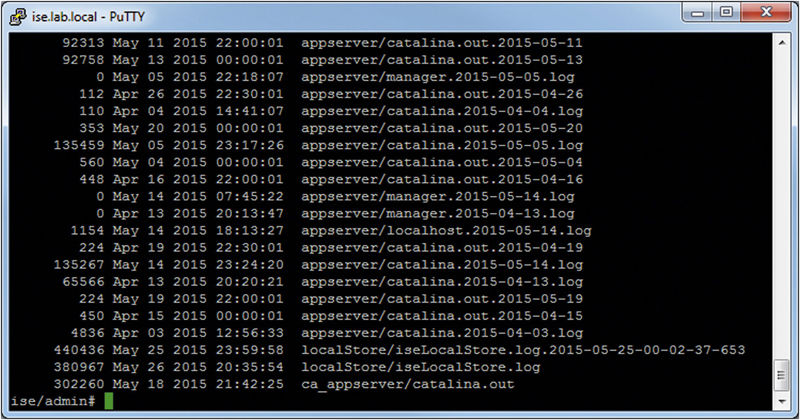
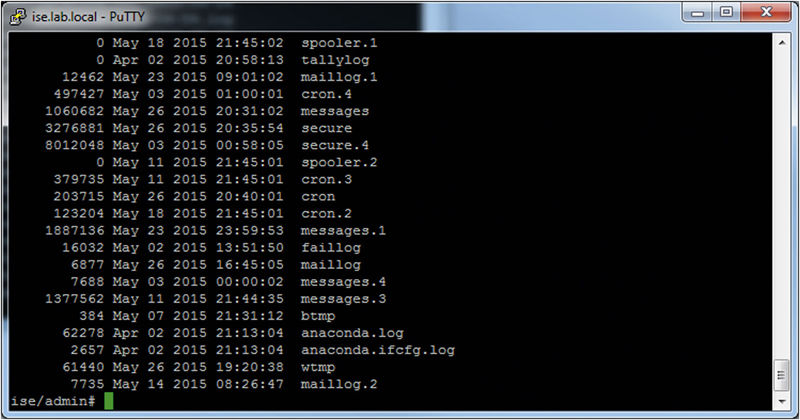
The top image shows us the output of the “show logging application” command while the bottom one shows us the output of “show logging system”; *nix folks will love the latter since those file names are instantly familiar. In both cases you will want to put the full name of the file, including the preceding directory if there is one, at the end of the command you ran to get the list. For the application listing, if we wanted to see what was in the catalina.out file for the internal CA server, we would run the command “show logging application ca_appserver/catalina.out” and then similarly on the system side if we wanted to see what was in the messages file we would run “show logging system messages.” Don’t forget those output manipulation commands; you can throw them at the end of these commands too and find exactly what you are looking for.
Changing time zones
This topic comes up sometimes postinstallation and you wouldn’t think it would be a big issue but it is, or rather it can be. If you need to change the time zone, do it before any configurations have been made and it’s recommended to start fresh with the correct time zone if it’s reasonable. Previous versions of ISE would perform a factory reset when moving between time zones but the latest versions are a little bit more forgiving but if you have made any major configurations it’s highly recommended that you take a backup before executing the change.
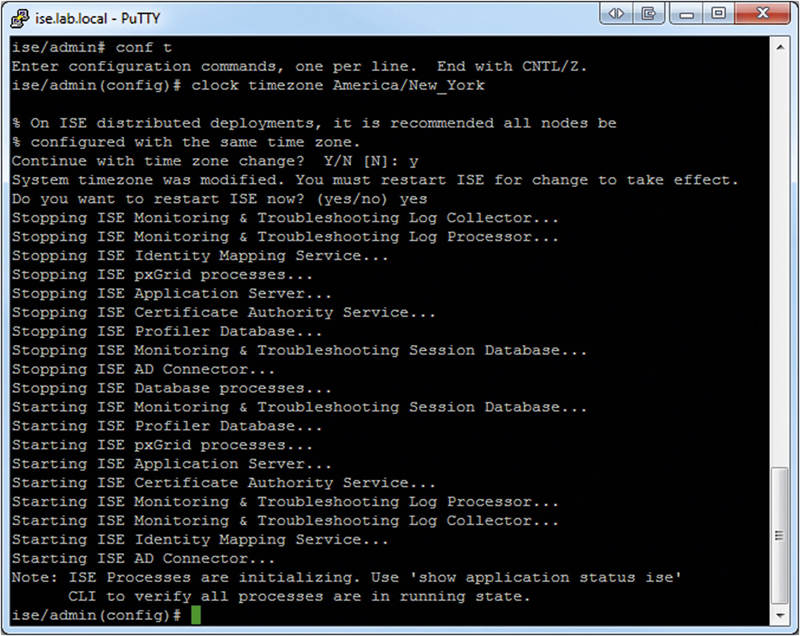
The change itself is simple; first run “show timezones” and select your find new preferred zone. It’s recommended that instead of selecting an exact zone (unless you are going to use Coordinated Universal Time (UTC)) you choose a zone named after a city in the time zone you are in, so instead of “EST” we would pick “America/New_York.” This ensures that daylight savings time and any future changes happen automatically. Once you have your time zone, go into configure mode and enter “clock timezone 〈new zone〉.” ISE will warn you that if you are in a distributed deployment, all nodes should be in the same time zone and then ask you if you want to continue. Once you agree, you will be prompted to restart the ISE services to apply the change.
Application commands
Chances are that if you are in the CLI, you are going to be looking at the “application” commands. Commands here are related to the configuration, upgrading, and general functioning of ISE.
The first application command you might use is “application configure ise”.
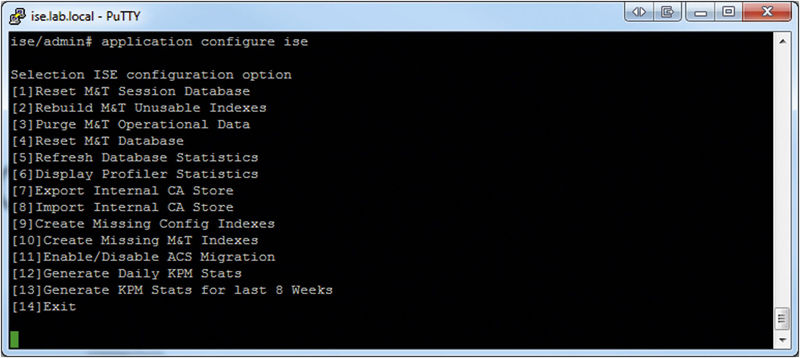
Now, most of these commands should be run only with the assistance/direction of TAC but some of them you will use on your own depending on the features you use. For example, the import/export of the internal CA store is required if you are running a redundant PAP node with an internal CA. Any of the commands to generate statistics won’t hurt but they also shouldn’t be needed during normal operation as they will be taken care of automatically by ISE.
The “application install/upgrade/remove” commands are all very similar in their execution and their use is fairly straightforward. The slight gotcha is that while the “upgrade” subcommand is used to upgrade ISE it’s only used for moving between major versions such as 1.3 → 1.4 or if Cisco releases any Maintenance Release (MR) versions (1.2.1 was technically a major release even though the version numbering makes it look like a minor one). The only use for the “install/remove” subcommands we’ve found has been installing the root patch provided by TAC that opens up root access to the underlying OS. If you want to reinstall/reset your ISE configuration, you typically use the next command.
If you are ever stuck with a totally nonworking setup or, in a distributed environment, you want to rebuild a node or something similar, you can run “application reset-config ise” and your settings will be returned back to their defaults. You will be asked if you want to save the currently installed certificates before resetting to factory defaults too and that is highly recommended unless you know you don’t want them. If you are refreshing any distributed nodes, this saves you time configuring the node but even a stand-alone node can benefit from this. After the node is reset it is in a stand-alone state and you can join it to an existing deployment or do whatever else you need to do.
The last important application command is “application reset-passwd” which is run in the format of “application reset-passwd ise 〈admin user〉” and will let you reset the password of a web UI admin if you have forgotten the password or it has become locked. This is usually only needed if you haven’t set up AD (or another external login source) for authentication of your administrators since in that case the remote systems take care of handling locking/passwords. Like we mentioned in the Administration section, setting up external authentication is highly recommended. You can also reset/unlock accounts with other admin accounts so this is really a last resort action.
Other tools
One of the more basic but helpful commands is “nslookup.” DNS resolution is important for ISE so you can use this to check for normal A/PTR records but also for SRV records for something like AD by running “nslookup _ldap._tcp.lab.local querytype SRV.” You have multiple DNS servers configured; you can also append “name-server 〈ip〉” to the end of the “nslookup” to target specific servers so that you can pinpoint if one of them is returning incorrect information and causing random problems. The “ping” and “traceroute” commands are also useful for ensuring you can correctly connect between nodes.
This next one might be a bit confusing and it’s the “patch” command, which is used to install patch releases onto ISE. The confusing part here is that you should not use this command from the CLI unless you have very good reason to. The proper way to patch nodes is through the web UI, where you can upload the patch and ISE takes care of copying the code out to the nodes, installing the patch, and then rebooting the nodes in a sequential order so that your cluster stays in a functioning state while it’s happening. The CLI “patch” command on the other hand only applies the patch to the one node you are currently on, a nonideal situation in most cases. If you are installing a patch, you probably want it everywhere. So when will you use this command? You can use this if you have to rebuild a node from scratch and need to bring it up to the same patch level as the rest of the cluster before you join it back. You might also want to use this if you want deterministic control over which nodes get a patch applied and when. The web UI will make sure that you never have all of your PSNs down at the same time but if you are a global company you will probably want to make sure that your PSNs are offline during maintenance windows for specific time zones. In that case you will need to manually install patches.
Telnet is provided by the CLI as well and while normally you should stay away from anything cleartext for running commands “telnet” here will actually give us a simple way to check (some) connectivity between nodes or even to other services such as AD. This image shows us some results.
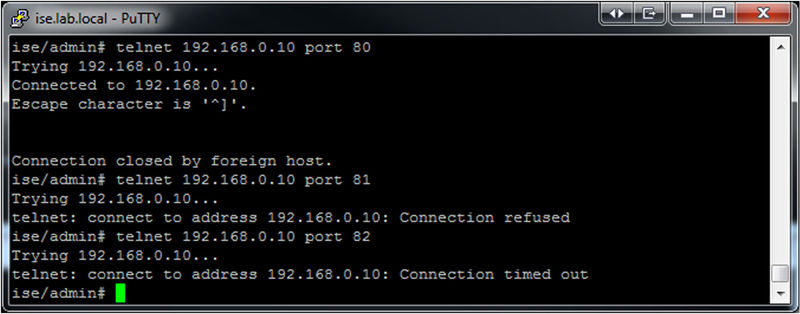
You can see we are running the commands “telnet 〈host〉 port 〈port〉” in order to do this. In the first attempt we connect to port 80 which has an Apache web server listening and we can see that telnet connected and basically waited for us. Depending on the remote port you are testing it may act different but what’s important here is the fact it did connect, which means we have established from our ISE node to the remote node/server the path is clear. The next two connections show the other possible (common) outcomes when testing ports with telnet. In both cases the ports can’t connect so we know something is wrong; in the first case there is nothing listening on the port used. If you were running this test against another ISE node, you might get that error if the ISE services hadn’t started yet. In the second attempt we used iptables to replicate what you would see with a host behind a firewall/ACL; you will notice the connection wasn’t refused but rather telnet gave up connecting after a period of time.
It’s normally not recommended but the commands under the “tech” commands can be helpful for people who have *nix experience and are familiar with top/iostat/vmstat. The nice thing about these commands is that the restricted shell just passes the output back to you without formatting/changing it so you get a more “raw” view of what’s going on. The only command here you should probably avoid is “tech dumptcp” which outputs packets from a selected interface. In reality it’s just running tcpdump but you can control only how many packets, if any, are captured before the command exits. Without any ability to filter packets you will, on anything other than a small lab deployment, be overrun with packets for clients or just normal traffic and miss what you are looking for. If there is a need to debug network communication, it’s best to work with TAC and get the root patch installed so you have direct access to tcpdump.
Examples
Getting Tech Support Info
1. Run “show tech file” or redirect it depending on how you want to deal with the file.
2. Create repository in the web UI.
3. Copy file off.
At some point during your use of ISE you are probably going to have to open a TAC case; it’s just a fact of life. As we discussed before the “show tech” command runs a bunch of other commands and gathers information for the TAC engineer to do further root cause analysis to try and determine what’s wrong. If you are a first-time user, it can still seem like a daunting process especially if the pressure of a nonworking ISE install is on you so let’s go through the steps right here. It might also be helpful to run through these before such a situation comes up so you are familiar with them.
First step is that we’ll need to create a remote repository that we can copy the resulting file to. ISE supports a number of protocols including FTP/SCP/TFTP/NFS so you can pick whichever one works best for you; in this example we’ll be using the FileZilla FTP server2 and assuming you have already downloaded and installed it.
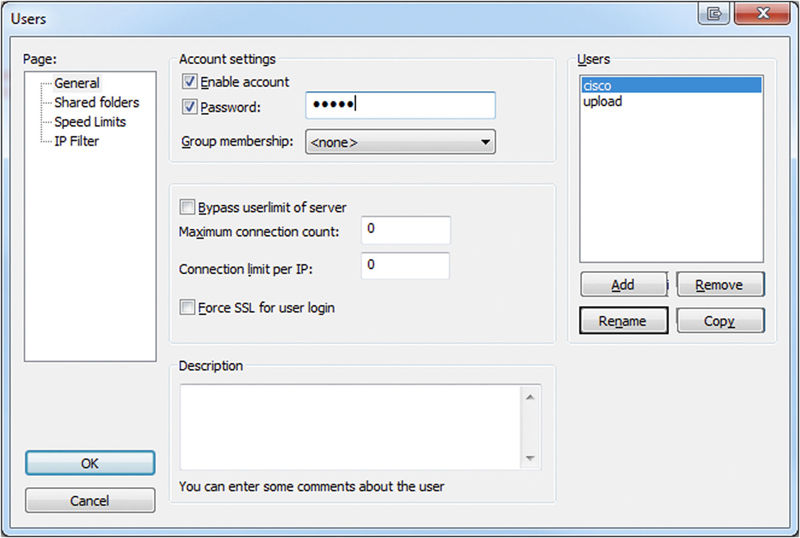
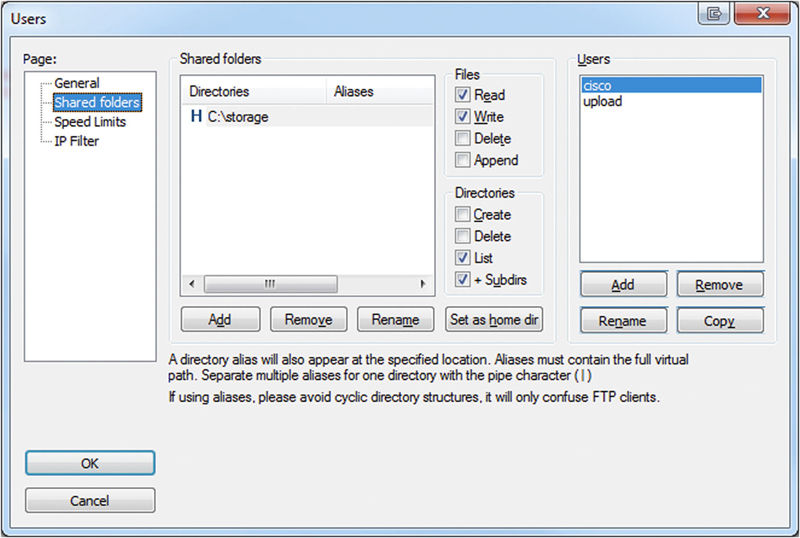
The first image shows that we created a new user called “cisco” and gave the account a password; next we added a directory “C:\storage” as a directory (and since it’s the only one it will be the users’ home directory things go into by default) and gave the user write access by checking off the “Write” box.
We’re ready to run the “show tech” command at this point. There are two different ways to run this and each one will depend on how you want to deal with the file:
• “show tech file output.txt”: This will result in a file being created in the default disk:/ location called “output.txt.tar.gz.” Use this if you just want to get the file to TAC.
• “show tech > output.txt”: This will also create a file in the disk:/ location but it will just be called “output.txt,” no compression involved so it’s a bit easier to jump into if you want to debug yourself.
The first option results in a file that’s about 118 kB, and the second option gives you a file that’s about 1.7 MB—neither of them break the bank these days but the choice is yours.
After you have run whichever version of “show tech” works for you, it’s time to copy it off. You will need to know the URL format of the protocol you chose to use; most of the time it’s just “〈protocol〉://,” so in the case of our FTP server the URL is “ftp:// 〈ip address〉/.”
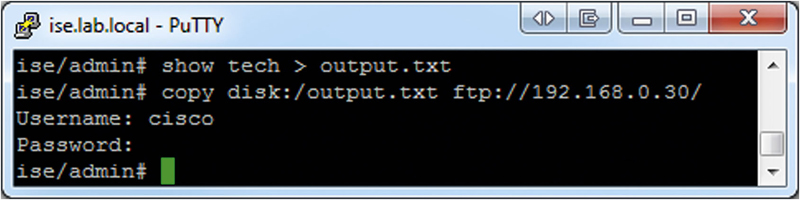
Finally we can see here that after running the command to send the “show tech” output to “output.txt” we were able to copy the file to our FTP server. From here we can do what we need to with it.
Create Another Admin
Sometimes you want to have more than one CLI user, either for auditing purposes or if you want to give someone read-only access. There are two CLI user roles that ISE comes with—admin and user; the admin role gives the user full control while the user role gives them read-only access. Adding a user is fairly straightforward.
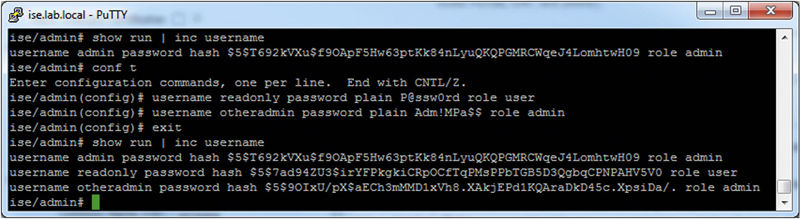
Here we’ve demonstrated adding two different accounts, one that is a full admin and another for read-only access. The general format when you add these accounts will be “username 〈username〉 password plain 〈password〉 role 〈admin|user〉.” You can also add email addresses for each user if you want or disable existing accounts by appending “disabled” to the end of the username command.
As you can see, while not as in-depth as the web UI sections, ISE still has plenty of important things to offer via the CLI and you should make use of them when possible. Don’t be afraid of the CLI!