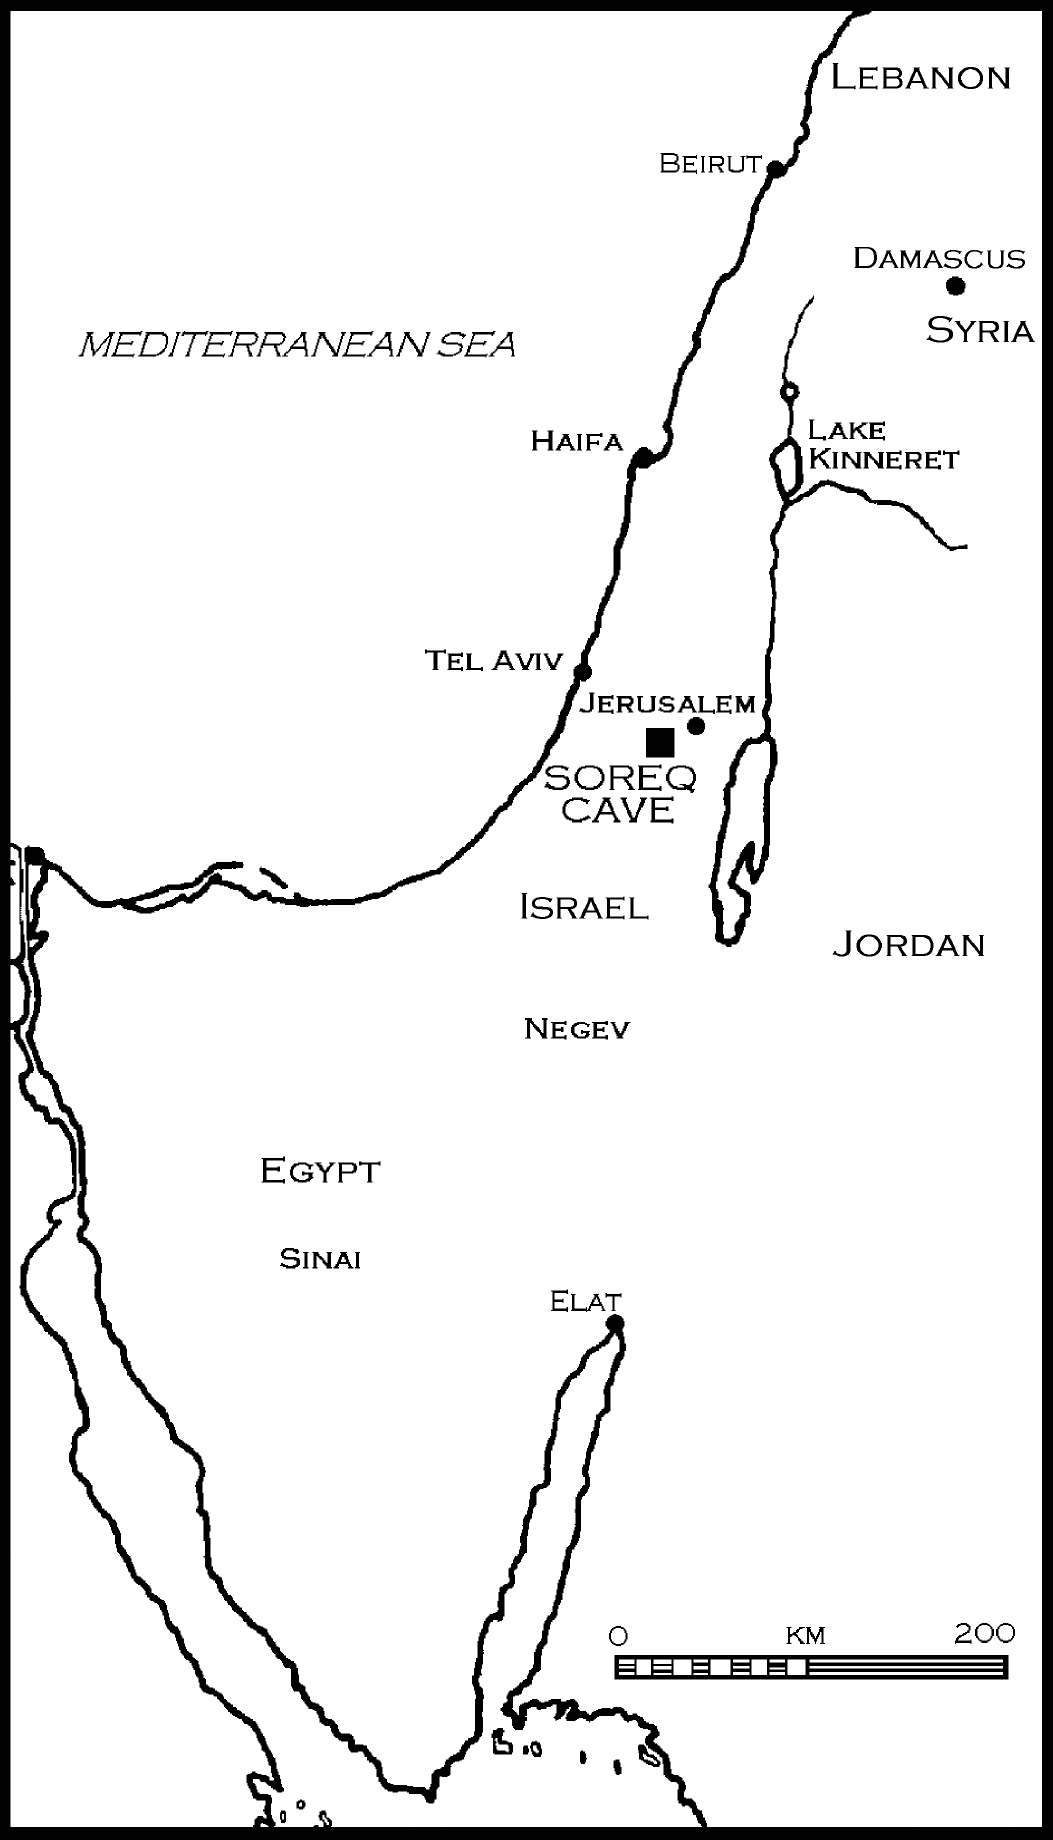
Fig. 2.1 Location map of Soreq Cave. The cave is located approximately 40 km inland east of the Mediterranean Sea, 20 km southwest of Jerusalem and 400 m above sea level.
The time interval from 60 to 10 ky defines the last cold stage (Martinson et al. 1987) when Earth experienced a wide spectrum of environmental conditions, i.e., episodes of warm and cold periods (interglacial-glacial) as well as a number of short-lived climatic oscillations (‘stadials’ and ’interstadials’). The information on climatic conditions is gained from: detailed cores from the Greenland and Antarctic ice sheets; deep sea sediments; lake sediments; pollen and studies of cave deposits (speleothems) (e.g., Shackleton 1969; Gascoyne 1983; Imbrie et al. 1984; Barnola et al. 1987; Heinrich 1988; Bond et al. 1992; Dansgaard et al. 1993; Jouzel et al. 1993; Rossignol-Strick 1995). Data from all these sources form the basis for the reconstruction of palaeoclimatic conditions.
The oxygen isotopic record from deep-sea sediments serves as a climate proxy and essentially reflects changes in temperature and global ice volume. The isotopic signal suggests that the last glacial was divided into three marine isotopic stages (Stages 4, 3 and 2). During Marine Isotopic Stage 4 and especially during Stage 2, a major increase in ice volume occurred. The marine isotopic record implies that the sea level rose from below −75 m to −50 m between Stages 4 and 3, followed by an overall sea level decrease to −120 m during Stage 2 (Shackleton 1987). Many of the more recent studies indicate a greater degree of variability (e.g. Bond et al. 1993) pointing to significant environmental changes on a much shorter time scale. These Dansgaard-Oeschger cycles are warming-cooling events with durations of 500 to 2,000 years, and episodes of ice rafting, such as the Heinrich events (Heinrich 1988).
The above time-period coincides also with the transition from the Middle to Upper Palaeolithic in the eastern Mediterranean and is roughly contemporary with the Upper Palaeolithic in the Near East. Thus, the reconstruction of climatic events becomes also the study of how environmental changes may have affected human adaptations in the region. In the Levant, the Upper Palaeolithic sequence began ca. 47–45,000 bp with the Emiran (and other transitional industries), followed by the blade/let industries of the Ahmarian Complex. Subsequently, ca. 34–27,000 bp, an intrusion of Levantine Aurignacian is documented within a limited geographical area of the central Levant. By ca. 19,000 bp, Epipalaeolithic microlithic industries appeared, e.g. the Kebaran Complex (Bar-Yosef 2000).
Stable oxygen (δ18O) and carbon (δ13C) profiles of speleothem calcite have been the most thoroughly investigated climate proxies (e.g. Hendy 1971; Thompson et al. 1974; Harmon et al. 1978; Schwarcz 1986; Gascoyne 1992). The δ18O values of speleothems depend on the isotopic composition of the water from which they were deposited and the temperature of formation. The relationships between the δ18O of the calcite, of the water from which the calcite was deposited and the temperature of formation was formulated by O’Neil and others (1969). To resolve the calcite-water fractionation equation two variables have to be determined: the past temperature and the past isotopic composition of the water. Without independent data it is impossible to differentiate between the effects of these two variables. Information on one of these variables can be gained from the isotopic composition of past waters that were trapped as fluid inclusions in the speleothems’ calcite (e.g., Harmon et al. 1979; Schwarcz and Yonge 1983; Matthews et al. 2000). However, this method is still problematic and our information on either the past water isotopic composition or on the palaeo-temperatures is usually derived from other independent proxies.
The carbon (δ13C) values reflect changes in the vegetation type in the vicinity of the cave. Relative proportions of Mediterranean-type vegetation (C3-type, trees, shrubs and some grasses) and vegetation that is typical for colder, or arid conditions (C4-type, temperate grasses) can be gained from the δ13C values of the calcite speleothems. Because these two types of vegetation have distinct photosynthetic pathways, they each have a distinct isotopic signature. Water percolating through the soil above the cave carries the information relating to the C3 and C4-type vegetation. Enrichment in the 13C of the speleothems’ calcite usually reflects an increase in the contribution of C4 plants to the soil CO2 (e.g., Cerling et al. 1991; Cerling and Quade 1993; Bar-Matthews et al. 1997a, b; Dorale et al. 1998).
One of the major advantages of speleothem studies is the ability to accurately date them using the mass-spectrometric (TIMS) 230Th-U method, which is the most reliable and precise Quaternary dating technique. 230Th-U ages are considered to be very accurate since they accord with those from dendrochronology. The 14C dating method is not a totally accurate chronometer as the atmospheric 14C/C level has changed with time (Bard et al. 1990). Between 20 and 32 ky, 14C ages are ~2.5±0.5 ky younger than the calendar ages. Between 32 and 39 ky 14C ages are younger by ~3±1 ky and at 40 ky the difference is ~4–5 ky (Schramm et al. 2000).
In this paper we present a continuous δ18O and δ13C profile of speleothems from the Soreq Cave, Israel, for the time period of 60 to 10 ky. The isotopic record will be discussed in the context of changes in temperature and rainfall amounts. The cave is located on the western flanks of the Judean Hills (Fig. 2.1) and was described by Even et al. (1986) and Bar-Matthews et al. (1991, 1997a, b). Though located in what is presently a semi-arid region (receiving about 500 mm annual rainfall), Soreq Cave is especially suited to palaeoclimatic studies. This is because the cave is located in a narrow transition zone, between a humid region to the north (where annual rainfall reaches 2,000 mm, in the Anti-Lebanon Mountains, 200 km away) and an arid region to the south (where annual rainfall drops below 100 mm, in the southern Negev Desert, 150 km away). Thus, relatively minor spatial shifts in environmental parameters can cause major climatic perturbations in the vicinity of the cave by displacing the desert boundary either northward or southward. These displacements may result from changes in temperature, rainfall rate, effective precipitation (i.e., evaporation to precipitation ratio) and storage capacity of the local (carbonate) aquifer.
Fig. 2.1 Location map of Soreq Cave. The cave is located approximately 40 km inland east of the Mediterranean Sea, 20 km southwest of Jerusalem and 400 m above sea level.
δ18O and δ13C values for ca. 1500 measurements were obtained from 20 different stalagmites and stalactites, ca. 60–250 mm in diametre, from various locations within the cave. Sample preparation and experimental procedures are described in detail by Bar-Matthews and others (1997a, b). The speleothems were sectioned perpendicularly and/or along their length, in order to expose the growth layers. Samples were obtained by drilling 0.2–0.5 mg calcite powders every 0.5–1.0 mm throughout the sectioned speleothem. Sampling in such detail was required in order to obtain an isotopic profile of sufficient resolution. The drilled powder was analyzed for δ18O and δ13C using a VG Isocarb system attached to a SIRA-II mass-spectrometer, as described in detail by Bar-Matthews and others (1997a, b). All δ18O and δ13C values were calibrated against the international standard NBS-19, and are reported in permil (‰), relative to the Vienna PeeDee Belemnite (VPDB) standard.
For the 230Th-U dating, a series of fine laminae about 1.0 cm thick were separated from each other. Age determinations were performed on 18 speleothems by means of standard alpha spectrometric measurements and by Thermal Ionization Mass Spectrometry (TIMS) following the procedure described by Bar-Matthews and others (1997a, b) and Kaufman and others (1998). None of the studied speleothems covered the entire age interval of 50 ky. In order to obtain a continuous record we compared the δ18O and δ13C profiles of several speleothems covering similar time intervals and found excellent matches, which enabled us to extend the isotopic record by matching the oldest laminae of a younger speleothem with the youngest laminae of an older speleothem.
The δ18O and δ13C values of speleothems that formed between 60–10 ky are shown in Figs. 2.2 and 2.3. In order to determine how to relate the isotopic changes to temperature and rainfall amount we used our knowledge of present-day conditions. This includes the present-day relationships between the temperature of speleothems’ deposition and their isotopic composition; the isotopic composition of rain and cave waters; the relationships between the rainfall amount and its isotopic composition and the average temperature of the vapour source, i.e., the eastern Mediterranean Sea (Bar-Matthews et al. 1996, 1997a, b, 1998, 1999, 2000a, b; Ayalon et al. 1998, 1999; Matthews et al. 2000). These studies demonstrated that lower δ18O values are associated with a relative increase in both temperature and hydrological activities in the area, whereas higher δ18O values are associated with colder temperatures and less rainfall. However, although the rainfall amount decreased, the effective precipitation increased. The effective precipitation is determined by the precipitation to evaporation ratios, causing water to be retained in the unsaturated zone during less rainy, but cooler, glacial times.
The general trends of changes in δ13C follows the δ18O trend (Fig. 2.2). Because the δ13C values are climatically controlled, any changes in the temperatures and rainfall amount affected also the vegetation cover. Lower δ13C values, usually ranging between ca. −13 and −10% , are associated with the dominance of C3-type vegetation. Higher values indicate an increased contribution of C4-type vegetation.
The δ18O record of the Soreq Cave speleothems as evident from Fig. 2.3 shows several cycles, each lasting from a few hundred to several thousand years and labelled K to A:
Cycle K lasted from ca. 57.5–56.5 ky and displays δ18O values from −4.5 to −3.2‰ .
Cycle J occurred from ca. 56.5–54.5 ky, with δ18O values of −4.4 to −3.1‰ .
Cycle I, which is relatively long, continued for about 5,000 years, from ca. 54.5–49.5 ky, and had a high δ18O amplitude, from −5.3 to −3.0‰ .
Cycle H lasted from ca. 49.5–46 ky, with δ18O values varying from −4.2 to −2.5‰ .
Cycle G, which is the longest one under consideration, had a duration of 10,000 years, from 46–36 ky, and demonstrated only minor δ18O fluctuations, ranging from −3.8 to −2.6‰ .
Cycle F was very short, lasting only about 1,000 years, from ca. 36–35 ky, but displaying a large δ18O amplitude, from −4.4 to −2.3‰ .
Cycle E was also short, lasted also about 1,000 years, from ca. 35–34 ky, and had δ18O values from −3.8 to −2.5‰
The following cycles D and C were rather long, with Cycle D lasting about 8,500 years, from 34–25.5 ky, with little δ18O variations, ranging between −3.6 to −2.7‰ . Cycle C lasted from 25.5-18.5 ky with δ18O values from −3.6 to −2.4‰ .
The shared characteristics of Cycles K, J, I, H, F and E display a trend from lower to higher δ18O and δ13C values, i.e. transitions from warmer and wetter to cooler and dryer climatic conditions. This type of oscillation is similar to the Dansgaard-Oeschger cycles. The longest and most pronounced cycles among them are I and H, each lasting about 4,000 years. The start of Cycle I ca. 54.5 ky, with very low δ18O values, represents the warmest and wettest period during the last glacial. The end of Cycle H at ca. 46 ky coincides with very high δ18O values, and was one of four short episodes of very high δ18O events, representing very dry and cold periods during the last glacial. Cycle G, with stable and high δ18O values around −3‰ , represents about 10,000 cold years. The most drastic climatic changes occurred over the shortest cycles, F and E, which are both characterized by a very short rise and then an immediate drop in δ18O and δ13C values. Cold conditions prevailed until the end of Cycle C, which ended at ca. 19 ky, the time equivalent to the last glacial maximum (LGM).
Cycle B occurred during the period of deglaciation, from 18.5–14 ky, when climatic conditions became much wetter and warmer. The δ18O values dropped sharply from −2.5 to −6‰ .
Cycle A represents a cold and dry event during the deglaciation, most probably known as the Younger Dryas (YD), which occurred between ca. 13.1–11 ky. δ18O values increased from −6 to −4‰and returned to −6‰at the end of the event. The general isotopic pattern of the last glacial is that the earlier part, until 34 ky, was warmer than the later part, from 34–19 ky.
Today, there is a strong similarity between the average eastern Mediterranean Sea Surface Temperatures (SST) during the winter months (when rainfall and the major supply of water into the Soreq Cave occur) and the temperature of speleothem deposition (ca.19°C). We assume that the same similarity existed in the past. The eastern Mediterranean SST have been determined for major episodes during the last 60 ky using various methods (Emeis et al. 1998, 2000; Kallel et al. 1997, 2000). They estimated that during the beginning of Cycle I, at ca. 54 ky, the SST was rather warm at ca. 17°C. For the Younger Dryas they estimated a temperature of 12°C, and even colder temperatures are estimated for the coldest events at 46, 36, 34 and 19 ky.
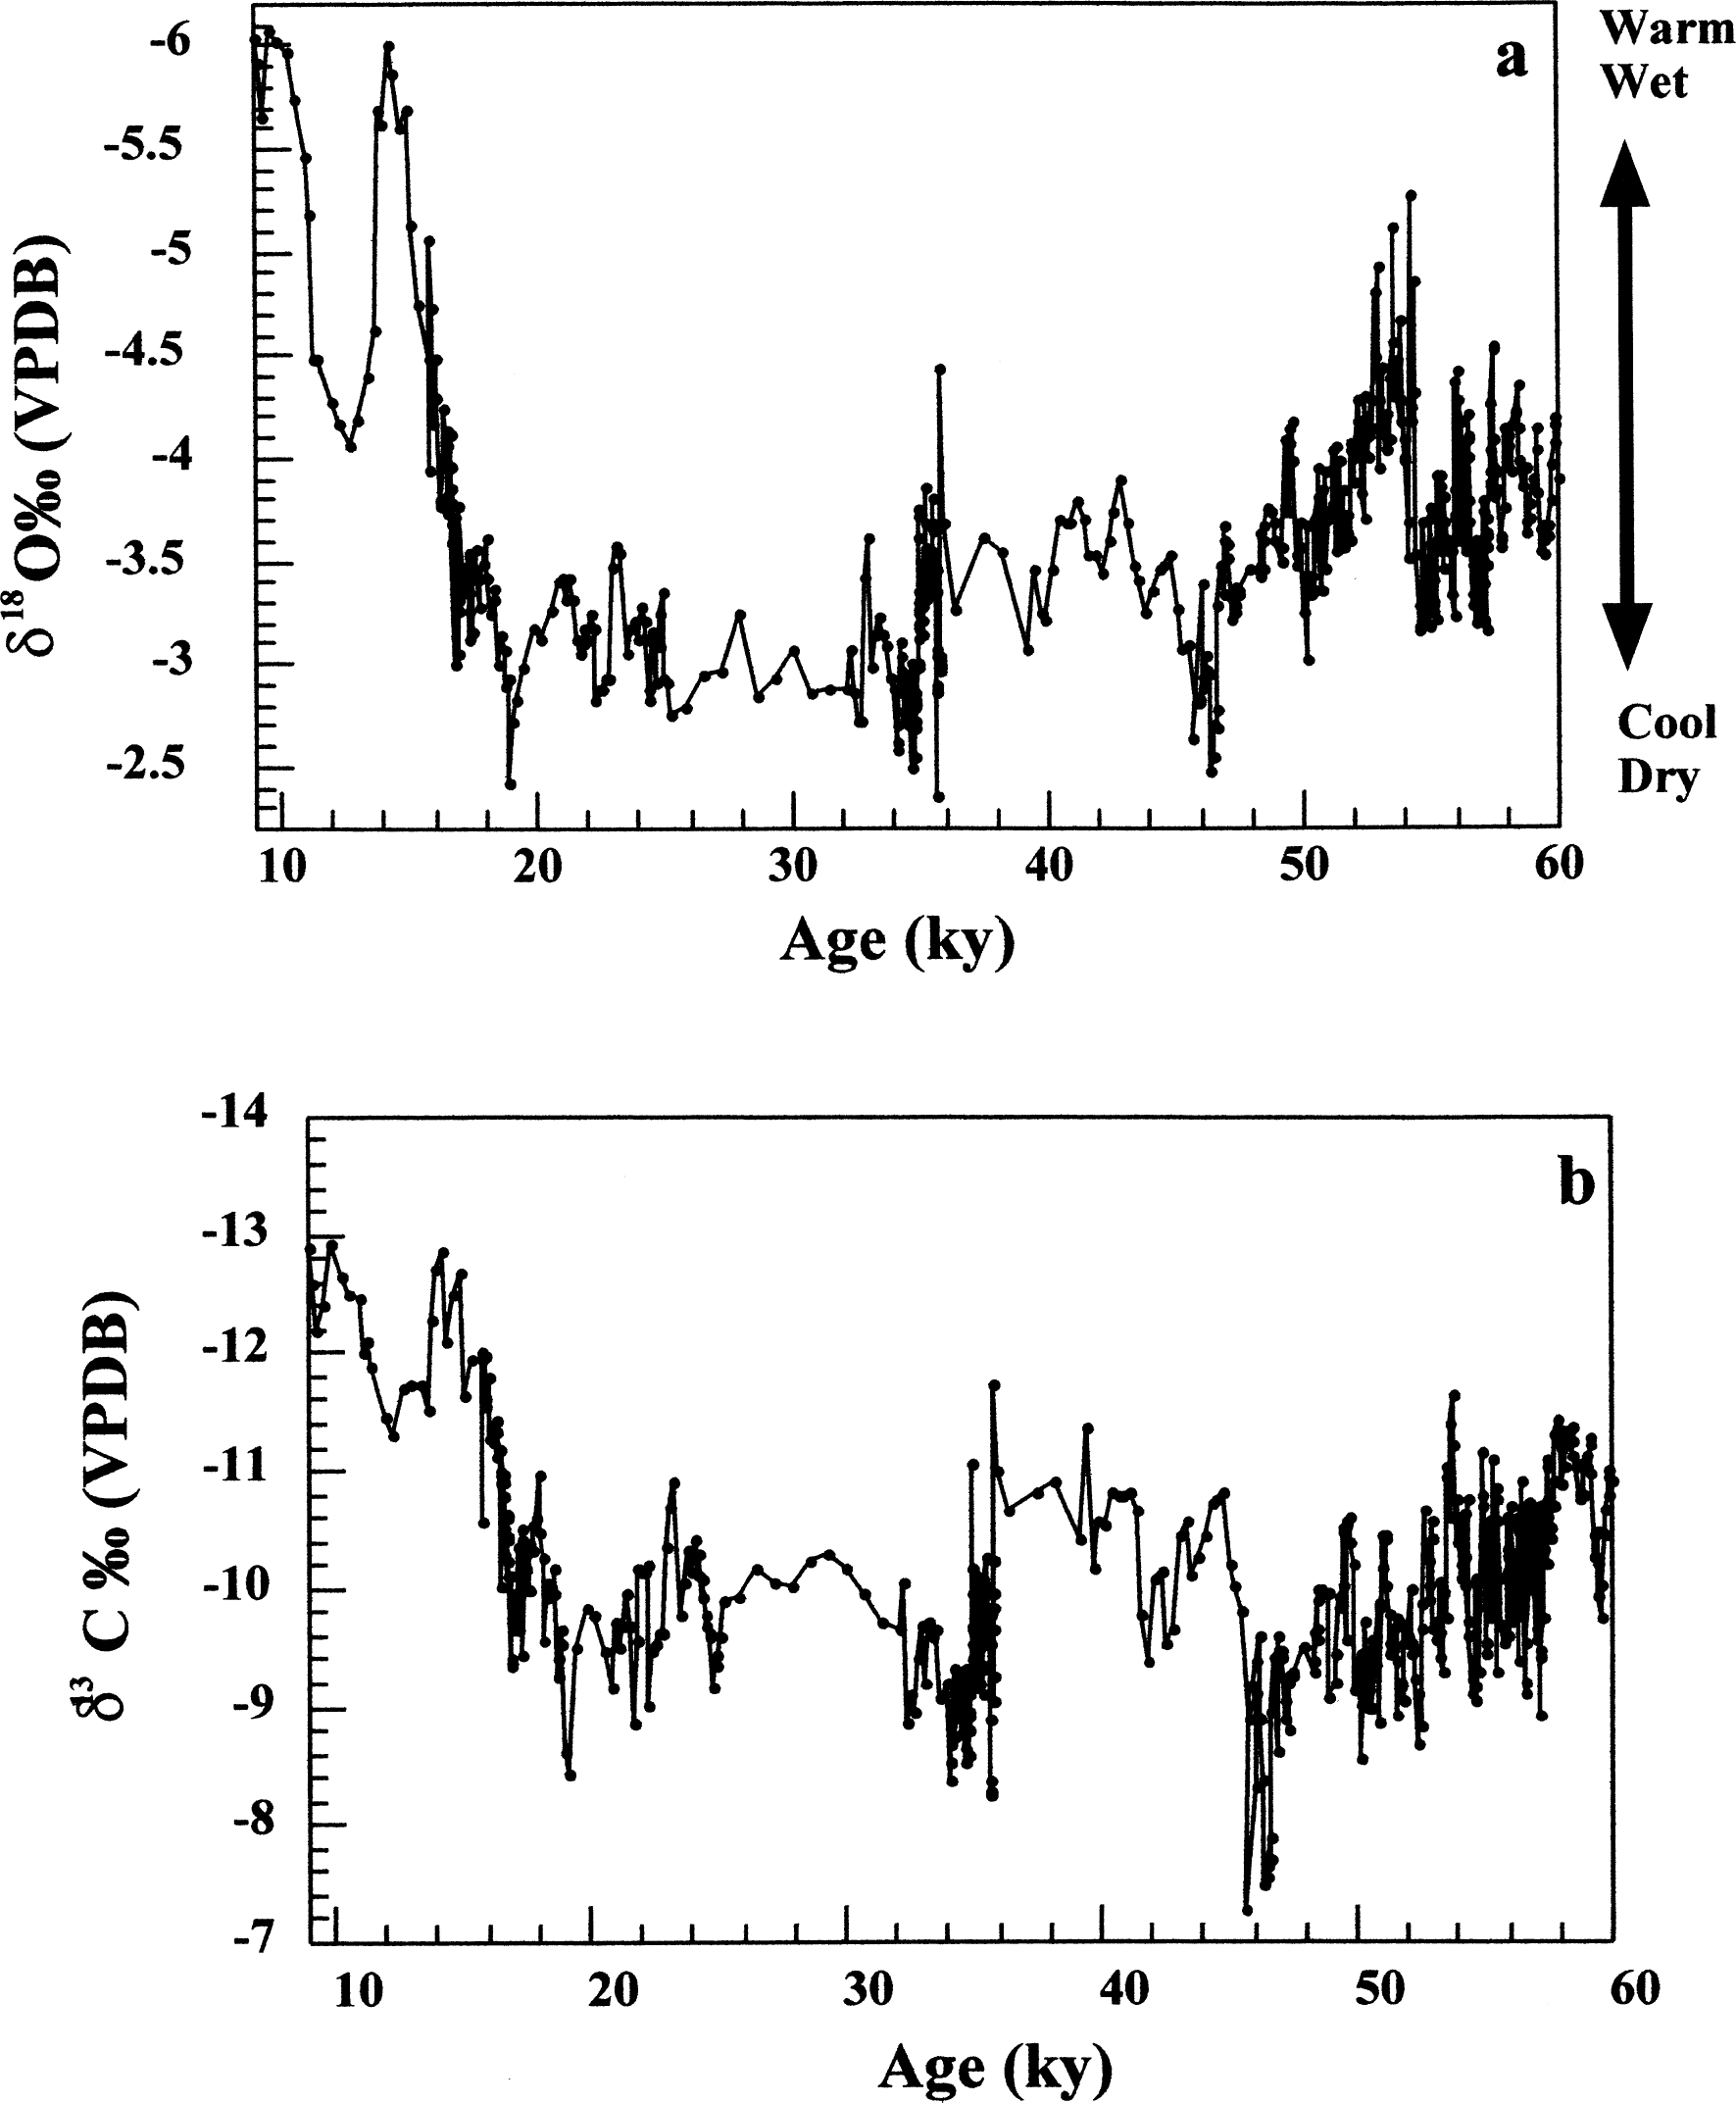
Fig. 2.2 δ18O (a) and δ13C (b) variations of the Soreq Cave speleothems back to 60 ky. On the right axis of the diagram (a) a vertical bar marks the trends towards dry-cold and wet-warm climate.
Based on these temperatures, we have calculated the isotopic composition of the water from which the speleothems were deposited using O’Neil and others (1969). From the isotopic composition of the water, we also calculated the palaeo-annual rainfall amount (Fig. 2.4). These calculations were based on the assumption that the present-day relationships between the isotopic composition of the rain – i.e., cave water – and the amount of rainfall were the same in the past. For the rainfall amount calculations we estimated the temperatures based on the general trends of the δ18O values for the time intervals for which the SST were not calculated by previous studies. The present-day relationships indicate that a change of about 1‰ in the δ18O of the rainwater is more or less equivalent to 200 mm of annual rainfall (Bar-Matthews et al. 1996, 2000b; Ayalon et al. 1998). Thus, the maximum drop of δ18O observed in the speleothems during the last glacial (Figs. 2.2–2.3), from about −5‰ to about −2.5‰, is equivalent to a ca. 50% drop in the annual amount of rainfall. During the deglaciation the decrease in δ18O of about 3‰(from about −2.5 to −6‰) is equivalent to an increase of about 300 mm (Fig. 2.4).
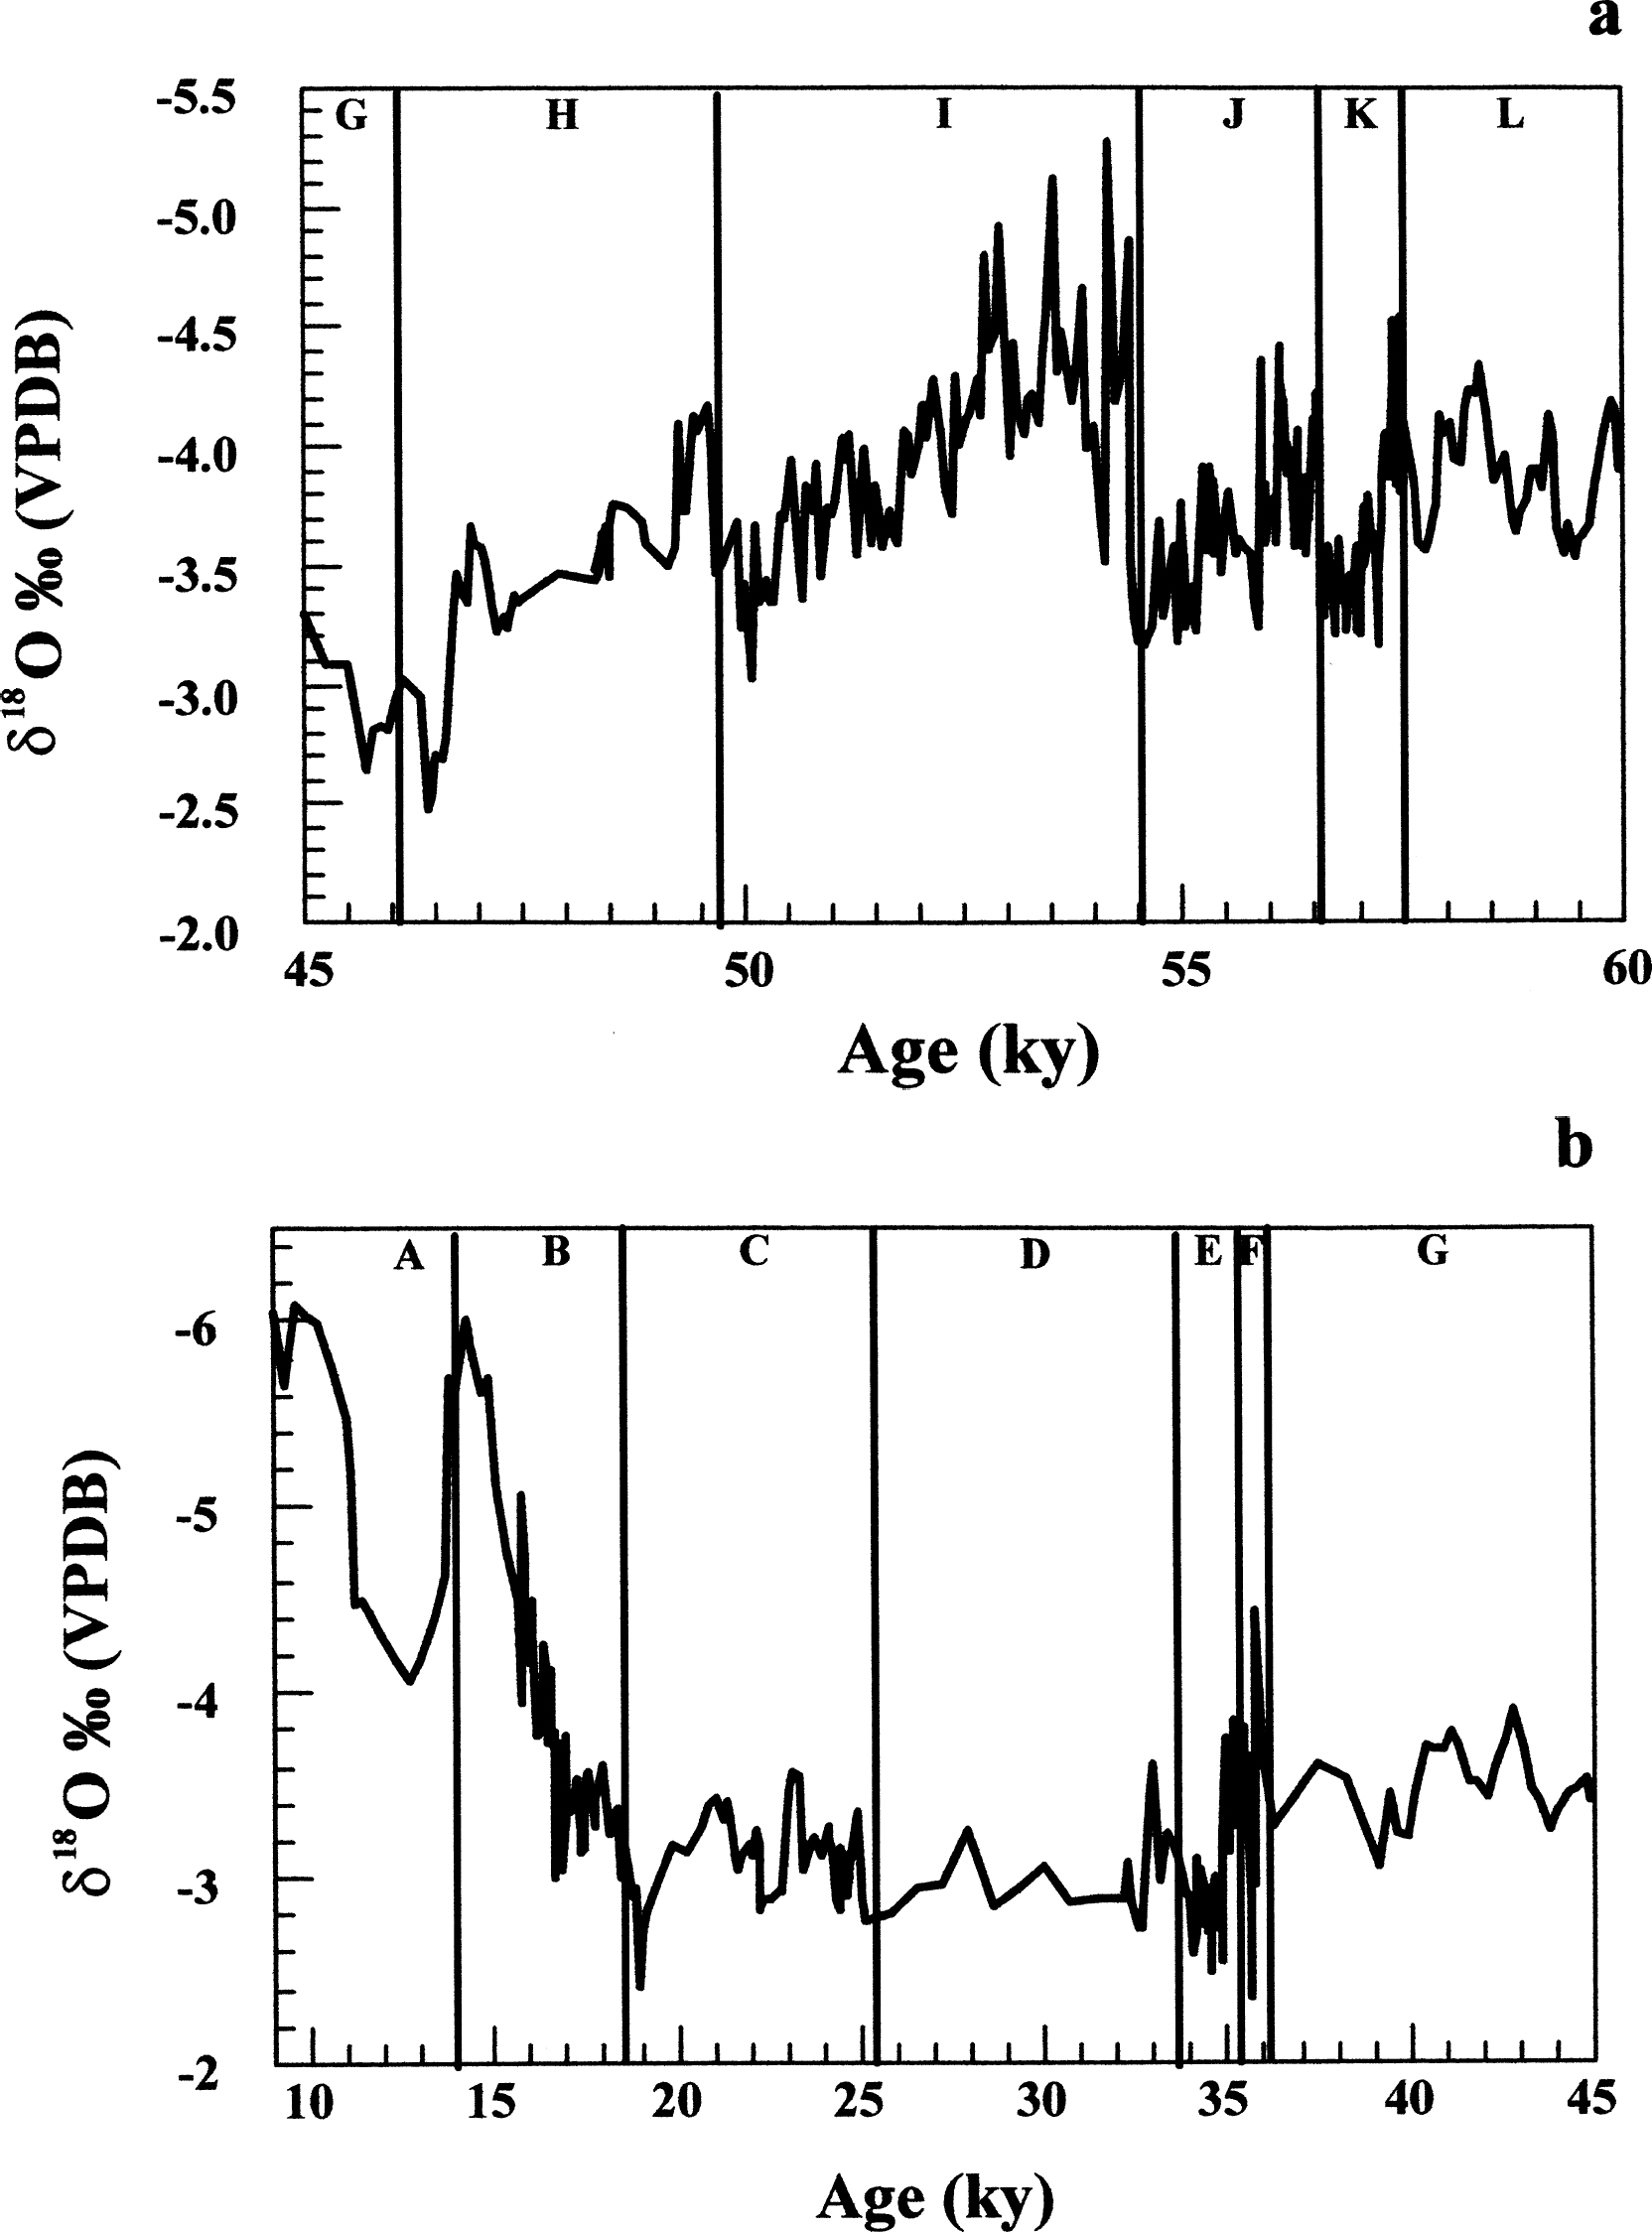
Fig. 2.3 A close-up of the δ18O variations of Soreq Cave speleothems from 60 to 45 ky (a) and from 45 to 10 ky (b). The isotopic cycles are marked from K to A, and are indicated by vertical lines.
Many of the climate events recorded in the Soreq Cave speleothems were also recorded in the north Atlantic, particularly some of the cold events, known as Heinrich events, the last glacial maximum, the Younger Dryas, the deglaciation and the Dansgaard-Oeschger cycles. Where as in northern Europe during a large part of the last glacial freezing conditions would have prevailed, in the eastern Mediterranean region the continuous deposition of speleothems indicates that the climate was much milder. The feedback between the north Atlantic, the Mediterranean Sea and the nearby landmasses, is expressed by the changes in temperatures and the isotopic composition of the rainfall. Although there are many studies on the past climate of the eastern Mediterranean area and northern Africa, none of them were done with the same chronological resolution. Nevertheless, from various studies it is clear that other proxies also record the major cold-dry and wet-warm events recorded by the Soreq Cave speleothems. The other proxies include: soil developments in the present-day arid area of the Negev desert; terrace development and erosion processes; dune incursions; the isotopic composition of carbonate nodules and land snails; lake deposits; and deep sea sediments (e.g., Magaritz and Kaufman 1983; Goodfriend and Magaritz 1988; Goring-Morris and Goldberg 1991; Almogi-Labin et al. 1986; Magaritz 1986; Magaritz and Goodfriend 1987; Goldberg 1995; Rossignol-Strick 1995; Frumkin et al. 1999; Goodfriend 1999).
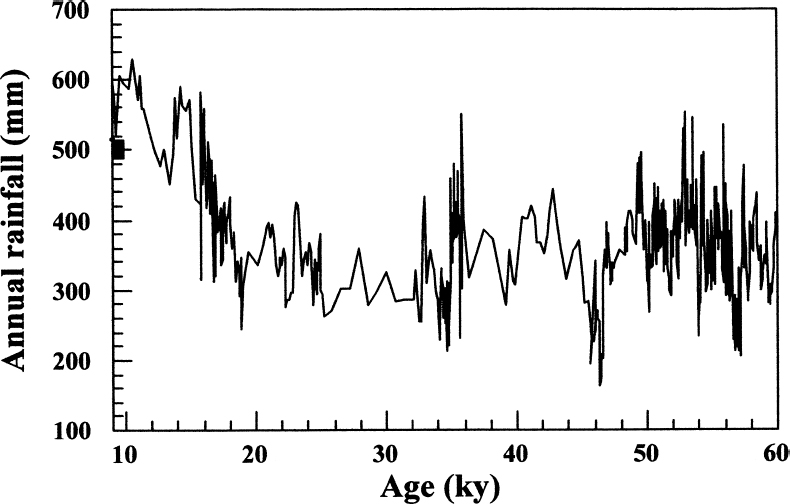
Fig. 2.4 Calculated amount of annual rainfall (mm) based on the δ18O of the Soreq Cave speleothems (for explanation see text). The rectangle on the left axis represents the present-day average annual rainfall.
The continental palaeoclimate of the last glacial (about 60 to 10 ky) in the eastern Mediterranean region was determined by a high resolution study of the oxygen and carbon isotopic composition of cave deposits (speleothems) from the Soreq Cave, Israel, with chronology provided by precise 230Th-U mass spectrometry ages. This time interval coincides also with the evolution of modern humans and is roughly parallel with the Upper Palaeolithic period in the Levant. The entire period from 60 to 19 ky shows a general cooling trend from about 17 to about 10°C and annual rainfall from about 200 to 550 mm. On top of the general trend there are several climatic cycles lasting a few hundred to several thousand years similar to the Dansgaard-Oeschger cycles. The wettest and the warmest events during the last glacial occurred at 54 to 52 ky and at 36 ky. Four short very cold events occurred at 46, 35.5, 34.5 and 19 ky. Sharp warming and increased precipitation characterized the deglaciation period from 19 to 10 ky which was interrupted by another cold event, probably equivalent to the Younger Dryas (YD) from about 13.5 to 11 ky.
Climatic events recorded in the Soreq Cave were also displayed in the north Atlantic, including some of the cold Heinrich events, the last glacial maximum, the Younger Dryas, the deglaciation, and the Dansgaard-Oeschger cycles. But, whereas in northern Europe during much of the last glacial freezing conditions prevailed, in the eastern Mediterranean region the uninterrupted deposition of speleothems indicates that the climate was much milder.