CHAPTER 8
4. Direct and Inverse Variations
11. Conditional Probabilities from Tables
12. Analyzing Relations with Tables
15. Drawing Inferences from Graphs

The SAT Math: Problem Solving and Data Analysis
Why are problem solving and data analysis important on the SAT Math test?
About 26% (15 out of 58 points) of the SAT Math questions fall under the category of Problem Solving and Data Analysis. Questions in this category test your ability to
create a representation of a problem, consider the units involved, attend to the meaning of quantities, and [apply reasoning about] ratios, rates, and proportional relationships.
They also assess your skill in
interpreting and synthesizing data, [as well as identifying] quantitative measures of center, the overall pattern, and any striking deviations from the overall pattern in different data sets.
The specific topics include
• using rates, ratios, and proportional relationships to solve problems
• evaluating and analyzing data gathering methods
• calculating and using statistics of “central tendency” like mean, median, and mode
• using basic measures of data “spread” such as standard deviation, range, and confidence intervals
• solving problems concerning percentages and percent change
• analyzing scatterplots, pie graphs, tables, histograms, and other graphs
• exploring linear, quadratic, and exponential relationships in data
How are these skills used?
Analyzing and drawing inferences from data are core skills not only in mathematics and the physical sciences, but also in social sciences such as psychology, sociology, and economics. Since these subjects constitute a substantial portion of any liberal arts curriculum, colleges consider these to be essential college preparatory skills.
Sound intimidating? It’s not.
If you take the time to master the four core skills presented in these 16 lessons, you will gain the knowledge and practice you need to master SAT Math problem-solving and data analysis questions.
Lesson 1: Averages
The Average Formula
The average (arithmetic mean) of any set of numbers is calculated with the formula

But an even more helpful form of this formula is
sum = average × # of numbers
The average (arithmetic mean) of four numbers is 15. If one of the numbers is 18, what is the average (arithmetic mean) of the remaining three numbers?
(Medium) Since we know the average and the number of numbers, we can calculate their sum: 15 × 4 = 60. If one of these numbers is 18, then the sum of the remaining three numbers is 60 − 18 = 42, so the average of the remaining three is 42/3 = 14.
Ms. Aguila’s class, which has 20 students, scored an average of 90 points on a test. Mr. Bowle’s class, which has 30 students, scored an average of 80 points on the same test. What was the combined average score, in points, for the two classes?
(Medium) Can we just average the scores for the two classes, (90 + 80)/2 = 85, and call this the combined average for the two classes? No: there are more students in Mr. Bowle’s class, so the average is “weighted” toward his class. The sum of the scores in Ms. Aguila’s class is 90 × 20 = 1,800, and the sum of the scores in Mr. Bowle's class is 80 × 30 = 2,400. Therefore, the sum of all the scores is 1,800 + 2,400 = 4,200. Since there are 50 students altogether in the two classes, the combined average is 4,200/50 = 84.
Bonus: Note that the weighted average, 84, is 4 units away from one of the class averages and 6 units away from the other. The ratio of these distances is 2:3, which is exactly the ratio of students in the two classes. Why?

The 20 students in Ms. Aguila’s class were asked how many smartphones their families owned, and the results are tabulated above. What is the average number of phones per family for the 20 students in the class?
A) 3.2
B) 3.5
C) 4.0
D) 4.2
(Medium) If we “unpack” the information from the table, we can get the list of numbers, in increasing order, that all 20 students gave: 2, 2, 2, 2, 2, 3, 3, 3, 3, 4, 4, 4, 4, 4, 4, 4, 4, 5, 5, 6. But there’s really no reason to do this, since the table gives us a handy way of adding all of the numbers, by adding the products of all the rows: (2)(5) + (3)(4) + (4)(8) + (5)(2) + (6)(1) = 10 + 12 + 32 + 10 + 6 = 70. Therefore, the average of these numbers is 70/20 = 3.5, so the correct answer is B.
Lesson 2: Medians and Modes
Medians
The median of a set of numbers is the number that divides the ordered set into two equal sets. That is, half the numbers are less than or equal to the median, and half the numbers are greater than or equal to the median. To find the median of an ordered set of n numbers (increasing or decreasing),
1. Calculate  .
.
2. If this is a whole number, then it is the “place” of the median. For instance, if there are 13 numbers in the set, then the median is the 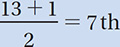 number in the set.
3. If this is not whole number, then average the two numbers on either side of that “place.” For instance, if there are 16 numbers in the set, then  , so the median is the average of the 8th and 9th numbers in the set.
The median of 1, 6, 8, and k is 5. What is the average (arithmetic mean) of these four numbers?
(Medium) We don’t know where k should be when we put the numbers in order, but there are only four possibilities:
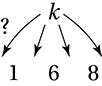
If k is the least of these numbers, then the correct ordering is k, 1, 6, 8. Since there is an even number of numbers, the median is the average of the middle two: (1 + 6)/2 = 3.5. But this contradicts the given fact that the median is 5, so that doesn’t work. Putting k in the next slot gives us an order of 1, k, 6, 8. In this case, the median would be (k + 6)/2.
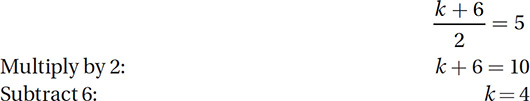
This confirms our assumption that k is between 1 and 6, so k must equal 4. Now we must find the average of these four numbers: (1 + 4 + 6 + 8)/4 = 19/4 = 4.75.
Modes
The mode of a set of numbers is the number that appears the most frequently. This means that not every set of numbers has a mode. For instance, in the set 1, 1, 2, 3, 4, the mode is 1, but the set 1, 2, 3, 4 does not have a mode, because every number occurs once.
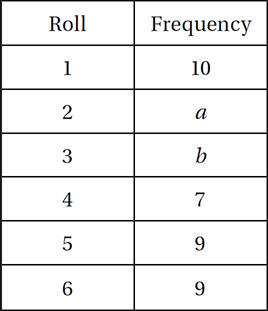
The table above shows the results of 50 rolls of a die, with two missing values labeled a and b. If the mode of these 50 rolls is 2, what is the greatest possible average (arithmetic mean) value of these rolls?
(Hard) If the mode of the rolls is 2, then 2 is the most frequent roll. Since the table shows that the highest known frequency is 10 (for a roll of 1), then a (the number of times a 2 was rolled) must be at least 11. We also know that the total number of rolls is 50, so 10 + a + b + 7 + 9 + 9 = 50; therefore, a + b = 15. The question asks us to find the greatest possible average of these rolls, so we want to maximize the sum of all the rolls. This means that we want b (the number of times a 3 was rolled) to be as great as possible. Since b = 15 − a, then the greatest b can be is 15 − 11 = 4. Therefore, a = 11 and b = 4. Now we have to find the average of these 50 numbers: [(1)(10) + (2)(11) + (3)(4) + (4)(7) + (5)(9) + (6)(9)]/50 = (10 + 22 + 12 + 28 + 45 + 54)/50 = 3.42.
Lesson 3: Data Spread
Statistics of “Spread”
The SAT Math test may ask you about the spread of a set of data. You don’t have to know how to calculate “spread statistics” like variance, standard deviation, or margin of error, but you might be asked to answer more basic questions about the “spread” of a set of data, as in the questions below.
The “absolute deviation” of a number in a set is the absolute difference between that number and the average (arithmetic mean) of the set. The “mean absolute deviation”of a set is the average (arithmetic mean) of all of the absolute deviations in the set. Which of the following sets has the greatest “mean absolute deviation?”
A) 2, 2, 2, 2
B) 2, 3, 4, 5
C) 4, 4, 5, 5
D) 4, 4, 4, 5
(Medium) When you are introduced to a new mathematical term, read its definition carefully—several times, if necessary—and try it out. This question gives us two new terms: absolute deviation and mean absolute deviation. Let’s apply them to a simple set of numbers, such as the one in choice A. The average of this set is 2, so the “absolute deviation” of each of these numbers is its absolute difference from 2, which is 0 for each number. The “mean absolute deviation” of the set is the average of these “absolute deviations,” which is, of course, 0.
Note that the “mean absolute deviation” of a data set is a statistic of “spread.” Since the numbers in A are bunched up as tightly as possible, their “mean absolute deviation” is 0. Now let’s look at the remaining choices. Which seems to have the greatest “spread”? Once you’ve made your guess, do the calculations and see if you’re right. For confirmation, you should find that the “mean absolute deviations” are A) 0, B) 1, C) 0.5, and D) 0.375. Therefore, the correct answer is B.
The “range” of a set of data is defined as the absolute difference between the least value and the greatest value in the set. If five positive integers have an average (arithmetic mean) of 10, what is the greatest possible “range” of this set?
(Medium-hard) If five numbers have an average of 10, then their sum is 5 × 10 = 50. If we want the greatest possible “range,” then we must maximize one of these numbers by minimizing the sum of the other numbers. We are told that these numbers are positive integers, and since the smallest positive integer is 1, we can minimize the sum of the other four numbers by setting them all equal to 1. This gives us 1 + 1 + 1 + 1 + x = 50, so x = 46, which gives us a maximum “range” of 46 − 1 = 45.
Lesson 4: Direct and Inverse Variations
Direct Variation
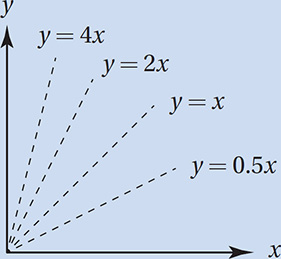
Two quantities vary directly or are directly proportional if they have a constant ratio. As one goes up, the other also goes up: if one of them is doubled, the other is doubled, and so on. We can express the fact that y varies directly as x with either of these equations:
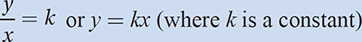
The graph of a direct variation between x and y is a line through the origin with a slope equal to k.
Inverse Variation
Two quantities vary directly or are inversely proportional if they have a constant product. As one goes up, the other also goes up: if one of them is doubled, the other is halved, and so on. We can express the fact that y varies directly as x with either of these equations:
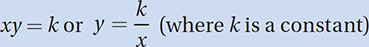
The graph of a direct variation between x and y is a hyperbola that is asymptotic to the x- and y-axes.

Given the ordered pairs in the table above, which of the following could be true?
A) y varies directly as x
B) y varies inversely as x
C) y varies directly as the square of x
D) y varies inversely as the square of x
(Medium) Using the definitions above, we can see whether y and x vary directly or inversely. Do they have a constant ratio? No: 5/1 ≠ 20/2. Therefore, they do not vary directly, making choice A incorrect. Do they have a constant product? No: 1 × 5 ≠ 2 × 20. Therefore, they do not vary inversely, making choice B incorrect. To check choice C, we must ask: do y and x2 have a constant ratio? Yes: 5/(1)2 = 20/(2)2 = 5; therefore, the correct answer is C.

The variables x and y are related by an equation of the form y = Asn where A and n are both positive real numbers. Based on the data in the table above, what is the value of y when x = 3?
A) 40.5
B) 46.0
C) 54.0
D) 64.0
(Medium-hard) To find the value of y when x = 3, we must find the specific equation relating x and y. We can find the values of A and n in the equation y = Axn by first plugging in the values from the table. Plugging in the first ordered pair gives us 12 = A(2)n and plugging in the second ordered pair gives us 96 = A(4)n.


A chemist runs four trials to determine how the concentrations of three reactants affect the rate of a chemical reaction. The table above shows the concentrations, in grams per liter, of the reactants and the rate of reaction, in grams of product per minute, for each trial reaction. Which choice best describes how the rate of reaction varies with these concentrations?
A) It varies directly as the concentration of A and directly as the square of the concentration of C.
B) It varies directly as the concentrations of A and C.
C) It varies inversely as the concentration of B and directly as the square of the concentrations of A and C.
D) It varies directly as the concentrations of A, B, and C.
(Hard) Comparing the first two rows shows that tripling the concentration of A also triples the rate of reaction, so the rate of reaction varies directly as the concentration of A. Comparing the first row to the third row shows that tripling the concentration of B does not affect the rate of reaction; therefore, there is no variation relationship between the rate of reaction and the concentration of B. Comparing the first row to the fourth row, note that the concentration of A has doubled, so we should expect the reaction rate to double to 8.0. However, the actual rate of reaction is 32.0, which is 4 times the expected rate. This is because the concentration of C has doubled. (We can ignore the concentration of B because it has no effect on the reaction rate.) Since doubling the concentration of C causes the reaction rate to quadruple from what it would otherwise be, the rate of reaction varies directly as the square of the concentration of C. Therefore, the correct answer is A.
Exercise Set 1 (No Calculator)
The “range” of a set of data is defined as the absolute difference between the least value and the greatest value in the set. Four positive integers have an average (arithmetic mean) of 7.5.
a. What is the greatest possible range of this set?
b. What is the least possible range of this set?
If the median of 2, 4, 6, and b is 4.2, what is the average (arithmetic mean) of these four numbers?
The average (arithmetic mean) of 2, 5, 8 and k is 0. What is the median of these numbers?
A set of numbers has a sum of 48 and an average of 6. How many numbers are in the set?
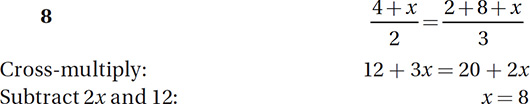
If the average (arithmetic mean) of 4 and x is equal to the average (arithmetic mean) of 2, 8, and x, what is the value of x ?
The median of a set of 22 consecutive even integers is 25. What is the largest number in the set?
If p varies inversely as q and p = 4 when q = 6, which of the following is another solution for p and q ?
A) p = 8 and q = 12
B) p = 8 and q = 10
C) p = 12 and q = 1
D) p = 12 and q = 2
A set of n numbers has an average (arithmetic mean) of 3k and a sum of 12m, where k and m are both positive. Which of the following is equivalent to n ?
A) 
B) 
C) 
D) 
If y varies inversely as the square of x, then when x is multiplied by 4, y will be
A) divided by 16
B) divided by 2
C) multiplied by 2
D) multiplied by 16
Let f(x, y) = Ax2y3 where A is a constant. If f(a, b) = 10, what is the value of f(2a, 2b) ?
A) 100
B) 260
C) 320
D) 500
A set of four integers has a mode of 7 and a median of 4. What is the greatest possible average (arithmetic mean) of this set?
A) 3.50
B) 3.75
C) 4.00
D) 4.25
Exercise Set 1 (Calculator)
Four positive integers have a mode of 4 and a median of 3. What is their sum?
Five different integers have an average (arithmetic mean) of 10. If none is less than 5, what is the greatest possible value of one of these integers?
If b varies inversely as a, and b = 0.5 when a = 32, then for how many ordered pairs (a, b) are a and b both positive integers?
The median of 11 consecutive integers is 28. What is the least of these integers?
If y = Ax3 and y = 108 when x = 3, then for what value of x does y = 62.5 ?
A set of four positive integers has a median of 2 and a mode of 2. If the average (arithmetic mean) of this set is 3, what is the largest possible number in the set?
If y varies inversely as x and the graph of their relation in the xy-plane passes through the point (2, 15), what is the value of y when x = 4 ?
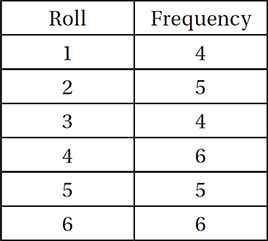
A six-sided die was rolled 30 times and the results are tabulated above. What is the difference between the average (arithmetic mean) of the rolls and the median of the rolls?
A) 0.1
B) 0.2
C) 0.3
D) 0.4
If y varies inversely as the square of x, and y = 4 when x = 2, then what is the value of y when x = 3 ?
A) 
B) 
C) 3
D) 9
At a fixed temperature, the volume of a sample of gas varies inversely as the pressure of the gas. If the pressure of a sample of gas at a fixed temperature is increased by 50%, by what percent is the volume decreased?
A) 25%
B) 
C) 50%
D) 
If the graph of y = f(x) in the xy-plane contains the points (4, 3) and (16, 6), which of the following could be true?
A) y varies directly as the square of x
B) y varies inversely as the square of x
C) y varies directly as the square root of x
D) y varies inversely as the square root of x
EXERCISE SET 1 ANSWER KEY
No Calculator
1a. 26 If the average of 4 numbers is 7.5, they must have a sum of 4 × 7.5 = 30. To maximize the range, we must maximize one of the numbers by minimizing the other 3 by setting them all equal to 1 (the smallest positive integer). The numbers therefore are 1, 1, 1, and 27, and the range is 27 - 1 = 26.
1b. 1 To minimize the range, we “cluster” the numbers as closely together as possible. The tightest cluster of integers with a sum of 30 is 7, 7, 8, and 8, which gives a range of 8 - 7 = 1.
2. 4.1 If the set contains four numbers, its median is the average of the middle two numbers, so the middle two numbers must have a sum of (2)(4.2) = 8.4. Thus the four numbers must be 2, 4, 4.4, and 6. (Notice that the question did not say that all numbers were integers.) The average of these is 16.4/4 = 4.1.
3. 3.5 If the average of these numbers is 0, their sum must be (4)(0) = 0, and therefore k = -15 and the numbers, in increasing order, are -15, 2, 5, and 8. The median is (2 + 5)/2 = 3.5.
4. 8 6 = 48/n, so n = 8.
5. 
6. 46 The median divides the set into two equal parts, so 11 of these numbers must be less than 25 and 11 must be greater than 25. Since they are consecutive even integers, the 11 numbers above the median must be 26, 28, 30, 32, . . . 46.
7. D If p and q vary inversely, their product is a constant. 4 × 6 = 24, and the only other pair with a product equal to 24 is (D) 12 and 2.
8. A n = sum/average = 12m/3k = 4m/k
9. A The equation relating x and y is y = k/x2. If x = 1, then y = k. If x is multiplied by 4, then x = 4 and y = k/16, so y has been divided by 16.
10. C f(a, b) = Aa2b3 = 10. f(2a, 2b) = A(2a)2(2b)3 = 32(Aa2b3) = 32(10) = 320.
11. B If this set has a mode of 7, then at least two of the numbers are 7. If the median is 4, then the two middle numbers must have a sum of (2)(4) = 8. Therefore the two middle numbers are 1 and 7, and the sequence must be n, 1, 7, 7. To maximize the average, we must maximize n, but n can’t be 1, because then the set would not have a mode of 7. It must be the next lower integer, 0, and the average is (0 + 1 + 7 + 7)/4 = 3.75.
Calculator
12. 11 The only four numbers that satisfy these conditions are 1, 2, 4, and 4.
13. 24 If the average of five numbers is 10, their sum is 5 × 10 = 50. To maximize one, we must minimize the sum of the other four. If none is less than five, and all are different integers, they are 5, 6, 7, 8, and 24.
14. 5 If the variables vary inversely, their product is constant. (0.5)(32) = 16. The only pairs of positive integers with a product of 16 are (1, 16), (2, 8), (4, 4), (8, 2), and (16, 1).
15. 23 If the middle number is 28, there are five numbers less than 28, and five greater. Since they are consecutive integers, the least is 28 - 5 = 23.
16. 2.5 Since 108 = A(3)3, A = 4, so if 62.5 = 4x3, x = 2.5.
17. 7 At least two of the integers must be 2 and none can be less than 1. If the sum must be 4 × 3 = 12, the set including the largest possible number is 1, 2, 2, and 7.
18. 7.5 The product of x and y is 2 × 15 = 30, so y = 30/4 = 7.5.
19. C Average = (1 × 4 + 2 × 5 + 3 × 4 + 4 × 6 + 5 × 5 + 6 × 6)/30 = 3.7. Median = average of 15th and 16th roll: (4 + 4)/2 = 4. 4 - 3.7 = 0.3.
20. A y and x2 must have a constant product of 4 × 22 = 16. Therefore, y = 16/9.
21. B Pick values for the original pressure and volume, such as 2 and 3. If they vary inversely, their product is the constant 2 × 3 = 6. If the pressure is increased by 50%, it becomes (1.5)(2) = 3, and so the volume becomes 6/3 = 2, a change of -33 1/3%.
22. C For both ordered pairs,  is a constant:
  , so y is directly proportional to the square root of x.
Lesson 5: Rate Problems
Rates
The units for any rate give the formula for the rate. For instance, if a problem mentions a rate of kilograms per second, then this tells us that the formula for this rate is

because per just means divided by.
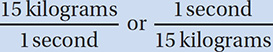
Rate Conversion Factors
Every rate fact gives us a conversion factor. For instance, if we are told that a rocket burns fuel at a rate of 15 kilograms per second, then either of these can be used as a conversion factor in that problem:
On a sunny day, a 50-square-meter section of a solar panel array can generate an average of 1 kilowatt-hour of energy per hour over a 10-hour period. If an average household consumes 30 kilowatt-hours of energy per day, how large an array is required to power 1,000 households on sunny days?
A) 1,500 square meters
B) 15,000 square meters
C) 150,000 square meters
D) 15,000,000 square meters
(Hard) This is a rate problem because it includes two per quantities: kilowatt-hours per hour (for the solar panels), and kilowatt-hours per day (for the households). We can solve this as a problem of converting 1,000 households to a particular number of square meters of solar panels:

Note that all of the units on the left side of the equation cancel except for “square meters” (the unit we want) and that each conversion factor corresponds to an explicit fact mentioned in the problem.
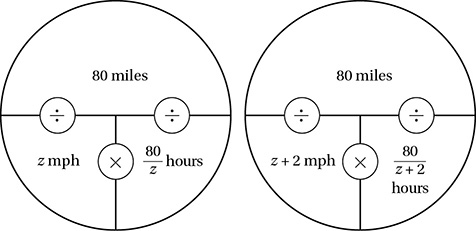
The Rate Pie
Many rate problems are easily solved with the rate pie, which summarizes all three forms of the “rate equation” at once:

To use the rate pie, just insert the two given quantities in the proper spots, then calculate as shown to find the third quantity.
Maria completed an 80-mile bike race at an average speed of z miles per hour. If she had averaged 2 miles per hour faster, she would have completed the race in 10 fewer minutes. What is the value of z?
(Medium-hard) Let’s make two pies, one for the real situation and one for the hypothetical situation.

Slopes and Unit Rates
In the graph of any linear function, the slope of the line is equivalent to the unit rate of the function, that is, the rate at which y increases or decreases for every unit increase in x.
A water pump for a dredging project can remove 180 gallons of water per minute, but it can only work for 2.5 consecutive hours, at which time it requires 20 minutes of maintenance before it can be brought back online. While it is offline, a smaller pump is used in its place, which can pump 80 gallons per minute. Using this system, what is the least amount of time it would take to pump 35,800 gallons of water?
A) 3 hours 15 minutes
B) 3 hours 20 minutes
C) 3 hours 25 minutes
D) 3 hours 30 minutes
(Hard) If we want to pump out the water as quickly as possible, we want to use the faster pump for the maximum 2.5 hours. To find the total amount of water pumped in that time, we do the conversion:

So after 2.5 hours, there are still 35,800 − 27,000 = 8,800 gallons left to pump. At that point, the smaller pump must be used for a minimum of 20 minutes, which can pump
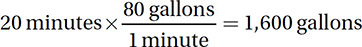
which still leaves 8,800 − 1,600 = 7,200 gallons. Note that we have already taken 2 hours 50 minutes, and yet have not finished the job. So how long will it take to pump the remaining 7,200 gallons? Now that we can bring the stronger pump online, it will only take

for a total of 3 hours 30 minutes; therefore, the correct answer is D.
Although you don’t need to use a graph to solve this problem, a graph can help to show the overall picture:
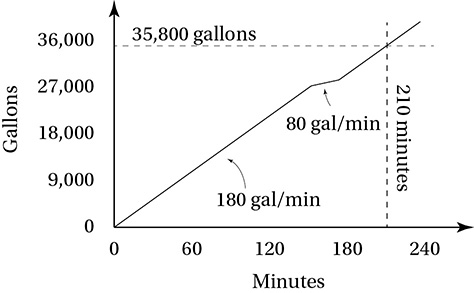
Note that the line has a slope of 180 gallons per minute for the first 150 minutes, 80 gallons per minute for the next 20 minutes, and 180 again for the final 40 minutes and crosses the line y = 35,800 at the 210-minute mark.
Lesson 6: Ratios
Part-to-Whole Ratios
When dealing with part-to-part ratios, it often helps to divide each part by the whole (the sum of the parts) to get the part-to-whole ratios.
Bronze is an alloy consisting of copper and tin. If 50 kg of a bronze alloy of 20% tin and 80% copper is mixed with 70 kg of a bronze alloy of 5% tin and 95% copper, what fraction, by weight, of the combined bronze alloy is tin?
A) 5/48
B) 9/80
C) 1/8
D) 1/4
(Medium) The total weight is 50 + 70 = 120 kg, but the weight of just the tin is (0.20)(50) + (0.05)(70) = 13.5 kg. Therefore, the fraction of the alloy that is tin is 13.5/120, which simplifies to 9/80. Therefore, the correct answer is B.
Probabilities as Ratios
A probability is a part-to-whole ratio between a subset of equally likely events and a larger set of equally likely events.
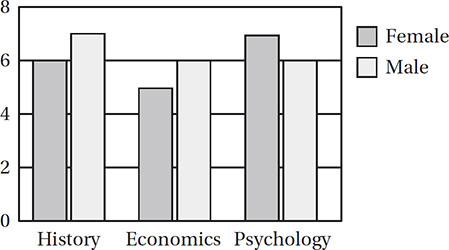
The bar graph above shows the distribution of declared majors among a group of 37 social science students in a graduating university class. If a female is chosen at random from this group, what is the probability that she is an economics major?
(Easy) There are 6 + 5 + 7 = 18 females in this group, and 5 are them are economics majors. Therefore, the probability is 5/18 = 0.278.
Part-to-Part Ratios
When dealing with part-to-part ratios, it often helps to divide each part by the whole (the sum of the parts) to get the part-to-whole ratios.
A marathon offers $5,000 in prize money to the top three finishers. If the first-, second-, and third-place prizes are distributed in a ratio of 5:4:1, how much money, in dollars, does the second-place finisher receive?
(Easy) This problem gives us a part-to-part-to-part ratio, so the whole is 5 + 4 + 1 = 10 equal parts. The second-place finisher gets 4 of these 10 equal parts, and so takes home (4/10) × $5,000 = $2,000.
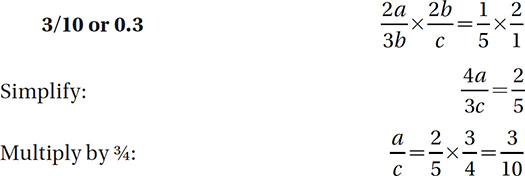
At the Andromeda Book Store, the ratio of self-help titles to fiction titles is 3:10, and the ratio of biography titles to fiction titles is 2:7. What is the ratio of biography titles to self-help titles?
A) 6:70
B) 20:21
C) 21:20
D) 70:6
(Medium-hard) Simple ratios can be expressed as fractions. For instance,
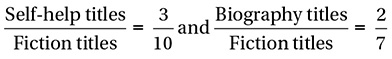
Now note that we can get the ratio we want by just multiplying two well-chosen fractions:
Note that we have to “flip” one of the ratios to do the calculation:

Therefore, the correct answer is B.
Exercise Set 2 (Calculator)
If a train travels at a constant rate of 50 miles per hour, how many minutes will it take to travel 90 miles?
Two cars leave the same point simultaneously, going in the same direction along a straight, flat road, one at 35 miles per hour and the other at 50 miles per hour. After how many minutes will the cars be 5 miles apart?
If a $6,000 contribution is divided among charities A, B, and C in a ratio of 8:5:2, respectively, how much more, in dollars, does charity A receive than charity C ?
If a car traveling at 60 mph is chasing a car travelling at 50 mph and is ¼ mile behind, how many minutes will it take the first car to catch the second?
A truck’s gas tank can hold 18 gallons. If the tank is 2/3 full and the truck travels for 4 hours at 60 miles per hour until it runs out of gas, what is the efficiency of the truck, in miles per gallon?
A motorcycle has a fuel efficiency of 60 miles per gallon when it is cruising at a speed of 50 miles per hour. How many hours can it travel at 50 miles per hour on a full tank of gas, if its tank can hold 10 gallons?
If the ratio of a to b is 3 to 4, and the ratio of a to c is 5 to 2, what is the ratio of b to c ?
A) 3 to 10
B) 3 to 5
C) 5 to 3
D) 10 to 3
A paint mixture consists of a 3:2:11 ratio of red, violet, and white, respectively. How many ounces of violet are needed to make 256 ounces of this mixture?
A) 32
B) 36
C) 46
D) 48
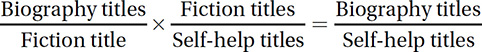
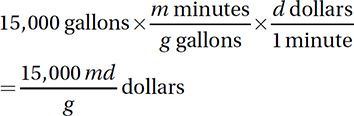
A pool that holds 20,000 gallons is ¼ full. A pump can deliver g gallons of water every m minutes. If the pumping company charges d dollars per minute, how much will it cost, in dollars, to fill the pool?
A) 
B) 
C) 
D) 
Yael travels to work at an average speed of 40 miles per hour and returns home by the same route at 24 miles per hour. If the total time for the round trip is 2 hours, how many miles is her trip to work?
A) 25
B) 30
C) 45
D) 60
A hare runs at a constant rate of a miles per hour, and a tortoise runs at a constant rate of b miles per hour, where 0 < b < a. How many more hours will it take the tortoise to finish a race of d miles than the hare?
A) 
B) 
C) 
D) 
Janice can edit 700 words per minute and Edward can edit 500 words per minute. If each page of text contains 800 words, how many pages can they edit, working together, in 20 minutes?
If a printer can print 5 pages in 20 seconds, how many pages can it print in 5 minutes?
Traveling at 40 miles per hour, Diego can complete his daily commute in 45 minutes. How many minutes would he save if he traveled at 50 miles per hour?
If  and
and  , what is
  ?
?
If a cyclist races at 30 miles per hour for 1/2 of the distance of a race, and 45 miles per hour for the final 1/2 of the distance, what is her average speed, in miles per hour, for the entire race?
Anne can paint a room in 2 hours, and Barbara can paint the same room in 3 hours. If they each work the same rate when they work together as they do alone, how many hours should it take them to paint the same room if they work together?
What is the average speed, in miles per hour, of a sprinter who runs ¼ mile in 45 seconds? (1 hour = 60 minutes and 1 minute = 60 seconds)
A) 11.25
B) 13.5
C) 20
D) 22
A car travels d miles in t hours and arrives at its destination 3 hours late. At what average speed, in miles per hour, should the car have gone in order to arrive on time?
A) 
B) 
C) 
D) 
In three separate 1-mile races, Ellen finished with times of x minutes, y minutes, and z minutes, respectively. What was her average speed, in miles per hour, for all three races?
A) 
B) 
C) 
D) 
Sylvia drove 315 miles and arrived at her destination in 9 hours. If she had driven 10 miles per hour faster, how many hours would she have saved on the trip?
A) 1.75 hours
B) 2.00 hours
C) 2.25 hours
D) 2.50 hours
EXERCISE SET 2 ANSWER KEY
1. 108 time = distance/rate = 90 miles/50 mph = 1.8 hours = 1.8 hour × 60 min/hour = 108 minutes.
2. 20 The fast car is moving ahead of the slow car at a rate of 50 - 35 = 15 mph, and so it will be 5 miles ahead after 5 ÷ 15 = 1/3 hour = 20 minutes.
3. 2,400 Since 8 + 5 + 2 = 15, charity A receives 8/15 of the contribution, and charity C receives 2/15. The difference is 6/15, or 2/5, of the total, which is (2/5)($6,000) = $2,400.
4. 1.5 Since the faster car is catching up to the slower car at 60 - 50 = 10 mph, it will take (1/4 mile)/(10 mph) = 1/40 hours = 60/40 minutes = 1.5 minutes.
5. 20 The tank contains (2/3)(18) = 12 gallons, and travels (4 hours)(60 mph) = 240 miles, so its efficiency is 240/12 = 20 miles per gallon.
6. 12 With 10 gallons of gas and an efficiency of 60 miles per gallon, the car can travel 10 × 60 = 600 miles. At 50 miles an hour this would take 600/50 = 12 hours.
7. D 
8. A According to the ratio, the mixture is 2/(3 + 2 + 11) = 2/16 = 1/8 violet. Therefore 256 ounces of the mixture would contain (1/8)(256) = 32 ounces of violet paint.
9. C If the pool is ¼ full, it requires (3/4)(20,000) = 15,000 more gallons.
10. B Let x = the distance, in miles, from home to work. Since time = distance/rate, it takes Yael x/40 hours to get to work and x/24 hours to get home.

11. B The tortoise would take d/b hours to complete the race, and the hare would take d/a hours to complete the race, so the tortoise would take
 hours longer.
12. 30 Together they can edit 700 + 500 = 1,200 words per minute, so in 20 minutes they can edit
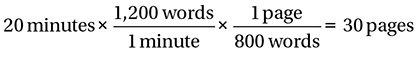
13. 75 If the printer can print 5 pages in 20 seconds, it can print 15 pages in 1 minute, and therefore 15 × 5 = 75 pages in 5 minutes.
14. 9 Since 45 minutes is ¾ hour, Diego’s daily commute is 40 × ¾ = 30 miles. If he traveled at 50 mph it would take him 30/50 = 3/5 hours = 36 minutes, so he would save 45 - 36 = 9 minutes.
15. 
16. 36 Pick a convenient length for the race, such as 180 miles (which is a multiple of both 30 and 45). The first half of the race would therefore be 90 miles, which would take 90 miles ÷ 30 mph = 3 hours, and the second half would take 90 miles ÷ 45 mph = 2 hours. Therefore, the entire race would take 3 + 2 = 5 hours, and the cyclist’s average speed would therefore be 180 miles ÷ 5 hours = 36 miles per hour.
17. 1.2 or 6/5 Anne’s rate is 1/2 room per hour, and Barbara’s rate is 1/3 room per hour, so together their rate is 1/3 + 1/2 = 5/6 room per hour. Therefore, painting one room should take (1 room)/(5/6 room per hour) = 6/5 hours.
18. C 
19. B In order to arrive on time, it would have to travel the d miles in t - 3 hours, which would require a speed of d/(t - 3) mph.
20. D

21. B Sylvia traveled at 315/9 = 35 miles per hour. If she had traveled at 35 + 10 = 45 miles per hour, she would have arrived in 315/45 = 7 hours, thereby saving 2 hours.
Lesson 7: Percentages
Translating Percent Problems
Here’s a handy translation key for word problems:

If the sales tax for clothing is 5%, what is the sales tax, in dollars, on a sweatshirt with a retail price of $36?

What percent of 150 is 93?

Commutativity of Percentages
Here’s a handy fact: x% of y is the same as y% of x.
For instance, calculating 80% of 25 is a bit tricky, but it’s easier if you think of it as 25% of 80, which is 20.
Changing by Percentages
To increase a number by a%, just multiply by (100 + a)%, and to decrease a number by a%, just multiply by (100 - a)%.
On the day it was issued, one share of a stock in Consolidated Energy was priced at $50. If the share price increased by 120% in its first five years and by 150% in its next five years, what was the share price, in dollars, after 10 years?
(Medium) To increase a number by 120%, we multiply by 100% + 120% = 220% = 2.20. To increase by 150%, we multiply by 100% + 150% = 250% = 2.50. Therefore, the share price after 10 years was ($50)(2.20)(2.50) = $275.
The final cost of a phone charger is $10.07. If this cost includes a 6% sales tax, what is the cost, in dollars, of the phone charger before tax?
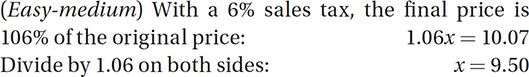
Bonus: Why is it incorrect to reduce $10.07 by 6%?
Lesson 8: Percent Change
The Percent Change Formula
To find a percent change, just use the formula

If a population of bacteria increases from 80 cells to 220 cells, what is the percent increase in this population?
A) 64%
B) 75%
C) 175%
D) 275%
(Easy) Using the formula, the percent change is  , so the correct answer is C.
A store is selling all scarves at a 20% discount, but a customer has a coupon for an additional 30% off this sale price for up to three scarves. If the customer buys five scarves of equal retail price, what percent will the total price be discounted from the original retail price for the five scarves?
A) 32.0%
B) 34.4%
C) 42.4%
D) 50.0%
(Medium-hard) Let’s say each of the five scarves has a retail price of x dollars. For three of these scarves, the customer gets the extra 30% discount, so the final price is (0.80)(0.70)(3x) = 1.68x. For the other two scarves, there is no extra discount, so the final price is (0.80)(2x) = 1.60x, for a total final price of 1.68x + 1.60x = 3.28x dollars. This is reduced from an original retail price of 5x dollars, so the percent change is
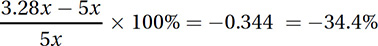
Therefore, the correct answer is B.
How many liters of a 40% saline solution must be added to 4 liters of a 10% saline solution to make a 20% saline solution?
A) 1.0
B) 1.6
C) 2.0
D) 3.2
(Medium-hard) Let x be the number of liters of the 40% saline solution that must be added. If we start with 4 liters of a 10% saline solution, we have 4(0.10) = 0.4 liter of saline. If we add x liters of a 40% saline solution, we will be adding x(0.40) = 0.4x liters of saline to this solution, so we will have 0.4 + 0.4x liters of saline out of 4 + x liters of total solution. Since we want this to be a 20% saline solution, we can set up the following equation:
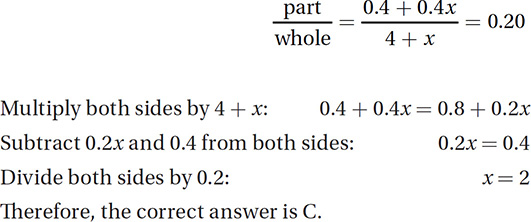
Bonus: Why is the ratio of the volumes (4 liters: 2 liters = 2:1) the reciprocal of the ratio of the distances to the net concentration (20% - 10%: 40% - 20% = 10:20 = 1:2)?
Lesson 9: Proportions and Scaling
Proportions
A proportion is just a statement that two ratios are equal.

The Law of Cross-Multiplication
In any proportion, the cross-products must be equal.

The Law of Cross-Swapping
You may cross-swap in any proportion.
If a, b, c are real numbers such that  , which of the following must also be true?
A) a2 + b2 - c2 = 0
B) a2 - b2 - c2 = 0
C) a2 - b2 + c2 = 0
D) a2 + b2 + c2 = 0

Scaling
On a scale blueprint, the drawing of a rectangular patio has dimensions 5 cm by 7.5 cm. If the longer side of the actual patio measures 21 feet, what is the area, in square feet, of the actual patio?
A) 157.5 square feet
B) 294.0 square feet
C) 356.5 square feet
D) 442.0 square feet
(Medium) In a scale drawing, all lengths are proportional to the corresponding lengths in real life, so we can set up a proportion here to find the shorter side of the patio, x.

Therefore, the patio has dimensions 21 feet by 14 feet, and so it has an area of (21)(14) = 294 square feet, and the correct answer is B.
Exercise Set 3 (Calculator)
What number is 150% of 30?
If the areas of two circles are in the ratio of 4:9, the circumference of the larger circle is how many times the circumference of the smaller circle?
What number is 30% less than 70?
What number is the same percent of 36 as 5 is of 24?
David’s motorcycle uses 2/5 of a gallon of gasoline to travel 8 miles. At this rate, how many miles can it travel on 5 gallons of gasoline?
The retail price of a shirt is $60, but it is on sale at a 20% discount and you have an additional 20% off coupon. If there is also a 5% sales tax, what is the final cost of the shirt?
A) $34.20
B) $36.48
C) $37.80
D) $40.32
If the price of a house increased from $40,000 to $120,000, what is the percent increase in price?
A) 67%
B) 80%
C) 200%
D) 300%
At a student meeting, the ratio of athletes to nonathletes is 3:2, and among the athletes the ratio of males to females is 3:5. What percent of the students at this meeting are female athletes?
A) 22.5%
B) 25%
C) 27.5%
D) 37.5%
To make a certain purple dye, red dye and blue dye are mixed in a ratio of 3:4. To make a certain orange dye, red dye and yellow dye are mixed in a ratio of 3:2. If equal amounts of the purple and orange dye are mixed, what fraction of the new mixture is red dye?
A) 
B) 
C) 
D) 
If the price of a stock declined by 30% in one year and increased by 80% the next year, by what percent did the price increase over the two-year period?
A) 24%
B) 26%
C) 50%
D) 500
A farmer has an annual budget of $1,200 for barley seed, with which he can plant 30 acres of barley. If next year the cost per pound of the seed is projected to decrease by 20%, how many acres will he be able to afford to plant next year on the same budget?
A) 24
B) 25
C) 36
D) 37.5
If x is  of 90, what is the value of
  ?
?
If n is 300% less than  , what is the value of |n| ?
The cost of a pack of batteries, after a 5% sales tax, is $8.40. What was the price before tax, in dollars?
If the price of a sweater is marked down from $80 to $68, what is the percent discount? (Ignore the % symbol when gridding.)
Three numbers, a, b, and c, are all positive. If b is 30% greater than a, and c is 40% greater than b, what
is the value of  ?
?
If the width of a rectangle decreases by 20%, by what percent must the length increase in order for the total area of the rectangle to double? (Ignore the % symbol when gridding.)
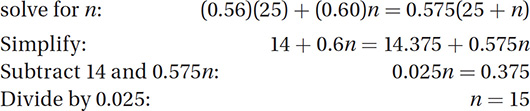
Two middle school classes take a vote on the destination for a class trip. Class A has 25 students, 56% of whom voted to go to St. Louis. Class B has n students, 60% of whom voted to go to St. Louis. If 57.5% of the two classes combined voted to go to St. Louis, what is the value of n ?
If 12 ounces of a 30% salt solution are mixed with 24 ounces of a 60% salt solution, what is the percent concentration of salt in the mixture?
A) 45%
B) 48%
C) 50%
D) 54%
If the length of a rectangle is doubled but its width is decreased by 10%, by what percent does its area increase?
A) 80%
B) 90%
C) 180%
D) 190%
The freshman class at Hillside High School has 45 more girls than boys. If the class has n boys, what percent of the freshman class are girls?
A) 
B) 
C) 
D) 
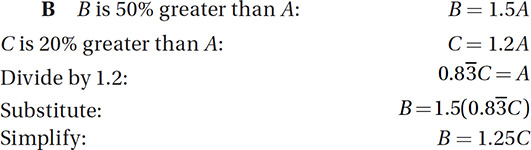
If the population of town B is 50% greater than the population of town A, and the population of town C is 20% greater than the population of town A, then what percent greater is the population of town B than the population of town C ?
A) 20%
B) 25%
C) 30%
D) 40%
EXERCISE SET 3 ANSWER KEY
1. 45 1.50 × 30 = 45
2. 1.5 Imagine that the areas are 4p and 9p. Since the area of a circle is pr2, their radii are 2 and 3, and their circumferences are 2(2)p = 4p and 2(3)p = 6p, and 6p ÷ 4p = 1.5.
3. 49 70 - 0.30(70) = 0.70(70) = 49.
4. 
5. 
6. D 1.05 × 0.80 × 0.80 × $60 = $40.32
7. C (120,000 - 40,000)/40,000 × 100% = 200%
8. D The fraction of students who are athletes is 3/(2 + 3) = 3/5, and the fraction of these who are females is 5/(3 + 5) = 5/8. Therefore, the portion who are female athletes is 3/5 × 5/8 = 3/8 = 37.5%.
9. C The purple dye is 3/(3 + 4) = 3/7 red, and the orange dye is 3/(3 + 2) = 3/5 red. Therefore, a half-purple, half-orange dye is (1/2)(3/7) + (1/2)(3/5) = 3/14 + 3/10 = 18/35 red.
10. B If the price of the stock were originally, say, $100, then after this two-year period its price would be (0.70)(1.80)($100) = $126, which is a 26% increase.
11. D The quantity of barley seed is proportional to the acreage it can cover. The cost of seed for each acre of barley was originally $1,200/30 = $40 per acre. The next year, after the 20% decrease, the price would be (0.80)($40) = $32 per acre. With the same budget, the farmer can therefore plant 1,200/32 = 37.5 acres of barley.
12. 1/15 or 0.067 or 0.066


13. 5 
14. 8.00 Let x be the price before tax:

15. 15 (68 - 80)/80 = -0.15
16. 1.82 b = 1.30a and c = 1.40b, so c = 1.40(1.30a) = 1.82a. Therefore, c/a = 1.82a/a = 1.82.
17. 150 For convenience, pick the dimensions of the rectangle to be 10 and 10. (This is of course a square, but remember that a square is a rectangle!) This means that the original area is 10 × 10 = 100. If the width decreases by 20%, the new width is (0.80)(10) = 8. Let the new length be x. Since the new rectangle has double the area, 8x = 200, and so x = 25. This is an increase of (25 - 10)/10 × 100% = 150%.
18. 15 The total number of “St. Louis votes” can be expressed in two ways, so we can set up an equation to
19. C The total amount of salt in the mixture is (0.30)(12) + (0.60)(24) = 18, and the total weight of the mixture is 12 + 24 = 36 ounces, so the percent salt is 18/36 = 50%.
20. A If the original dimensions are w and l, the original area is wl. If the length is doubled and the width decreased by 10%, the new area is (0.9l)(2w) = 1.8wl, which is an increase of 80%.
21. C The number of girls in the class is n + 45, and the total number of students is n + n + 45, so the percent of girls is  .
.
22. 
Lesson 10: Tables and Venn Diagrams
Tables as Organizational Tools
Tables are useful for organizing information that falls into non-overlapping categories.
Sam is considering buying one of two models of car. The sticker price of model N is 25% higher than that of model P, but he will receive $1,500 in trade-in credit from the model N dealer and only $1,000 in trade-in credit from the model P dealer. Even after the trade-in credits are applied to both cars, model N is still $2,000 more expensive than model P (before taxes and fees). What is the sticker price of Model N?
A) $10,000
B) $12,000
C) $12,500
D) $13,000
(Medium) Since the car models are non-overlapping categories, setting up a table might be useful.
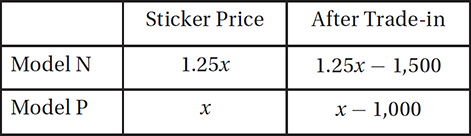
Let x be the sticker price of model P. The sticker price of model N is 25% higher than that of model P, so it is 1.25x. The respective costs after trade-in, then, are 1.25x − 1,500 and x − 1,000. Even after the trade-in, Model N is still $2,000 more expensive than model P:

But x stands for the sticker price of model P, not model N, so we need to plug this back in to find the sticker price of model N. Since (1.25)(10,000) = 12,500, the correct answer is C.
Venn Diagrams
Venn diagrams are useful for organizing information that falls into overlapping categories.
In a poll of 250 college students, 137 said that they attended at least one athletic event in the past year, and 115 said that they attended at least one career services event in the past year. If 82 of these students attended both an athletic event and a career services event in the past year, how many students attended neither an athletic event nor a career services event in the past year?
A) 33
B) 55
C) 80
D) 170
(Medium) Since there is overlap between the sets of students who attended the two different categories of events, a Venn diagram is useful for keeping track of things. When setting it up, remember that the parts must combine to make the “whole” for each set. For example, we know that 137 students altogether attended an athletic event, but 82 of these also attended a career services event, so 137 - 82 = 55 students must have attended an athletic event but not a career services event. Similarly, 115 - 82 = 33 students attended a career services event but not an athletic event. Therefore, our diagram should look like this:
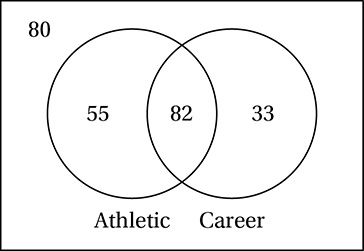
This shows that 55 + 82 + 33 = 170 students attended either an athletic event, a career services event, or both, which means that 250 - 170 = 80 attended neither, and so the correct answer is C. Note that the Venn diagram allows us to use basic arithmetic to confirm all the facts in the problem.
Lesson 11: Conditional Probabilities from Tables
Probabilities as Population Fractions
A conditional probability is the probability that something is true given that something else is also true. Solving conditional probability problems often requires reading the problem carefully and finding the relevant population fractions.
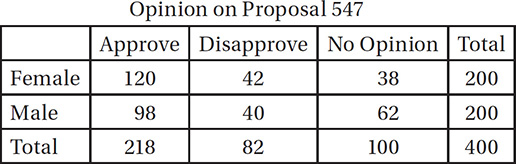
Four hundred people were surveyed and asked their opinions about municipal proposal 547; the results are tabulated above. If a person who expressed an opinion on this survey is selected randomly, what is the probability that the person is female?
A) 0.52
B) 0.54
C) 0.68
D) 0.81
(Medium) According to the table, 218 + 82 = 300 of the 400 people surveyed expressed an opinion. Of these, 120 + 42 = 162 are female, and therefore the probability that someone with an opinion chosen randomly is female is 162/300 = 0.54.

The letter grades on four tests for Ms. Hartman’s 25 students (including incomplete grades, marked “Inc.”) are tabulated above. Five students in the class received an A on both test 3 and test 4. If one of the students who received an A on either test 3 or test 4 is chosen at random, what is the probability that he or she received an A on test 4?
(Medium) Because 7 students got an A on test 3 and 10 got an A on test 4, but 5 got an A on both, this accounts for 7 + 10 − 5 = 12 students altogether. Since 10 of these 12 students received an A on test 4, the probability is 10/12 or 5/6, so the correct answer is D.
If the incomplete grades are excluded from the statistics for each test in the table above, for which of the tests was the median grade higher than B?
A) None of the tests
B) Test 2 only
C) Tests 1 and 2 only
D) It cannot be determined from the given information.
(Medium-hard) For test 1, the median of the 24 complete grades is the average of the 12th and 13th grades, both of which are Bs, so the median score is B. For test 2, the median of the 23 complete grades is the 12th, which is an A. For test 3, the median of the 25 grades is the 13th, which is a B. For test 4, the median of the 22 complete scores is the average of the 11th and 12th, which are Bs, so the median is B. Therefore, the correct answer is B.
Lesson 12: Analyzing Relations with Tables
Tables as Pattern-Finding Tools
Tables are useful for analyzing functions because they can help you to generate graphs and to see important patterns. If you have an equation expressing y in terms of x, you can always make a table of ordered pairs to graph.
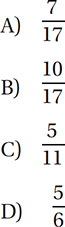
If you’re given a complicated function like

you can just pick values for x—like -3, -2, -1, 0, 1, 2, and 3—to plug into the function to make a table.
If you plot these points, an interesting pattern emerges.

It seems to be a straight line with a slope of ¼ and a y-intercept of 0—almost identical to the equation  . But there is a point missing at x = 1! Seeing patterns like this can help you to understand how functions behave and simplify a wide range of problems.
Bonus: Why does this graph seem linear, and why is one point missing?
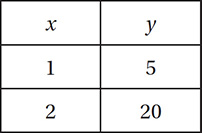
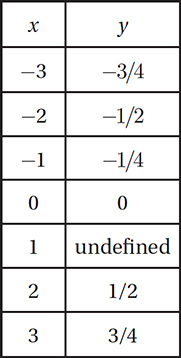
If the variables x and y in the table above have a linear relationship, what is the value of b ?
A) 19
B) 20
C) 21
D) 22
(Medium) In a linear relation, the change in y is proportional to the change in x. Using the points (2, 10) and (10, 34), we can see that the slope of the line is 24/8 = 3, so the slope of the line connecting (2, 10) and (5, b) must also be 3. If  , then b = 19, and the correct answer is A.
Exercise Set 4 (Calculator)

Questions 1–5 refer to the following information.
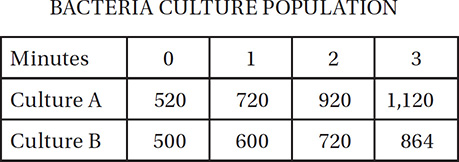
Which of the following equations best expresses the population, P, of bacteria culture A, as a function of t, in minutes?
A) P = 200t + 520
B) P = 520(1.4)t
C) P = 2,000(t - 0.5)2
D) P = 520t + 200
Which of the following equations best expresses the population, P, of bacteria culture B, as a function of t, in minutes?
A) P = 100t + 500
B) P = 500(1.2)t
C) P = 2,000(t - 0.5)2
D) P = 500t + 100
After 2 minutes, the population of culture A is what percent greater than the population of culture B?
A) 16.7%
B) 20.0%
C) 27.8%
D) 127.8%
If culture A continues to grow at a constant rate, at what time should its population reach 2,000?
A) 7 minutes 4 seconds
B) 7 minutes 24 seconds
C) 7 minutes 40 seconds
D) 8 minutes 20 seconds
By what percent did the population of culture B increase over the first 3 minutes?
A) 36.4%
B) 42.1%
C) 72.8%
D) 172.8%


Questions 6–9 refer to the following information.
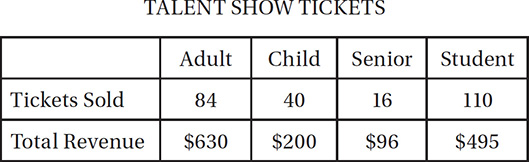
According to the table above, how much is the price of one senior ticket?
A) $4.00
B) $6.00
C) $12.00
D) $16.00
How much more is the cost of one adult ticket than the cost of one student ticket?
A) $0.50
B) $1.50
C) $2.50
D) $3.00
Which is closest to the average (arithmetic mean) price of the 250 tickets sold?
A) $5.54
B) $5.59
C) $5.68
D) $5.72
What is the median price of the 250 tickets sold?
A) $5.00
B) $5.50
C) $5.75
D) $6.00
If a meeting must take place on the third Tuesday of the month, what is the earliest date of the month on which it could take place?
A) the 14th
B) the 15th
C) the 22nd
D) the 27th
If a meeting must take place on the third Tuesday of the month, what is the latest date of the month on which the meeting could take place?
A) the 13th
B) the 14th
C) the 21st
D) the 26th
Questions 12–21 refer to the following information.
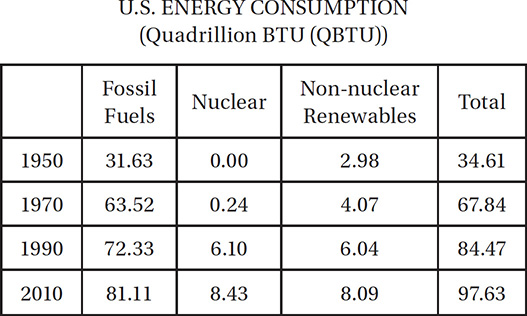
From 1970 to 1990, the percent increase in the U.S. consumption of nuclear energy was closest to
A) 96%
B) 240%
C) 2,400%
D) 3,400%
In a pie graph representing total U.S. energy consumption in 2010, the sector representing non-nuclear renewables would have a central angle measuring approximately
A) 8°
B) 12°
C) 24°
D) 30°
Nuclear energy and renewable energy are often grouped together in the category “non-greenhouse” energy. In 1970, approximately what percent of non-greenhouse energy was nuclear?
A) 0.4%
B) 5.6%
C) 5.9%
D) 6.4%
In 2010 what percent of non-greenhouse energy consumption was nuclear?
A) 9%
B) 29%
C) 49%
D) 51%
In the four years shown, what percent of the total energy consumed was due to non-nuclear renewables?
A) 5.6%
B) 6.8%
C) 7.4%
D) 7.9%
What was the percent increase in fossil fuel energy consumption between 1950 and 2010?
A) 28%
B) 61%
C) 124%
D) 156%
The “renewability index” is defined as the fraction of total U.S. energy consumption that comes from non-nuclear renewable energy. What was the percent increase in the renewability index from 1970 to 2010?
A) 17%
B) 37%
C) 47%
D) 99%
For how many of the years shown above did fossil fuels account for less than 90% of the annual U.S. energy consumption?
A) One
B) Two
C) Three
D) Four
Between 1950 and 2010, the average annual rate of increase in the consumption of non-nuclear renewable energy was closest to
A) 0.085 QBTU/yr
B) 0.128 QBTU/yr
C) 1.70 QBTU/yr
D) 2.27 QBTU/yr
Between 1970 and 2010, the annual consumption of fossil fuels in the U.S. increased nearly linearly. If this linear trend were to continue, which of the following is closest to the level of U.S. fossil fuel consumption we would expect for 2035 (in quadrillion BTUs)?
A) 90
B) 91
C) 92
D) 93
EXERCISE SET 4 ANSWER KEY
1. A According to the table, the population of culture A increases by 200 bacteria every minute, indicating a linear relationship with a slope of 200. (Remember that the slope of a function is equivalent to its unit rate of change.) Choice A is the only option that indicates a line with slope 200.
2. B The table indicates that culture B is not increasing linearly, since the population difference from minute to minute is not constant, but increasing. This rules out choices A and D. By substituting t = 0, t = 1 and t = 2, we can see that only the function in B gives the correct populations. Notice that the base of the exponential, 1.2, indicates that the population grows by 20% each minute.
3. C At the 2 minute mark, the populations are 920 and 720, respectively, so culture A has a population that is (920 - 720)/720 × 100% = 27.8% greater.
4. B If we use the population equation (see question 1), we can solve for t. Plugging in 2,000 for P gives us 2,000 = 200t + 520, which gives a solution of t = 7.4 minutes. Since 0.4 minutes equals 0.4 × 60 = 24 seconds, the time elapsed is 7 minutes 24 seconds.
5. C In the first 3 minutes, culture B grew from 500 to 864 bacteria, which is an increase of (864 - 500)/500 ´ 100% = 72.8%.
6. B The total revenue for each ticket type equals the price per ticket times the number of tickets sold. Therefore, the price for each senior ticket is $96 ÷ 16 = $6.
7. D One adult ticket costs $630 ÷ 84 = $7.50, and one student ticket costs $495 ÷ 110 = $4.50, so each adult ticket costs $3 more.
8. C The average price per ticket equals the total revenue for all tickets divided by the number of tickets: ($630 + $200 + $96 + $495)/250 = $5.684.
9. A The median price of 250 tickets is the average of the prices of the 125th and 126th tickets, if the price for each ticket is listed in increasing order. The ticket prices, in increasing order, are $4.50 for students (110 tickets), $5.00 for children (40 tickets), $6.00 for seniors (16 tickets), and $7.50 for adults (84 tickets). With this ordering, the 125th and 126th price are both $5.00.
10. B The earliest the first Tuesday could be is the 1st, so the earliest the third Tuesday could be is the 15th.
11. C The latest the first Tuesday could be is the 7th, so the latest the third Tuesday could be is the 21st.
12. C In 1970, nuclear energy consumption was 0.24, and in 1990 it was 6.10. This represents an increase of (6.10 - 0.24)/0.24 × 100% = 2,442%.
13. D In 2010, non-nuclear renewables accounted for 8.09/97.63 × 100% = 8.3% of consumption, which would correspond to a 0.083 × 360° = 29.88° central angle.
14. B In 1970, the total “non-greenhouse” energy was 0.24 + 4.07 = 4.31. Therefore the percent that was nuclear is 0.24/4.31 × 100% = 5.6%.
15. D In 2010, this percent was 8.43/(8.43 + 8.09) ´ 100% = 51%.
16. C The total non-nuclear renewable energy consumption for the four years is 2.98 + 4.07 + 6.04 + 8.09 = 21.18, and the total energy consumption is 34.61 + 67.84 + 84.47 + 97.63 = 284.55. Therefore the percent is 21.18/284.55 × 100% = 7.4%.
17. D In 1950, fossil fuel consumption was 31.63, and in 2010 it was 81.11. This is an increase of (81.11 - 31.63)/31.63 × 100% = 156%.
18. B In 1970, the renewability index was 4.07/67.84 = 0.060, and in 2010 it was 8.09/97.63 = 0.082. This is a percent increase of (0.082 - 0.060)/0.060 × 100% = 37%.
19. B In 1990, the percent of consumption from fossil fuels was 72.33/84.47 × 100% = 85.6%, and in 2010 it was 81.11/97.62 × 100% = 83.1%.
20. A The annual rate of increase is the total increase divided by the time span in years. The total increase is 8.09 - 2.98 = 5.11. Over a 60-year span, this gives a rate of 5.11/60 = 0.085.
21. C In the 40 year span from 1970 to 2010, fossil fuel consumption increased at a rate of (81.11 - 63.52)/40 = 0.44 QBTU/Yr. In 25 more years at this rate, the consumption should be 81.11 + 25(0.44) = 92.11 QBTU.
Lesson 13: Scatterplots
Scatterplots and Lines of Best Fit
Scatterplots are just graphs of ordered pairs of data. They can show relationships between variables that don’t vary in a highly predictable way.
A line of best fit is the line that “hugs” these points optimally, showing the basic relationship between the variables. On the SAT, you don’t need to calculate lines of best fit, but you may have to make inferences from them.
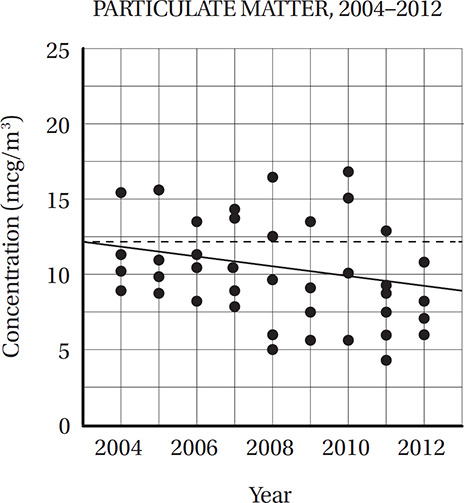
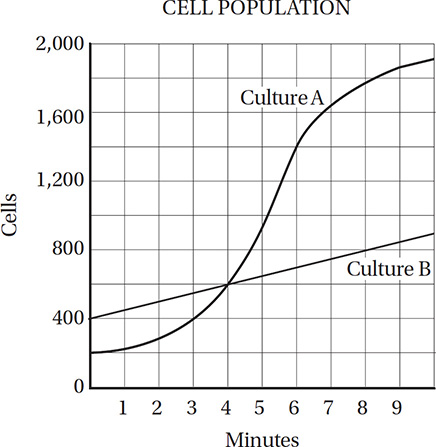
The scatterplot above shows 40 readings for particulate matter (a pollutant) concentration, in micrograms per cubic meter, in a metropolitan area over 9 years. Based on the line of best fit shown as a solid line, which is closest to the average yearly decrease in particulate matter concentration?
A) 0.32 mcg/m3 per year
B) 0.64 mcg/m3 per year
C) 3.2 mcg/m3 per year
D) 6.4 mcg/m3 per year
(Medium) The average yearly decrease in concentration is the slope of the line of best fit. The leftmost endpoint of the line is around (2003, 12), and the rightmost endpoint is around (2013, 9), so the slope is 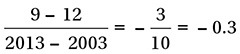 mcg/m3 per year, and the correct answer is A.
According to the line of best fit to the data above, which of the following is closest to the percent decrease in average particulate matter concentration from 2007 to 2012?
A) 9%
B) 18%
C) 36%
D) 60%
(Medium-hard) This question is similar to the previous one, but note the two important differences: first, it asks us to compare two specific years, and it asks us to calculate the percent decrease rather than the rate of decrease, so we need to use the percent change formula from Lesson 8. The line of best fit gives a value of about 11 in 2007 and about 9 in 2012. Therefore, the percent change is 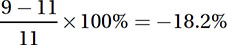 , and the correct answer is B.
If the Environmental Protection Agency’s air quality standard is 12 micrograms of particulate matter per cubic meter, as shown with the dotted line, what percent of these points fall above this standard?
A) 11.0%
B) 25.0%
C) 27.0%
D) 35.0%
(Easy) This question is just asking for a part-to-whole ratio expressed as a percentage. There are 40 total data points and 11 of them lie above the line: , so the correct answer is C.
Lesson 14: Nonlinear Relationships
Analyzing Graphs of Curves
Even if a graph is not linear, you should still be able to draw inferences based on the points on that graph. You should also be able to compare the properties of multiple graphs.
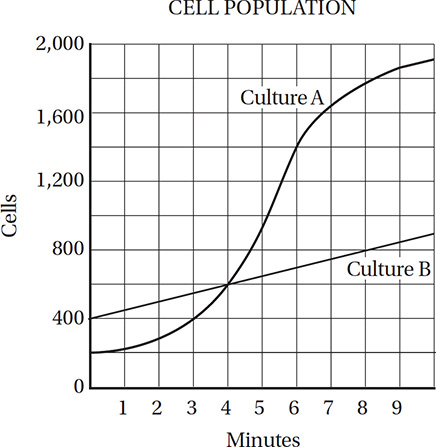
The graph above shows the number of cells in two separate bacterial cultures as a function of time. How much time elapsed between when the two cultures had equal population and when the population of culture A was twice that of culture B?
A) 2 minutes
B) 3 minutes
C) 4 minutes
D) 5 minutes
(Medium) The two populations are equal when the two curves intersect, at the 4-minute mark. The answer choices tell us where to look next on the graph. Two minutes later, at the 6-minute mark, culture B has a population of 700 and culture A has a population of 1,400, which is twice as great, and so the correct answer is A.
How much longer did it take culture B than culture A to double its original population?
A) 2 minutes
B) 3 minutes
C) 4 minutes
D) 5 minutes
(Medium) Culture A has a starting population of 200 and doubles its population to 400 at the 3-minute mark. Culture B has a starting population of 400 and doubles its population to 800 at the 8-minute mark. Therefore, culture B took 8 − 3 = 5 more minutes to double its population, and the correct answer is D.
Lesson 15: Drawing Inferences from Graphs
Analyzing Rates with Graphs
When analyzing graphs with respect to time, it sometimes helps to find the average rate of change over an interval of time (the slope of the secant line segment joining two points on the graph), or the instantaneous rate of growth (or decline) at a point in time (the slope of the tangent line to the curve at that point).
If culture B were to continue its linear growth, how many more minutes beyond the 10-minute mark shown in the graph would be required for culture B to reach 1,500 cells?
A) 9 minutes
B) 12 minutes
C) 13.5 minutes
D) 15 minutes
(Medium) By taking any two points on the line for culture B, for instance (0, 400) and (4, 600), we can calculate the slope of the line, which equals the unit rate of growth:  cells per minute. Since culture B contains 900 cells at the 10-minute mark, it would need to grow by 1500 –900 = 600 cells, which would take 600/50 = 12 more minutes to reach 1,500 cells, and so the correct answer is B.
An experiment requires that culture A and culture B have between 400 and 800 cells each. The time period in which the cell population for both cultures is within this range is called the “experimental window.” Which of the following is closest to the experimental window for the two cultures shown in the graph above?
A) 95 seconds
B) 120 seconds
C) 165 seconds
D) 240 seconds
(Medium-hard) The “experimental window” is the period when both populations are between 400 and 800. The population of culture A hits 400 at the 3-minute mark and exceeds 800 cells after roughly the 4.6-minute mark. The population of culture B starts at 400 cells and exceeds 800 cells after the 8-minute mark. The overlapping period is between 3 minutes and 4.6 minutes, for a period of roughly 1.6 minutes or 1.6 × 60 = 96 seconds; therefore, the correct answer is A.
Lesson 16: Pie Graphs
The Pie Graph Formula
The SAT might ask you to analyze the features of pie graphs in some detail, or to discuss the features of a hypothetical pie graph. When analyzing pie graphs, remember this helpful formula:

In the diagram above, which of the following is closest to the measure of the central angle of the sector representing total minority ownership of U.S. broadcast television media in 2007?
A) 3°
B) 8°
C) 12°
D) 15°
(Easy) According to the graphic, the total minority ownership of television media in 2007 was 0.6% + 1.3% + 0.9% + 0.4% = 3.2%. Therefore, the central angle of the sector representing this portion measures 0.032 × 360° = 11.52°, so the correct answer is C.
Maria is constructing a pie graph to represent the expenses for her project. Here, expenses fall into three categories: marketing, design, and development. She knows that the marketing expenses are $12,000 and the design expenses are $30,000, but the development expense could range anywhere from $30,000 to $48,000. Based on this information, which of the following could be the measure of the central angle of the sector representing marketing expenses?
A) 45°
B) 54°
C) 62°
D) 65°
(Medium-hard) The marketing expenses are fixed at $12,000, but the total expenses could range from $12,000 + $30,000 + $30,000 = $72,000 to $12,000 + $30,000 + $48,000 = $90,000. This means that the part-to-whole ratio for marketing could range from 12,000/90,000 = 0.133 to 12,000/72,000 = 0.167. Therefore, the central angle for the marketing sector can measure anywhere from 0.133 × 360° = 48° to 0.167 × 360° = 60°. The only answer in this range is choice B, 54°.
Exercise Set 5 (Calculator)
Questions 1–4 refer to the following information.
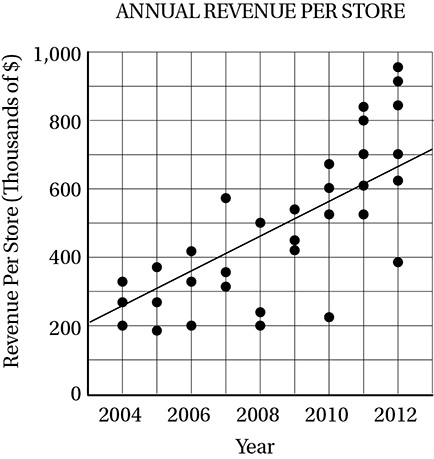
The scatterplot above shows the annual revenue for all of the individual retail stores operated by a clothing company for each year from 2004 through 2012. Based on the line of best fit to the data shown, which of the following is closest to the percent increase in revenue per store from 2005 to 2012?
A) 50%
B) 100%
C) 120%
D) 300%
In 2006, the total combined revenue for all stores was closest to
A) $350,000
B) $480,000
C) $700,000
D) $950,000
From 2009 to 2010, the total combined revenue for all stores increased by approximately
A) $50,000
B) $200,000
C) $400,000
D) $600,000
Between 2006 and 2012, what was the percent increase in the total number of retail stores for this company?
A) 45%
B) 50%
C) 100%
D) 200%
Questions 5–9 refer to the following information.

The chart above shows the allocation of $3.5 trillion in U.S. federal expenses for 2010. What were the total 2010 expenditures on Defense?
A) $700 billion
B) $70 billion
C) $7 billion
D) $700 million
What is the measure of the central angle for the sector representing Medicare expenses?
A) 13.0°
B) 45.5°
C) 46.8°
D) 48.2°
If Interest on National Debt expenses were to decrease by $20 billion from their 2010 levels, this would represent a percent decrease of approximately
A) 6%
B) 10%
C) 12%
D) 15%
How much more did the United States spend in 2010 on Interest on National Debt than on Education?
A) $2 billion
B) $7.0 billion
C) $20 billion
D) $70 billion
If 50% of the budget for Federal Pensions were to be reallocated as Social Security expenses, the size of the Social Security budget would increase by what percent?
A) 1.75%
B) 8.75%
C) 17.75%
D) 21.75%
Questions 10–17 refer to the following information.
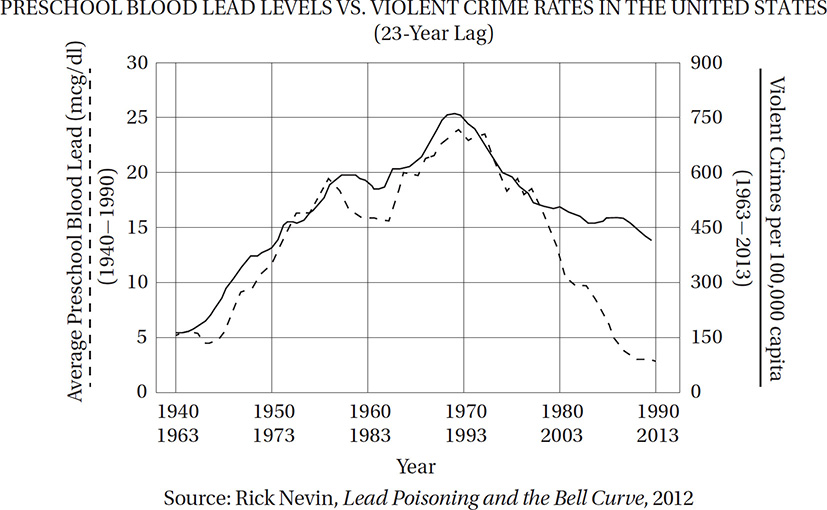
According to the graph above, in 1970 the number of violent crimes per 100,000 capita in the United States was closest to
A) 25
B) 375
C) 700
D) 750
In 1970 the average preschool blood lead level, in mcg/dL, was closest to
A) 10
B) 12
C) 23
D) 25
The percent decline in violent crime from 1993 to 2013 is closest to
A) 11%
B) 35%
C) 47%
D) 88%
From 1970 to 1990, the average annual rate of decline in preschool blood lead levels, in mcg/dL per year, was approximately
A) 1
B) 5
C) 15
D) 17
Which of the following 10-year spans saw the greatest percent increase in preschool blood lead levels?
A) 1945–1955
B) 1955–1965
C) 1965–1975
D) 1975–1985
Which of the following five-year spans saw the greatest percent increase in violent crime?
A) 1963–1968
B) 1968–1973
C) 1973–1978
D) 1978–1983
Approximately how many years did it take for average preschool blood lead levels to return to their 1950 levels?
A) 25
B) 30
C) 35
D) 40
For approximately how many years between 1963 and 2013 was the violent crime rate in the United States greater than 375 crimes per 100,000 capita?
A) 25
B) 30
C) 37
D) 42
EXERCISE SET 5 ANSWER KEY
1. C In 2005, the revenue per store, according to the line of best fit, was about $300,000, and in 2012 it was about $650,000, so the percent change is (650,000 - 300,000)/300,000 × 100% = 116.67%, which is closest to (C) 120%.
2. D In 2006, the data points show that there were 3 stores, with revenue of roughly $200,000, $330,000, and $420,000, for a total of $950,000.
3. D In 2009, the combined revenue for the three stores was approximately $420,000 + $450,000 + $550,000 = $1,420,000. In 2010, the combined revenue for four stores was approximately $220,000 + $520,000 + $600,000 + $675,000 = $2,015,000, for an increase of about $595,000.
4. C In 2006 there were 3 stores and in 2012 there were 6 stores, which is an increase of (6 - 3)/3 × 100% = 100%.
5. A The chart shows that 20% of the expense budget went to defense, which equals 0.2 × $3,500,000,000,000 = $700 billion.
6. C Medicare accounts for 13% of expenses, so the sector angle is 0.13 × 360° = 46.8°.
7. B The Interest on National Debt in 2010 was 0.057 × $3.5 trillion = $199.5 billion, so a decrease of $20 billion would be 20/199.5 × 100% = 10%.
8. D The difference between Interest on National Debt and Education is 5.7% - 3.7% = 2%, and 0.02 × $3.5 trillion = $70 billion.
9. B The Social Security budget in 2010 was 0.20 ´ $3.5 trillion = $700 billion. 50% of the Federal Pensions budget is 0.5 × 0.035 × $3.5 billion = $61.25 billion. This would be an increase of 61.25/700 × 100% = 8.75%.
10. B The vertical axis label on the left shows that the violent crime trend is indicated by the solid curve and the bottom time series (1963–2013). For this curve, 1970 is slightly to the left of the vertical line at 1973, which shows values clearly between 300 and 450.
11. C The vertical axis label on the left shows that the preschool blood lead trend is indicated by the dashed curve and the top time series (1940–1990).
12. C In 1993, the violent crime rate was 750, and in 2013 it was about 400. The percent decrease is therefore (400 - 750)/750 × 100% = 46.7%.
13. A In 1970, the blood lead levels were about 23 and in 1990, they were about 3. The rate of decline is therefore (23 - 3)/(1990 - 1970) = 1 mcg/dL per year.
14. A From 1945–1955 preschool blood lead levels increased from about 5 to about 17, a percent increase of (17 - 5)/5 × 100% = 240%.
15. A The question asks for the greatest percent increase, not the greatest net increase in violent crime. Notice that the net increase from 1963–1968 (from roughly 150 to 250) seems to be slightly less than net increase from 1968–1973 (from roughly 250 to 375), so the percent increase from 1963–1968 (+67%) is clearly greater than that from 1968–1973 (+50%).
16. B In 1950, blood lead levels were about 12 mcg/dL, and they did not return to this level until 1980.
17. D The graph indicates that from about 1970 to 2013, the violent crime rate was above 375 crimes per 100,000 capita.