Chapter 2
Freshwater and Drought on Pacific Islands
COORDINATING LEAD AUTHORS
Victoria W. Keener (East-West Center, Pacific RISA), Scot K. Izuka (USGS PIWSC), Stephen Anthony (USGS PIWSC)
CASE STUDY CONTRIBUTORS*
Stephen Anthony (USGS PIWSC), Victoria W. Keener (East-West Center, Pacific RISA), Jonathan L. Scheuer (Consultant), Richard Wallsgrove (ICAP, University of Hawai’i at Mānoa)
CONTRIBUTORS*
Hanna Annamalai (IPRC, University of Hawai’i at Mānoa), Ryan Bailey (Colorado State University), Tim Brown (WRCC, DRI), Jeff Burgett (PICCC), Yi-Leng Chen (IPRC, University of Hawai’i at Mānoa), Pao-Shin Chu (University of Hawai’i at Mānoa), Kati Corlew (East-West Center, Pacific RISA), Paula Cutillo (NPS), Henry F. Diaz (CIRES, University of Colorado-Boulder), Aly El-Kadi (WRRC, University of Hawai’i at Mānoa), Oliver Elison Timm (IPRC, University of Hawai’i at Mānoa), Stanton Enomoto (PICCC), Melissa L. Finucane (East-West Center, Pacific RISA), Charles Fletcher (SOEST, University of Hawai’i at Mānoa), Lucas Fortini (PICCC), Abby Frazier (University of Hawai’i at Mānoa), Thomas Giambelluca (University of Hawai’i at Mānoa), Kevin Hamilton (IPRC, University of Hawai’i at Mānoa), John Jenson (University of Guam, WERI), Kevin Kodama (Honolulu WFO), Dawn Kotowicz (NOAA), Michael Kruk (NOAA), Kenneth E. Kunkel (NOAA NCDC, North Carolina State University), Mark Lander (University of Guam, WERI), Chester Lao (Honolulu Board of Water Supply, retired), Nancy Lewis (East-West Center), Alan Mair (WRRC, University of Hawai’i at Mānoa), John J. Marra (NOAA NCDC), Lisa D. Miller (USGS PIWSC), Rachel L. Miller (East-West Center, Pacific RISA), Delwyn Oki (USGS PIWSC), Margaret H. Smith (East-West Center), Deanna Spooner (PICCC), Mark Stege (Asian Development Bank), Adam Stein (NOAA PSC), Sharla Stevenson (NPS, Colorado State University), William V. Sweet (NOAA COOPS)
*LISTED IN ALPHABETICAL ORDER
This Chapter should be cited as:
Keener, V. W., Izuka, S. K., & Anthony, S. (2012). Freshwater and Drought on Pacific Islands. In V. W. Keener, J. J. Marra, M. L. Finucane, D. Spooner, & M. H. Smith (Eds.), Climate Change and Pacific Islands: Indicators and Impacts. Report for the 2012 Pacific Islands Regional Climate Assessment (PIRCA). Washington, DC: Island Press.
Freshwater resources are essential not only for human consumption but also for the agricultural, industrial, and economic health of the Pacific Islands region. Freshwater on the Pacific Islands includes groundwater, surface water, and rainwater catchment, but because islands are small and surrounded by oceans, these resources are limited. Alternatives such as desalination plants are non-existent or currently infeasible on a large scale. Generally, the smaller the island, the smaller and more vulnerable are its water resources. Maintaining an adequate freshwater supply in the Pacific Island environments is of critical concern as climate change places stresses of uncertain magnitude on already fragile resources. To ensure that Pacific Island communities maintain plentiful freshwater supplies during uncertain future climate conditions, it is necessary to understand and integrate historical trends, current conditions, and projections of future hydrological variables in the three sub-regions. The theme of this chapter focuses on historical trends in regional freshwater resources.
On larger islands, such as those in Hawai’i, American Sāmoa, and Guam, ground-water is the primary source of drinking water. It is susceptible to changes in precipitation and sea level and is affected by changes in evapotranspiration (water moving into the atmosphere through evaporation and plant transpiration). Groundwater is also vulnerable to over-pumping, contamination, and saltwater intrusion. The availability of surface water, which is used for agriculture and to supplement drinking water, is also sensitive to changes in precipitation, evapotranspiration, and changes in land cover. On smaller islands, such as the tiny low-lying islands of atolls, groundwater and surface-water resources are extremely limited and the populations must rely on a combination of rainwater catchment and groundwater for most of their drinking water. Freshwater wetlands are also the primary environment in which taro is grown, a food staple on many low islands. At only a few feet above sea level, low islands are also more vulnerable to sea-level rise, wave over-wash, and saltwater intrusion.
Freshwater hydrology overview
Most islands in the Pacific Islands region can be categorized as either “high islands,” which can have peak altitudes as high as 14,000 feet above sea level, or “low islands,” most of which are no more than a few tens of feet above sea level. Height above sea level affects an island’s interaction with the surrounding ocean and atmosphere and ultimately determines the nature and reliability of the island’s water resources. Precipitation is the source of all freshwater on the Pacific Islands. Precipitation that falls on the land can run off the surf ace into the ocean via streams, return to the atmosphere through evapotranspiration, or recharge groundwater (Figure 2-1). Among oceanic islands, fresh groundwater forms a lens-shaped body that overlies denser saltwater from the ocean; between the freshwater lens and the underlying saltwater is a brackish transition zone. Fresh groundwater can also occur on high volcanic islands as high-level groundwater impounded by low-permeability geologic structures, such as volcanic dikes, ash layers, and massive lava flows (Hunt, 1996).
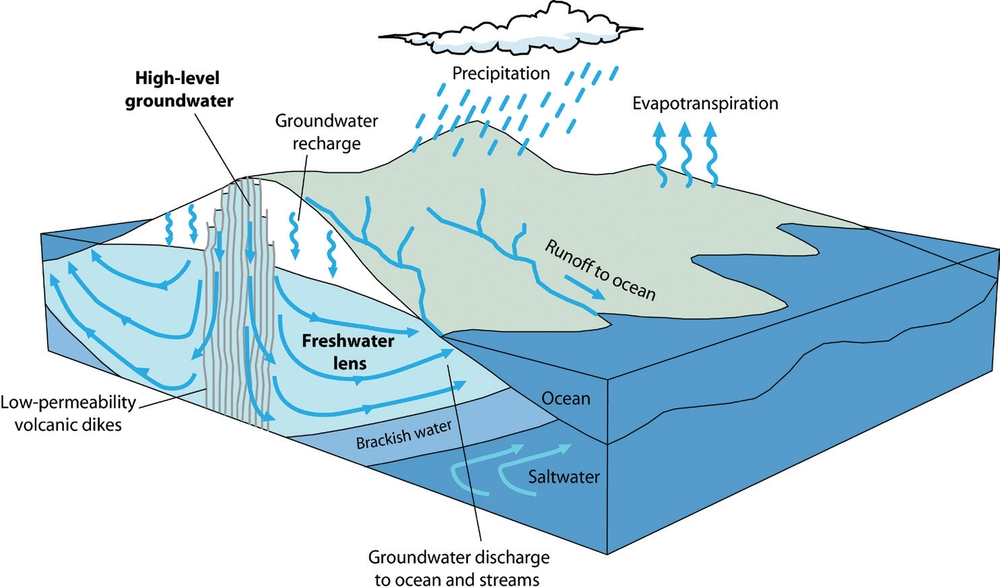
Figure 2-1 Cross section of regional hydrological processes. Precipitation is the source of both surface water, such as streams, and groundwater on Pacific Islands. Variations in precipitation and evapotranspiration rates therefore affect both resources. Surface water is important for human use and provides habitats for fragile ecosystems. Groundwater in islands exists as a freshwater lens underlain by saltwater, and on high volcanic islands it may also exist as high-level groundwater. Groundwater is a principal source of drinking water on high islands. (Modified from Izuka, 2011.)
Groundwater naturally flows toward the coast, where it discharges from lowland springs, streams, and submarine seeps (Figure 2-1). On average, the amount of ground-water recharge is balanced by groundwater discharge, but droughts or unusually wet periods can result in short-term imbalances that cause the freshwater lens to shrink or grow. Climate variation and change thus affect not only surface-water resources, such as streams and lakes, but also groundwater resources.
High islands
On high islands, rainfall is enhanced by the orographic effect. Winds carrying warm, moisture-laden air from the ocean are driven upward as they encounter the island’s mountains. The rising air is cooled and the condensing moisture causes rain and cloud formation (Figure 2-2). As a result of the orographic effect, rainfall on some high islands can be much higher than that of the surrounding ocean. The amount of rain can vary dramatically across the landscapes of high islands, with much higher rainfall on windward-facing mountain slopes than on leeward lowlands. On the highest mountains in Hawai’i, air reaches the trade wind inversion (TWI) layer, within which air is warmer above than below, an arrangement that effectively halts rising air and cloud development (Nullet & Giambelluca, 1990; Cao et al., 2007) (Figure 2-2). Rainfall is scant above the TWI level. Other forms of precipitation on high islands include fog drip in middle-elevation slopes, and snow, hail, and freezing rain on the highest peaks.
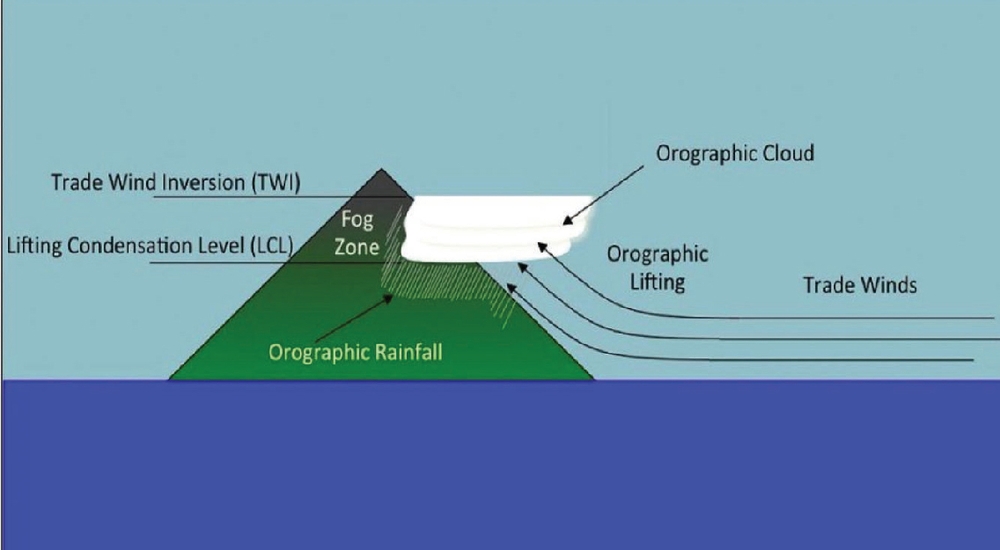
Figure 2-2 Depiction of the orographic effect. The amount and location of rainfall in Hawai’i and other high islands is strongly controlled by orographic processes. As warm air approaches a mountain range, it rises, cools, and condenses in orographic clouds, causing rainfall. On very high mountains in Hawai’i, as the cooled air continues to rise, it reaches the trade wind inversion layer, at which point the air again warms, and above which there is little to no precipitation. (From Giambelluca et al., 2011.)
Surface runoff on high islands is channeled into streams in valleys and gulches carved into the mountains by erosion. Groundwater exists in freshwater lenses typical of islands but may also exist as high-level groundwater (Figure 2-1). Groundwater is often the main source of drinking water on high islands; surface water from streams is used for agriculture and to supplement drinking water, but it is also important for ecosystems, culture, recreation, and aesthetics.
Low islands
Low islands include atoll islands and other islands that rise only a few feet above sea level. Unlike the high islands, the low islands do not have sufficient altitude to generate orographic rainfall; therefore, precipitation on these islands is similar to that of the surrounding ocean. Low islands are much more vulnerable to variations or trends in precipitation patterns (especially drought) as they lack the amount of land mass needed for significant hydrological storage and are spatially isolated from other sources of water. Many low islands in the Pacific have a dual-layer aquifer that limits the thickness of the freshwater lens (Bailey & Jenson, 2011). Most low islands do not have streams, and residents are dependent on small, fragile freshwater-lens systems and rainfall catchments for their drinking water. During periods of low rainfall, however, rainfall catchment supplies become depleted and residents commonly rely solely on groundwater from the freshwater lens.
Most low islands in the Pacific have a dry season with a duration that increases with distance from the equator (Lander & Guard, 2003; Lander & Khosrowpanah, 2004; Lander, 1994, 2004). Droughts increase demand on low islands’ limited freshwater resources, while sea-level rise, intense storms, and extreme tides threaten water quality and local agriculture, making these communities some of the most sensitive to climate-induced changes in water supply.
Historic and current trends
To fully assess the impact of climate variability and change and accurately predict future conditions in each sub-region, it is necessary to understand current and historic trends in climate and hydrologic records. For each sub-region, trends in observed data are discussed for four general types of records: (1) air temperature, (2) precipitation, (3) extreme precipitation, and (4) streamflow and groundwater. Records such as temperature and rainfall are direct indicators of trends in climate. From these basic records, information on extreme precipitation events such as droughts or large storms can be extracted to provide important insight on how climate change can affect water resources. A common measure for drought is consecutive dry days (CDDs). Measures for extremely high precipitation include the frequency of high- and moderate-intensity rainfall events, the frequency of typhoons and other storms, and the total rainfall over a specified number of consecutive rainy days.
Trends in streamflow records offer a means to assess the impact of climate change on water resources. Streamflow includes water from precipitation that runs directly off the land surface as well as water that discharges from groundwater. The groundwater component of streamflow is known as base flow. Trends in total streamflow primarily reflect trends in surface-runoff rates, whereas base-flow trends reflect changes in groundwater recharge and storage. Trends in the number of extreme high-flow days that occur each year reflect trends in storm frequency, whereas trends in the number of extreme low-flow days reflect trends in drought frequency. Examination of trends in streamflow thus offers a means to assess the impact of climate variability and change on both surface-water and groundwater resources.
Central North Pacific: Hawai’i
AIR TEMPERATURE. Generally, air temperature has increased significantly throughout the State of Hawai’i at both high and low elevations over the last century (Giambelluca et al., 2008). From 1919 to 2006, average temperature for all stations in Hawai’i increased by 0.04°C (0.08°F) per decade (Figure 2-3). The rate of warming accelerated to 0.16°C (0.30°F) per decade from 1975 to 2006 (Giambelluca et al., 2008). The rate of increasing temperature from 1975 to 2006 is greater at high-elevation stations (0.27°C or 0.48°F per decade at greater than 0.5 miles or 800 meters above sea level) (Figure 2-3) and has been documented on the ecologically sensitive peaks of Haleakalā and Mauna Loa on Maui and Hawai’i Island, respectively, where the annual number of below-freezing days has decreased between 1958 and 2009 (Giambelluca et al., 2008; Diaz et al., 2011).
Much of the temperature variation prior to 1975 in Hawai’i appears to have been tightly linked with the Pacific Decadal Oscillation (PDO) (Giambelluca et al., 2008). Since 1975, however, air temperature in Hawai’i has risen at a faster rate that cannot be explained by the PDO (Figure 2-4) and may indicate the increased influence of global warming (Giambelluca et al., 2008). An increase in the frequency of occurrence of the TWI over Hawai’i since the late 1970s (Cao et al., 2007) is consistent with continued warming and drying trends throughout Hawai’i, especially for high elevations. The frequency of occurrence of the TWI over Hawai’i Island and Kaua’i increased during the 1990s from less than 80% to around 90% of the time (Cao et al., 2007).
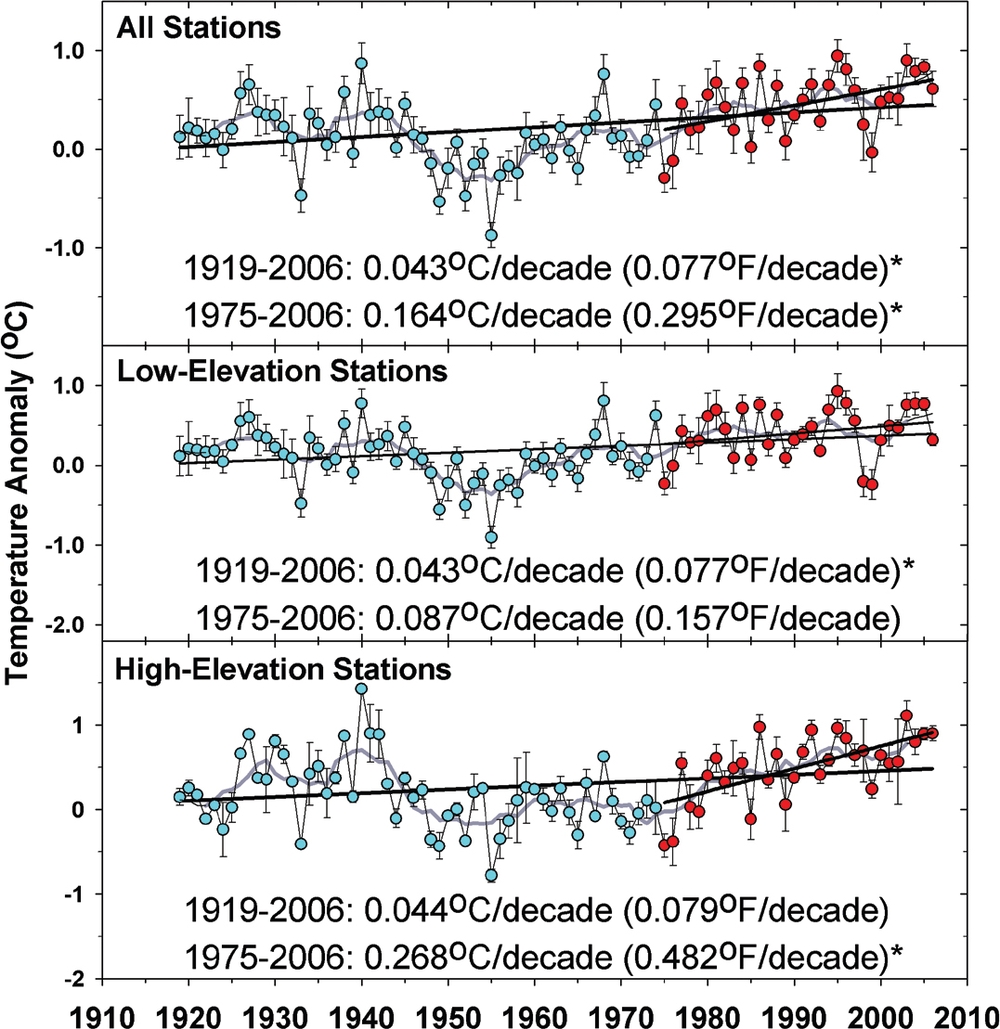
Figure 2-3 Annual average surface temperature anomalies are increasing at both high- and low-elevation stations in Hawai’i (a total of 21). Temperature anomalies are calculated first as the departure from the monthly mean and then averaged into a calendar year. Anomalies greater than zero indicate temperatures that are above average, while anomalies less than zero indicate below-average temperatures. A seven-year running-mean filter (curved line) has been applied to the data to create a smoothed trend curve (black line). Linear trends have been computed for two periods, 1919–2006 and 1975–2006, where the latter period shows the observed enhanced warming. The steeper warming trend in high-elevation stations (>800 meters or >0.5 mile) is visible in the bottom panel, especially when compared to that of the low-elevation stations in the middle panel (<800 meters or <0.5 mile). Error bars show a standard deviation of +0.5. Asterisks indicate slopes significant at p = 0.05. (© 2008 American Geophysical Union. Reproduced/modified from Giambelluca et al. [2008]) by permission of American Geophysical Union.)
PRECIPITATION. In Hawai’i, precipitation can manifest as rainfall, fog, hail, and snow. Mean annual precipitation over the state is highly variable, from 200 mm (about 8 inches) near the summit of Mauna Kea to over 10,000 mm (about 400 inches) on the windward slope of Haleakalā, Maui, and can differ substantially between windward and leeward sides of each island (Giambelluca et al., 2011). The dry summer season lasts from May to October, while the winter rainy season extends from November to April. Although precipitation varies from one area of an island to another, a general downward trend in amount statewide over the last century has been documented, and an even steeper decline is evident since 1980 (Figure 2-5) (Oki, 2004; Chu & Chen, 2005; Diaz et al., 2005, 2011; Giambelluca et al., 2011; Elison Timm et al., 2011). This decline in rainfall and corresponding increased rate of warming at high elevations since 1975 is consistent with an increase in the frequency of occurrence of the TWI (Cao et al., 2007; Diaz et al., 2011).

Figure 2-4 TOP PANEL—Air Temperature in Hawai’i (red line) prior to 1975 is tightly coupled to the Pacific Decadal Oscillation (PDO) (blue line). Since 1975, air temperature (red line) has diverged increasingly from the observed PDO, which may indicate the increasing influence of climate change in the Central North Pacific sub-region. BOTTOM PANEL—Local sea-surface temperature anomalies (blue line) for 22°N, 156°W based on the Extended Reconstructed Sea-Surface Temperatures (ERSST) data set (Smith & Reynolds, 2004) are also coupled to air temperatures (red line) in Hawai’i and show a similar decoupling around 1975. (©2008 American Geophysical Union. Reproduced/modified from Giambelluca et al. [2008] by permission of American Geophysical Union.)
Precipitation variability in Hawai’i is also strongly affected by ENSO and the PDO. ENSO-scale patterns affect interannual variability, such as El Niño events’ strong association with dry winter conditions, whereas the PDO affects interdecadal variability (Chu & Chen, 2005). After air temperature and PDO diverged in 1975, initial evidence suggests that precipitation trends are following the same pattern of decoupling (Frazier et al., 2011). Climate change can affect ENSO and PDO patterns; this introduces greater uncertainty into predictions of future precipitation in Hawai’i.
EXTREMES IN PRECIPITATION. To reduce uncertainty in predicting future shifts in regional extreme precipitation, research has improved understanding of historic trends in extreme precipitation and drought on the Hawaiian Islands. Precipitation can be measured both in relative intensity and in probability of occurrence, amount, and total amount over consecutive rainy days. Throughout the state, trends indicate fewer extremely high rainfall events: comparing data from the period of 1950–1979 with data from the period of 1980–2011 shows a significant decrease in the frequency of moderate-and high-intensity precipitation events and a corresponding increase in low-intensity events (Chu et al., 2010). Not surprisingly, individual islands show different trends. In terms of extreme storms, the Central North Pacific region may have entered a period of fewer annual tropical cyclones since the mid-1990s (Chu, 2002) (Figure 2-6). All the major Hawaiian Islands have shown a propensity toward longer dry periods, with an increasing annual maximum number of consecutive dry days from the period of 1950–1970 to 1980–2011 (Chu et al., 2010) (Figure 2-7).

Figure 2-5 Annual normalized and dimensionless (July to June) time series of the Hawai’i Rainfall Index (HRI) from 1905 to 2010. As shown in the plot, the trend for the first epoch (1905–1979) is basically flat, while for the second epoch (1980–2009) the decreasing trend is apparent. Nine stations each from Kaua’i, O’ahu, and Hawai’i are used. These 27 stations represent the spatial variability of rainfall with regard to trade wind exposure and elevation. (Updated from Chu & Chen, 2005.)

Figure 2-6 Time series of tropical cyclones (tropical storms and hurricanes) in the Central North Pacific basin from 1966 to 2010. Although a period of greater tropical cyclone activity occurred from the 1980s to the mid-1990s, the basin has again entered a quieter period, with fewer average annual occurrences of storms. Broken lines denote the means for the periods 1966–1981, 1982–1994, and 1995–2010. (Modified and updated from Chu, 2002.)
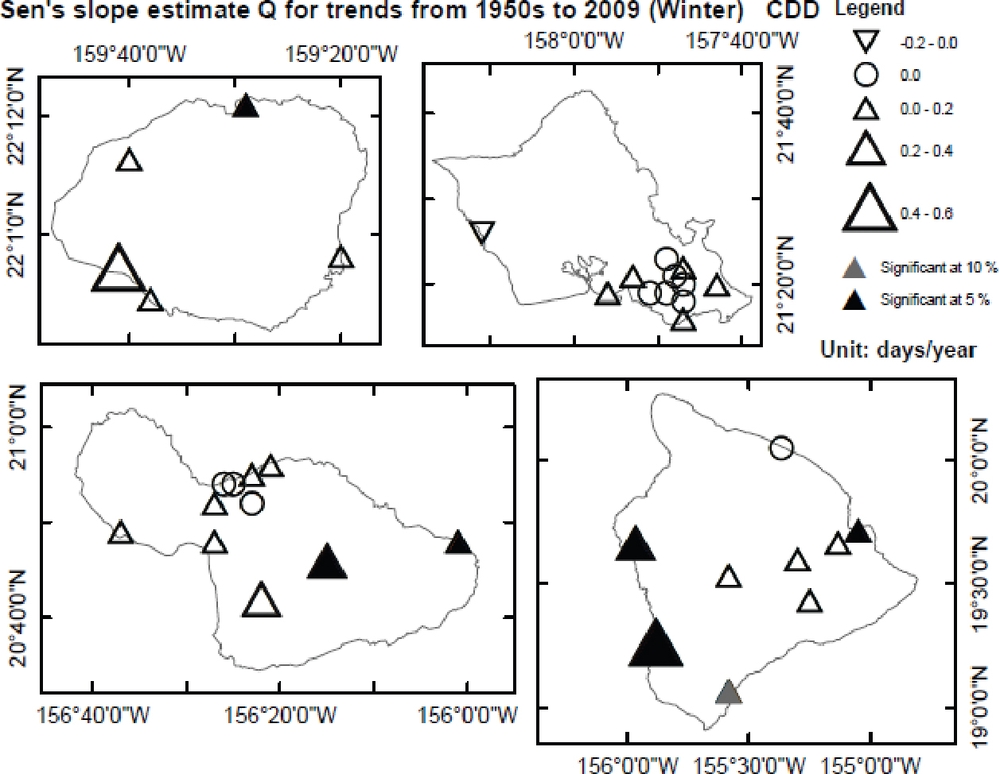
Figure 2-7 All four major Hawaiian Islands (O’ahu, Kaua’i, Maui, and Hawai’i Island) have experienced increasing winter drought severity since the 1950s, defined by a longer annual maximum number of consecutive dry days. Upward triangles denote the increasing drought trends, while downward triangles indicate decreasing trends. Black triangles are significant at the 5% level, and gray at the 10% level. (From Chu et al. [2010] by permission of American Meteorological Society.)
STREAMFLOW AND GROUNDWATER. Streamflow gauges have been operated for nearly a century in Hawai’i with nine stream gauges of nearly continuous record since 1913. These long-term gauges are located on Kaua’i, O’ahu, Moloka’i, and Maui, in both windward and leeward basins and in areas that are unaffected by artificial diversions, reservoirs, or pumping from wells. Eight of the nine gauges show statistically significant downward trends in base flow (the groundwater contribution to streamflow) from 1913 to 2008 (Oki, 2004; Bassiouni & Oki, 2012) (Figure 2-8). Over the last century, the downward trends indicate declines in the long-term mean base flow of 20% to 70%. Short-term cyclic patterns corresponding with ENSO and PDO cycles are superimposed on the downward base flow trends, but these cycles are not the cause of the overall downward base flow trend observed since 1913. The causes of the long-term base flow decline are related to long-term changes in rainfall and possibly evapotranspiration and their relationship to groundwater recharge. In addition, the impact of invasive tree species on streamflow remains largely unknown in Hawaiian forests.
The downward trend in base flow coincides with the statistically significant downward trend in rainfall measured in Hawai’i since 1905 (Chu & Chen, 2005; Diaz et al., 2011; Kruk & Levinson, 2008). The number of days per year with extremely low flow also shows a statistically significant upward trend at most gauges, which is consistent with an upward trend in drought occurrence since the 1950s (Chu et al., 2010). Base flow also may be reduced by processes related to groundwater recharge, such as evapotranspiration (Bassiouni & Oki, 2012). The downward trends in base flows indicate a decrease in groundwater discharge to streams, which implies a decline in groundwater recharge and storage. This has serious implications for Hawai’i’s domestic drinking-water supply, 99 percent of which comes from groundwater (Gingerich & Oki, 2000).

Figure 2-8 Base Flow at eight out of nine long-term streamflow gauges in Hawai’i shows significant decreases of 20% to 70% over the past 100 years. This download trend is consistent with significant decreases in rainfall in Hawai’i. Because base flow comes from grounwater, decreasing base flow indicates decreasing groundwater resources; this has serious implications for Hawai’i, where 99% of drinking water comes from groundwater (Oki, 2004; Bassiouni & Oki, 2012). (From Oki, 2004.)
Box 2-1
The Hawai’i Water Code: Providing a strong basis for management and planning
In the Hawai’i State Constitution, all public natural resources are held in trust by the State for the people, but only one gets its own section—freshwater. Article XI, Section 7, mandates the creation of “a water resources agency” with broad responsibilities:
The State has an obligation to protect, control and regulate the use of Hawai’i’s water resources for the benefit of its people. The legislature shall provide for a water resources agency which, as provided by law, shall set overall water conservation, quality and use policies; define beneficial and reasonable uses; protect ground and surface water resources, watersheds and natural stream environments; establish criteria for water use priorities while assuring appurtenant rights and existing correlative and riparian uses and establish procedures for regulating all uses of Hawai’i’s water resources.
The Hawai’i Water Code and Water Commission were established in 1987 to fulfill these constitutional requirements. In addition, the Constitution requires that the Water Code and Commission should settle water-related disputes while protecting traditional cultural rights of Native Hawaiians and the right of every citizen to a clean, healthy environment.
By including language that calls for integrated management of water resources, forward-looking and proactive policy, continuous monitoring, and preservation and enhancement of natural systems, the Water Code is written with inherent adaptive characteristics (Wallsgrove & Penn, 2012). By definition, adapting to climate change requires this type of forward-looking and multi-disciplinary approach. Thus, the law and policy framework for water resource management in Hawai’i may be well poised to respond quickly to the facts of changing local climates. With appropriate funding, staffing, and support, these adaptive characteristics could allow the Commission and policymakers in Hawai’i to create a management regime that is well-suited to reflect the most recent advances in scientific understanding, as well as political and economic conditions, while protecting a crucial natural resource for current and future residents of Hawai’i.
Total streamflow at most gauges showed no significant trend (Oki, 2004). Trends in total streamflow may be obscured by high year-to-year rainfall variability, whereas in the base flow record, this variability is filtered out by the groundwater system.
Box 2-2
High-quality data and monitoring networks are threatened
The continuous collection and storage of hydrological, ecological, and climatological data in the Pacific Islands region is of utmost importance to science and society. As impacts of climate variability and change are observed, long-term records of land and ocean variables can help us identify shifts between average conditions of the past and potential future conditions (Milly et al., 2008). Long-term, reliable, global and local observations of variables such as air temperature, precipitation, sea-surface temperature, streamflow, and groundwater supply are critical to understand the evolving state of the Earth’s climate. Having long-term and high-quality scientific data is critical not only for understanding the dynamics of natural processes but also for ensuring the accuracy of models that simulate potential future impacts of climate change and variability. Continuous data collection and stewardship must be maintained to ensure that governments, researchers, and the public have access to reliable, high-quality data.
At the international level during the past several decades, the efforts of the IPCC have brought attention to the deficiency of quality and quantity of monitoring systems (IPCC, 2007). These deficiencies include a lack of consistent standards for instrumentation; poor maintenance and station siting; insufficient instrument calibration; a lack of intercomparability; and inadequate funding (Karl et al., 2010; Manton et al., 2010; Trenberth, 2008). In the Pacific Islands region, researchers are very concerned about the aging and decreasing number of monitoring systems. The majority of the Pacific Islands region is open ocean, making a robust ocean observational network crucial to understanding local climatic phenomena. In addition to monitoring the ocean, land-based networks of long-term stream and rainfall gauges; temperature, evapotranspiration, and wind stations; and vegetation maps are equally essential. For example, the number of active rain gauges in Hawai’i decreased from 1,030 in 1968 to only 340 in 2007 (Giambelluca et al., 2011), while numbers of USGS streamflow gauges have been declining since the mid-1960s and 1970s throughout the Pacific Islands Region (Oki, 2004), threatening to introduce discontinuities in rare and high-quality century-long records (Figure 2-9).
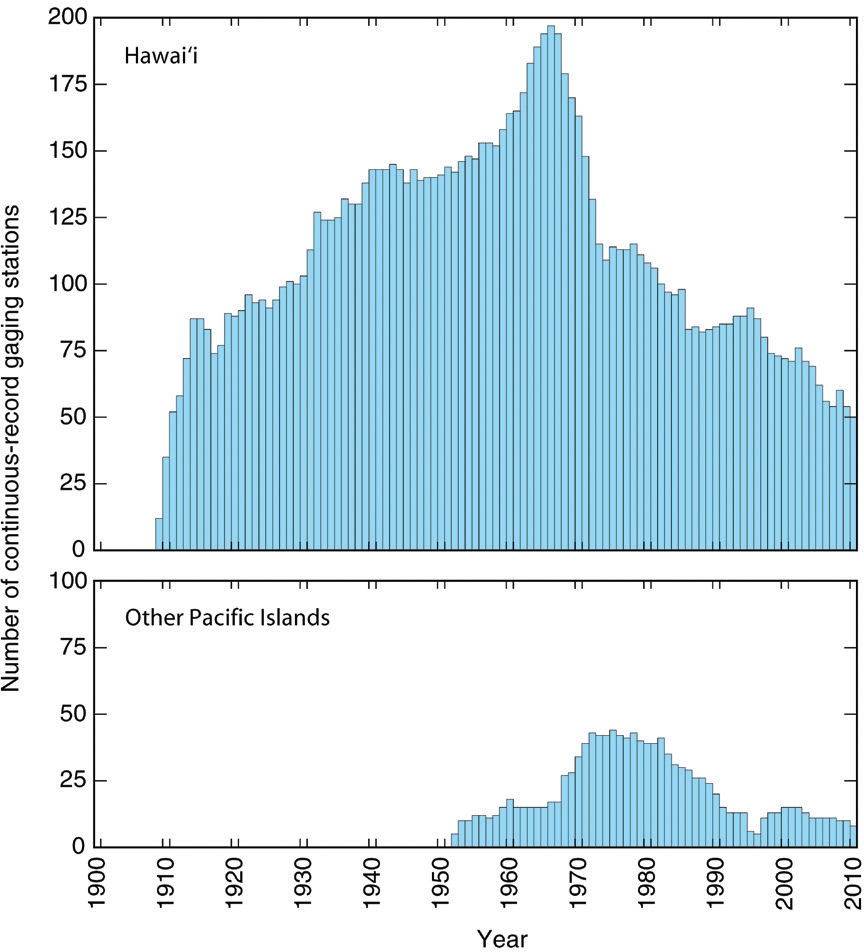
Figure 2-9 In the Pacific Islands, the number of continuously operating stream-flow gauging stations has been steadily declining since the 1960s and 1970s, which parallels the decline of other essential climate variable monitoring networks in the region. Hawai’i has been fortunate to have streamflow records with about a century of data, although recent financial cuts are threatening even these essential networks. (Figure courtesy of Delwyn Oki.)
Within the Pacific Islands, streamflow has been monitored in Hawai’i, American Sāmoa, Guam, the CNMI, Republic of Palau, and the FSM. Hawai’i has the most streamflow data in terms of record length, number of gauges, and area covered (Oki, 2004). Some stream gauges in Hawai’i have been in continuous operation since about 1910. The rest of the Pacific Islands region has much less data, with gauges only on the most populated or largest island in each political entity, and records extending back only to the 1950s and most ending in the 1990s. Besides Hawai’i, only Guam has stream gauges in operation as of 2011. Continuation of streamflow monitoring in Hawai’i and Guam and re-establishment of monitoring of ocean and terrestrial climate variables in other island groups are critical to assessing the impact of climate change on the water resources of the Pacific Islands region and the communities and economies they support.
Western North Pacific
West: Guam, RP, FSM (Yap, Chuuk), CNMI; East: FSM (Pohnpei, Kosrae), RMI
AIR TEMPERATURE. At least one station on each major island group has a relatively complete and continuous record since 1950, whereas other stations have very short records with many gaps. Across all recorded temperatures, however, observed maximum and minimum temperatures have exhibited increasing trends over the past 60 years (Figures 2-10 and 2-11) (Kruk et al., 2012; Lander & Guard, 2003; Lander & Khosrowpanah, 2004; Lander, 2004). The large interannual variability shown in Figures 2-10 and 2-11 is partly related to a strong correlation of air temperature with ENSO conditions—most of Micronesia is cooler than average during the El Niño phase of ENSO and warmer during the La Niña phase. The westernmost Micronesian island groups of Yap, Guam, and Republic of Palau (RP) show trends that generally track observed temperature trends in the northern hemisphere but with more variability (Figure 2-10) (Jones et al., 1999; Brohan et al., 2006; Lander & Guard, 2003). The Majuro Weather Office has identified accelerated trends in maximum temperatures in the RMI since 1973, with a rise of about 0.14°C (0.25°F) over the past 30 years (Jacklick et al., 2011). In the same 30-year period, trends in minimum temperatures have been increasing more slowly, at about 0.12°C (0.22°F) (Jacklick et al., 2011). In both the western and eastern Micronesian island chains, the rate of increase in maximum temperatures has become less steep since 2000. These declines may have to do with shifts in large-scale climate phenomena after the major El Niño event of 1998 (Chavez et al., 1999) or may reflect station relocation. Many of the longest and most complete records of air temperature in the Western North Pacific sub-region (WNP) are at airports and military bases, which may introduce the complicating factors of paved surfaces and artificial heat sources into the record. A continuing analysis of the veracity of data collected from different types of station sites on the continental United States shows no evidence that poorly situated stations collected artificially inflated air temperature data (Menne et al., 2010); however, this analysis was not extended to stations in the Pacific Islands region.

Figure 2-10 Maximum monthly temperature anomaly time series from 1952 to 2012 (using 1960–1990 as the mean reference period) for single monitoring stations with the most data in Yap, Guam, and Palau. The northern hemisphere temperature time series (purple line, Hadley CRU NH) is superimposed for comparison. Trends in maximum temperatures in the western part of the Western North Pacific sub-region appear to be increasing at the same general rate as average northern hemisphere temperatures, although Yap shows a high level of variability. (Updated from Lander & Guard, 2003.)
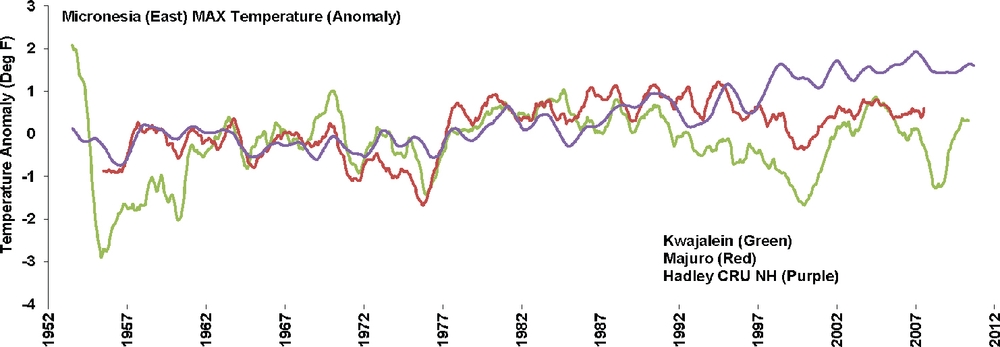
Figure 2-11 Maximum monthly temperature anomaly time series from 1952 to 2012 (using 1960–1990 as the mean reference period) for single monitoring stations with the most data in Kwajalein and Majuro in the RMI. The northern hemisphere temperature time series (purple line, Hadley CRU NH) is superimposed for comparison. Trends in maximum temperatures in the eastern part of the Western North Pacific sub-region have high levels of variability and may reflect issues in the quality of the data or station infrastructure. (Modified and updated from Lander & Guard, 2003.)
PRECIPITATION. Islands throughout the WNP tend to receive abundant rainfall. Islands at lower latitudes, such as Chuuk, Pohnpei, Kosrae, and some low islands in the Republic of the Marshall Islands (RMI), receive over 3,000 mm (about 118 inches) of rainfall annually, which is stored in catchments as an important source of drinking and irrigation water (Lander & Khosrowpanah, 2004; Bailey & Jenson, 2011). All islands have a wet season and a dry season, with the relative length and intensity of each season depending on latitude. The more northward the island, the longer and drier the dry season tends to be. As with the variability in air temperature, ENSO has a strong effect on precipitation in Micronesia, with strong El Niño events corresponding closely with an increased risk for drought in the following year. Eastern Micronesian islands such as Majuro and Kwajalein show a statistically significant drying trend from 1954 to 2011, such that over the past 60 years, these islands have lost nearly 15 percent of their annual rainfall, while western Micronesian islands show a slight tendency toward wetter conditions (Figure 2-12) (Bailey & Jenson, 2011; Jacklick et al., 2011). On the westernmost islands such as Yap and RP, precipitation shows upward trends, but the trends are not statistically significant (Kruk et al, 2012).
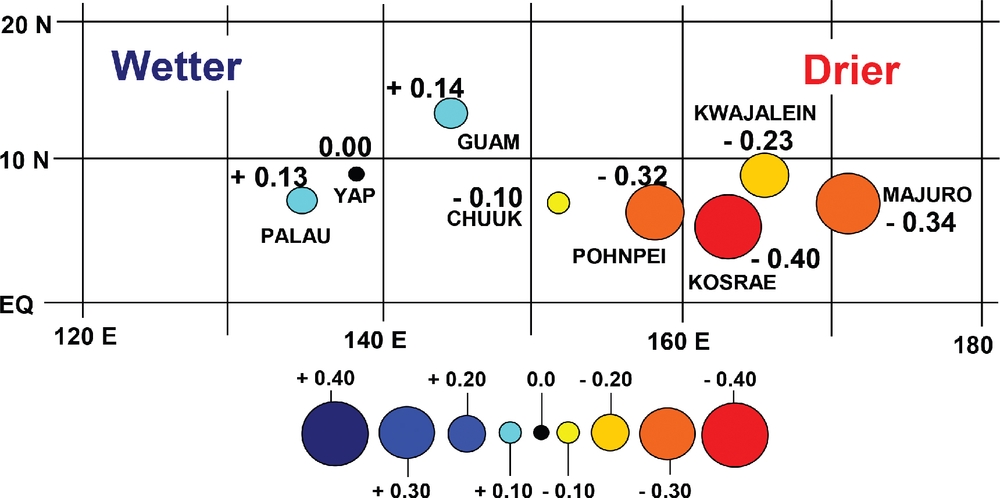
Figure 2-12 Annual rainfall anomaly (inches per month per decade) in the WNP sub-region from 1950 to 2010 shows that whereas islands in the west are tending toward getting slightly more precipitation, islands in the east are experiencing much less precipitation. Darker blue shading indicates wetter conditions, and darker red shading indicates drier. The size of the dot is proportional to the size of the trend as per the inset scale. (Modified and updated from Lander & Guard, 2003, and Lander, 2004.)
EXTREMES IN PRECIPITATION. Although islands in the WNP have large amounts of rainfall annually, drought is a serious issue throughout Micronesia because of limited storage capacity and small groundwater supplies. During the winter and spring months following an El Niño, drought tends to be the most extreme. Limited research has been conducted on trends in extreme precipitation throughout Micronesia, although some results indicate fewer extreme rainfall events greater than 254 mm (10 inches) in 24 hours in Guam and the Commonwealth of the Northern Mariana Islands (CNMI) since the 1950s (Lander & Guard, 2003; Lander & Khosrowpanah, 2004). Preliminary region-wide analysis indicates that both summer and winter one-day amounts of precipitation over the 95th percentile have been declining since the early 1900s (Kruk et al., 2012).
A more controversial issue for the sub-region is the trend in distribution and frequency of tropical cyclones (Knutson et al., 2010). Although attribution of an individual cyclone to climate change would be tenuous, shifts in storm frequency in both the Western North Pacific basin and other basins around the world have destructive impacts on island nations. The WNP basin is the world’s most prolific typhoon basin, with an annual average of 25.8 (Japan Meteorological Agency data) or 26.3 (Joint Typhoon Warning Center data) named tropical cyclones between 1951 and 2010, depending on the database used (Knapp et al., 2010). Since 2000, the basin has been very calm, with only 14 numbered storms in 2010 (Knapp et al., 2010) (Figure 2-13). Typhoons tend to be more intense in El Niño years, especially in the eastern regions of Micronesia. Research into how future climate will affect the frequency and intensity of tropical storm systems is of great societal importance for Pacific Islanders’ food and water supplies, livelihoods, and health (Gualdi et al., 2008).
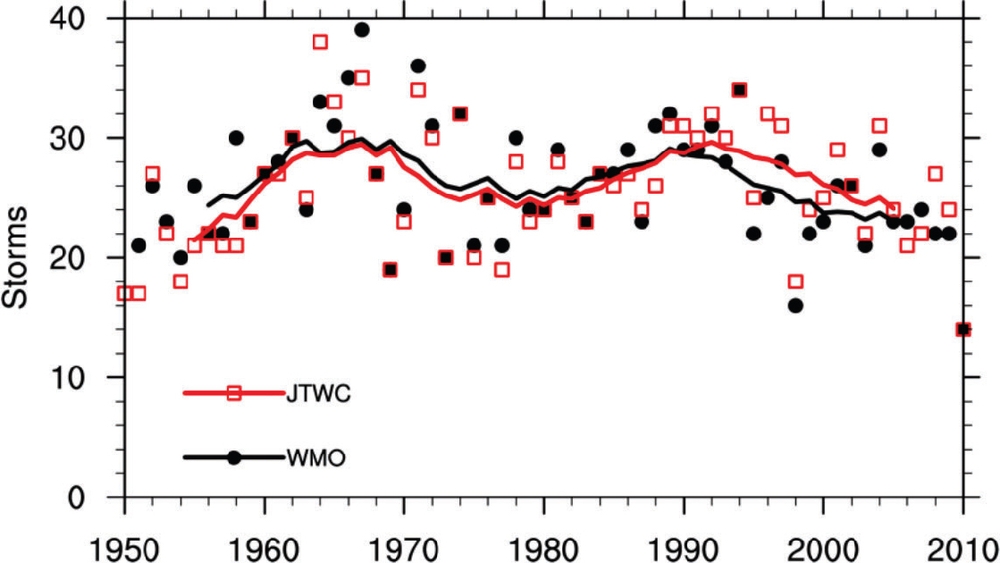
Figure 2-13 The number of tropical cyclones in the WNP basin as observed by the World Meteorological Organization (WMO; black lines/dots) and the Joint Typhoon Warning Center (JTWC; red lines/dots) since 1950. Lines indicate smoothed storm trend. There are regular cycles of greater and lesser annual storm numbers, and there were only 14 named storms in 2010. (From Knapp et al. [2010] by permission of American Meteorological Society. Data from the International Best Track Archive for Climate Stewardship [IBTrACS].)
STREAMFLOW AND GROUNDWATER. Streamflow records available for the WNP are short relative to those in Hawai’i, mostly discontinuous, and many have been affected by upstream diversions or other human activities. The longest record (57 years) and the most complete record (49 years) are from Guam (Miller et al., 2012). Only two gauges on Guam have more than 35 years of record and are unaffected by artificial diversions. Neither of the records from these gauges shows a significant trend in total streamflow, base flow (Figure 2-14), or the number of extreme low-flow or high-flow days. The lack of significant streamflow trends on Guam is consistent with a similar lack of trends in rainfall observations (Kruk et al., 2012; Lander & Guard, 2003; Lander & Khosrowpanah, 2004; Lander, 2004).
Due to the vulnerability of many low islands in the Western North Pacific to drought, it is important to assess the capacity and potential resilience of freshwater-lens systems across the region. Studies modeling observed groundwater conditions in selected atolls in the Federated States of Micronesia (FSM) have demonstrated that during severe drought conditions, only a few large leeward islands are able to maintain a substantial freshwater lens (about 6 percent of the islands studied) (Figure 2-15) (Bailey & Jenson, 2011; Bailey et al., 2010). The quantified limited capacity and fragile nature of these lenses demonstrate the extreme vulnerability of low islands in the sub-region to sustained drought conditions.
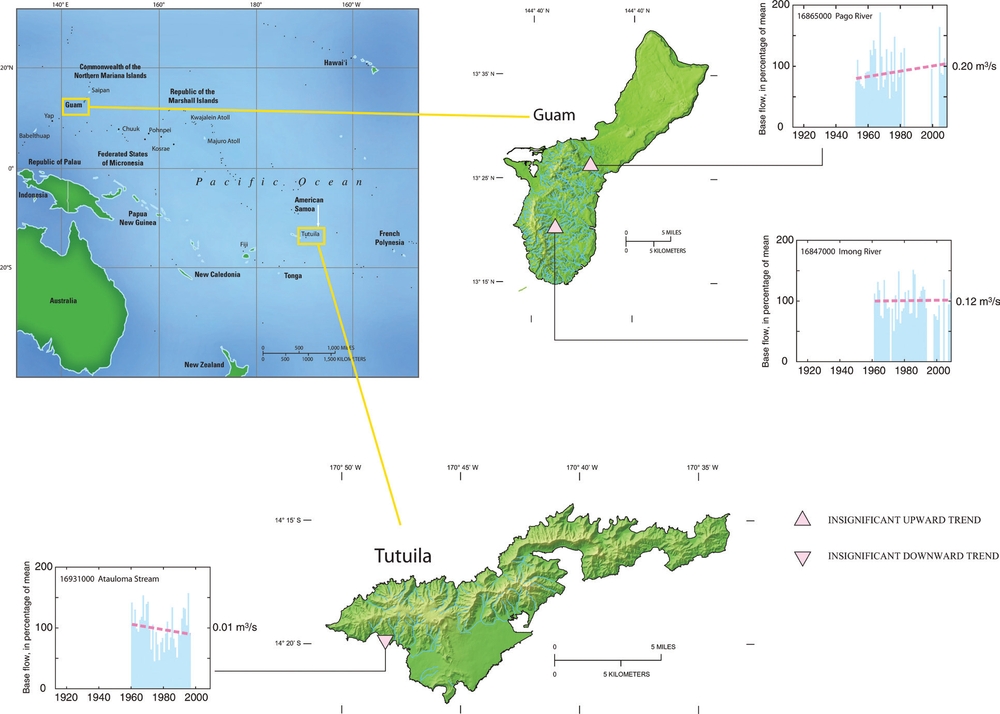
Figure 2-14 Streamflow records available for the Western North Pacific and Central South Pacific sub-regions are relatively short and mostly discontinuous, and many have been affected by upstream diversions or other human activities. Analysis of data from 1978 to 2008 from two gauges on Guam and one on Tutuila, American Samoa, showed no statistically significant trends (red dashed line) in the number of extreme high- or low-flow days. The lack of significant streamflow trends on Guam and American Samoa is consistent with rainfall observations but may also be an artifact of short record available for analysis, highlighting the need for consistent and high-quality monitoring in these sub-regions. (From Miller et al., 2012.)
Central South Pacific: American Sāmoa
AIR TEMPERATURE. Average air temperatures in American Sāmoa are tropical, ranging from about 21° to 32°C (70° to 90°F). In the Central South Pacific sub-region (CSP), average, minimum, and maximum temperatures indicate a general warming trend since the 1950s. The largest observed increase has been in minimum air temperatures, while average temperature increases range from 0.15° to 0.25°C (0.27 to 0.45°F) per decade, depending on the island (Australian Bureau of Meteorology & CSIRO, 2011). Regional analyses of air temperature in Sāmoa are highly variable but also show an upward trend in maximum air temperatures since 1950 (Young, 2007).
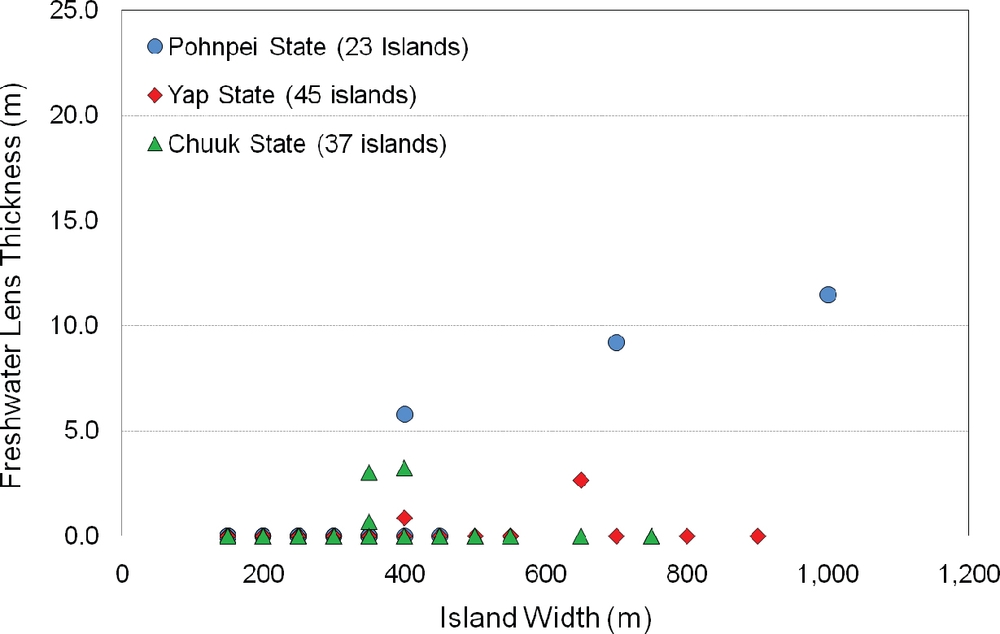
Figure 2-15 Low islands are highly vulnerable to stresses on their freshwater resources in times of drought. Shown here is a plot of the estimated modeled freshwater lens thickness (meters) among atoll islands in the Federated States of Micronesia for drought conditions similar to the severe 1998 event that followed a large El Niño. Under simulated drought conditions, only 6 out of 105 islands will have freshwater lenses thick enough to provide groundwater. (From Bailey & Jenson, 2011.)
PRECIPITATION. American Sāmoa is warm, humid, and rainy all year. The summer season is long and wet, lasting from October to May, and the winter season is only slightly cooler and drier, from June to September. Annual mean rainfall at Pago Pago Airport is about 3,048 mm (120 inches), although other areas can receive as little as 1,800 mm or as much as 5,000 mm (about 71 to 200 inches) due to orographic effect (Izuka et al., 2005). ENSO effects in American Sāmoa and the CSP vary by the strength of the particular anomaly event. During strong El Niño events, the monsoon trough is pulled northward and the SPCZ moves east-northeast of the Sāmoan region, making it significantly drier. In moderate El Niño events, the CSP is more susceptible to tropical cyclone formation and passage, and the rainy season tends to initiate earlier and end later. During weak El Niño events, the monsoon trough and SPCZ are west of the Sāmoa region. This causes reduced tropical storm activity and conditions that are drier than average. In Āpia, Sāmoa (about 80 km or 50 miles west of American Sāmoa), long-term records from 1890 to 2005 show no trend in daily, monthly, or annual precipitation (Young, 2007; Australian Bureau of Meteorology & CSIRO, 2011).
EXTREMES IN PRECIPITATION. Little detailed work has been undertaken examining trends in extreme events in this sub-region. Initial analysis of extreme precipitation records has only been done using the Pago Pago airport rain gauge, which has the longest period of record and the least missing data in American Sāmoa. Nearly all other rain gauges throughout American Sāmoa have been discontinued. Data from the Pago Pago Airport gauge show no trend in annual or winter one-day amounts of precipitation above the 95th percentile since 1965, and summer one-day amounts show a slight downward trend that is not statistically significant (Kruk et al., 2012).
ENSO and tropical cyclones are associated with extreme events in the South Pacific Islands. For the Central South Pacific sub-region, tropical cyclones occur between November and April; the number of cyclones varies widely from year to year but they tend to occur more frequently during moderate-intensity El Niño years and less frequently during weak El Niño events. Additionally, Madden-Julien Oscillation (MJO) propagation, the major source of intraseasonal variability in the tropical atmosphere, intensifies and increases the frequency of tropical cyclones during moderate El Niño events. Lastly, during strong La Niña events, the SPCZ lies far southwest of the Sāmoan region, and the risk of tropical cyclone development is moderate to high. The frequency of extremely high rainfall events per year has remained consistent since 1965 (Kruk et al., 2012).
STREAMFLOW AND GROUNDWATER. Streamflow records available for American Sāmoa are relatively short and mostly discontinuous, and many have been affected by upstream diversions or other human activities. Only one gauge on the main island of Tutuila has more than 35 years of record and is unaffected by artificial diversions (Miller et al., 2012). Data from this gauge did not show a significant trend in total streamflow, base flow, or the number of extreme low-flow or high-flow days (Figure 2-14). Although the lack of significant streamflow trends on American Sāmoa is consistent with a similar lack of trends in rainfall observations (Young, 2007; Australian Bureau of Meteorology & CSIRO, 2011), it may also be an artifact of the lack of sufficiently long streamflow records for this sub-region.
Projections
Although global and regional projections from the 2007 IPCC report are coarse, it is possible to make general projections at a grid scale of 200 by 200 kilometers (about 124 by 124 miles) on drivers of key water-related processes (Christensen et al., 2007). As shown in Chapter 1 (“Models and Projections”; Figure 1-8), mean annual air temperatures in Hawai’i and the Central North Pacific region in three future time periods (2035, 2055, and 2085) for the B1 and A2 emissions scenarios all show an increase compared to 1971–2000. For 2035, temperature increases in the B1 scenario range from +0.6° to 1.1°C (+1° to 2°F), and in the A2 scenario from +0.8° to 1.4°C (+1.5° to 2.0°F) (Christensen et al., 2007; Meehl et al., 2007). In the WNP, projected annual surface air temperature increases range from +0.6° to 0.7°C (+1.1° to 1.3°F) by 2030, +1.0° to 1.4°C (+1.9° to 2.6°F) by 2055, and +1.5° to 2.8°C (+2.7° to 5.1°F) by 2090 for the B1 and A2 emission scenarios (Australian Bureau of Meteorology & CSIRO, 2011). Projections in the CSP also show warming, with annual air temperatures ranging from +0.6° to 0.7°C (+1.1 to 1.3°F) by 2030, +1.0° to 1.4°C (+1.9° to 2.5°F) by 2055, and +1.4° to 2.6°C (+2.5° to 4.8°F) by 2090 for B1 and A2 emissions scenarios (Australian Bureau of Meteorology & CSIRO, 2011).
Projections of future rainfall all are more uncertain. As shown in Chapter 1 (“Models and Projections”; Figure 1-8), the best projections for the Central North Pacific sub-region of mean annual rainfall in three future time periods (2035, 2055, and 2085) for the B1 and A2 emissions scenarios as compared to 1971–2000 suggest that by 2085, the southern parts of the region will show large increases in average rainfall of +0.5 to 7.5%, while northern areas will show slight decreases of −0.5 to 1.5%. The magnitude of this southto-north drying trend will increase as time progresses. Statistical downscaling with much finer resolution over Hawai’i shows reductions in wet-season rainfall (November to April) (Takahashi et al., 2011) that are consistent with trends indicating increasing winter drought since the 1950s (Figure 2-16), increases in dry-season rainfall, and changes in the frequency of heavy rainfall events in Hawai’i during the 21st century. However, the number of heavy rainfall days in Hawai’i during the 21st century is not predicted to increase dramatically, based on the predicted variations in the frequency and magnitude of ENSO and the Pacific-North American pattern (Elison Timm et al., 2011; Norton et al., 2011; Elison Timm & Diaz, 2009).
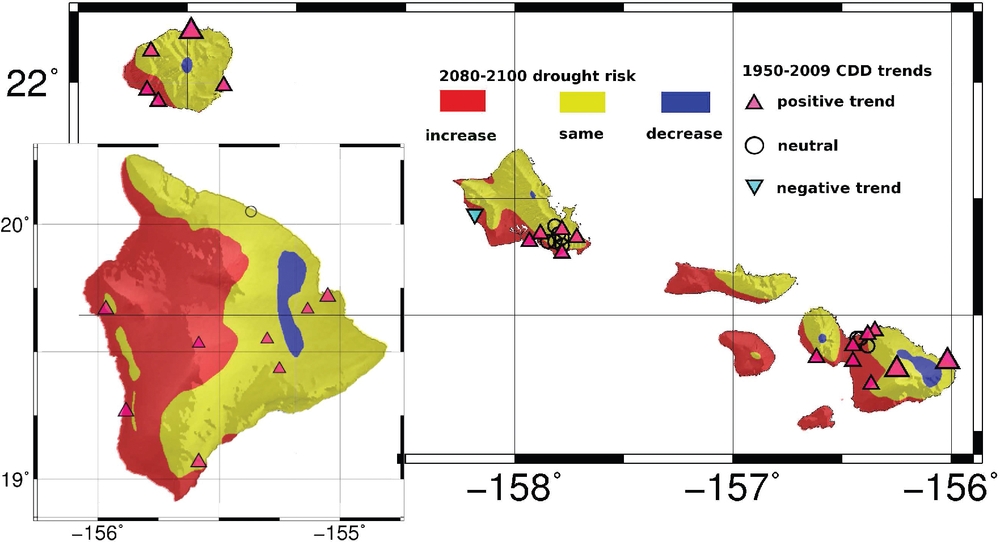
Figure 2-16 All four major Hawaiian Islands (O’ahu, Kaua’i, Maui, and Hawai’i Island) have experienced increasing winter drought since the 1950s, defined by a longer annual maximum number of consecutive dry days. Background colors highlight changes in the number of low-precipitation months during the wet season (November–April) based on statistically downscaled climate change scenarios from six models of the IPCC AR4 report for years 2080–2100. (Figure courtesy of Oliver Elison Timm.)
In the Western North Pacific, rainfall projections suggest that the wet season will get wetter and the dry season drier, with overall increases in mean annual rainfall (Australian Bureau of Meteorology & CSIRO, 2011). Both the intensity and frequency of days of extreme rainfall are projected to increase over the 21st century. Due to variable observed trends in precipitation in the Central South Pacific, projections are less certain. However, models show either no change or a slight decrease in dry-season rainfall and an increase in wet-season rainfall in the 21st century (Australian Bureau of Meteorology & CSIRO, 2011).
Impacts and adaptation
Impacts of climate change on freshwater resources in the Pacific Islands region will vary, not only because of differing island size and height but also because of the relative adaptive capacity and ability to organize of the specific island or community in question. In the Pacific Islands, “communities” have traditionally been separated by dominant landscape features (i.e., mountain ridges, valleys, etc.), traditional land management units, and historical familial land rights. These well-defined geographical boundaries and traditional land and resource management practices contributed greatly to the ability for most communities in the region to organize. In American Sāmoa, for example, local communities are organized into villages, managed by both traditional and western resource and land management practices. In contrast, modern local communities in Hawai’i are typically townships, managed by a complex regulatory system with numerous jurisdictional entities. More recently in Hawai’i, an increased focus has been placed on blending current western systems with more traditional land management techniques.
On high islands such as Hawai’i that are already showing decreases in precipitation and base flow (Oki, 2004), the continuation of these decreasing trends may impact freshwater ecosystems and aquatic species, especially as flows decline so much as to become intermittent. Decrease in streamflow may also interrupt movement of native species along streams and may prevent species that spend their larval stages in the ocean from returning to the streams to complete their life cycle. Invasive plant and animal species are established and expanding in many forests, and their responses to climate change will interact with those of native species to determine future ecosystem composition and processes. Existing climate zones are projected to shift, generally upslope, with some eventually disappearing (Benning et al., 2002). The ability of native plant species to adapt to these changes will be affected by competition with aggressive invasive species and dispersal limitations due to the extinction of many native pollinators and seed dispersers. Available habitat decreases rapidly with elevation, putting species currently found on upper slopes and ridges at special risk.
In Kahalu’u, Kona, Hawai’i, a watershed and ecosystem adaptation project illustrates the importance of maintaining a healthy freshwater system using local, informed perspectives of water resources from the forest to the ocean. Led by the University of Hawai’i at Mānoa and The Kohala Center, the project is working to create useful tools for freshwater management through local community involvement. An aim of the project is f or the community to better understand freshwater movement through the environment to the surface-water features of the Kona coast in order to emphasize the importance of maintaining a healthy and functioning ecosystem (The Kohala Center, 2008).
Climate will continue to affect human health on the Pacific Islands. Low islands and coastal communities in the WNP sub-region are especially vulnerable due to their low elevation, small land mass, geographic isolation, and limited potable water sources and agricultural resources (Barnett & Adger, 2003). Sea-level rise and more frequent inundation by king tides and tropical cyclones may not only contaminate limited groundwater resources but also overcome basic sanitary systems and agricultural fields (see Case Study 2-1 at the end of this chapter). Given that many vector- and water-borne diseases are weather-influenced, climate change impacts on low islands and coastal communities allow for malaria, dengue (Kolivras, 2010), diarrhea, and other diseases to increasingly infect some Pacific Island populations. The young, the elderly, and those with preexisting medical conditions are especially vulnerable to these diseases (World Health Organization, 2010).
It is very likely that agriculture and food security will be impacted by climate change through increased drought, possible increases in storm intensity, and changes in rainfall patterns (Sivakumar & Hansen, 2007). The potential increased intensity of storms and cyclones may result in significant damage to agricultural infrastructure such as crop- and water-storage facilities, irrigation systems, roadways, heavy equipment, and low-lying crop areas. Increased temperatures coupled with decreased rainfall may lead to additional need for freshwater resources for crop irrigation (Döll, 2002). This is particularly important for locations in the tropics and subtropics where observed data and model projections show a high probability (>90%) that growing-season temperatures by the end of the 21st century will exceed the most extreme seasonal temperatures recorded from 1900 to 2006 (Battisti & Naylor, 2009). Although the Pacific Islands may be more vulnerable to climate impacts because of their small size and isolation, some island communities have effectively acclimated to changes in climate over time. For example, while climate impacts such as drought, saltwater inundation, and increasing water temperature will have impacts on traditional food sources such as taro and breadfruit (Maclellan, 2009), there are projects to address the observed reduction in upland garden and taro yields (Wongbusarakum, 2010).
In terms of economic impacts, changes in the climate will affect tourism, a main source of income for many islands throughout the Pacific. Tourism is an extremely water-intensive economic activity that may suffer from changes in island freshwater supplies (Christensen et al., 2007). Infrastructure for water delivery and sewage is also vulnerable to climate-related flooding and erosion and poses additional risks to island populations as a result of extreme events (storms and droughts) and sea-level rise, which contribute to drinking water contamination and sewage overflow. For example, in December 2010, heavy storms caused multiple sewer overflows and pipe breakages on the island of O’ahu in the State of Hawai’i. As storm intensity and frequency are predicted to change in some Pacific Island sub-regions and storm paths may shift (Australia Bureau of Meteorology & CSIRO, 2011), reliance of the majority of the Pacific Islands on imported oil for primary energy production renders them highly vulnerable to climate-related disruption of delivery and subsequent energy production. Because the Pacific Islands are almost entirely dependent on imported food, fuel, and material (Austin et al., 2011; Hawai’i State Civil Defense, 2010), the vulnerability of ports and airports to extreme events, especially typhoons, is of high concern.
There are organizations that increase the knowledge base of water managers through the entire region and strive to enhance their adaptive capacity. For example, the Pacific ENSO Applications Climate (PEAC) Center has been producing information products on climate variability for island water managers for all US-Affiliated Pacific Islands since 1994 (PEAC Center, 2010). The PEAC Center provides free quarterly electronic and hard copy newsletters with seasonal forecasts of rainfall, storms, and the latest ENSO conditions that are sub-regionally applicable.
Summary
Islands and atolls in the Pacific have unique issues relating to freshwater resources. Data indicate that the Pacific Islands are being affected by climate change and variability and are vulnerable to future impacts. Due to their small size, exposure to the ocean, lack of economic resources, and isolation, the Pacific Islands are at high risk of experiencing negative climate impacts to already fragile freshwater resources. Assessment of climate change impacts is hampered, however, by decreases in essential monitoring and observation. The problem is so severe that at present this extensive region is monitored by only a handful of reliable stations. Projections of future climate indicate that the negative impacts of climate change are very likely to continue and intensify in the Pacific Islands sub-region over the next century.
The main regional findings of this chapter include the following:
- Because of their small size and isolation, islands in the Pacific have limited and fragile freshwater resources, making them more vulnerable to climate hazards and stresses than are continents.
- Freshwater resources on low islands are especially vulnerable to climate-related threats due to their small size and limited natural and socio-economic resources.
- The strong influence of the El Niño-Southern Oscillation in the Pacific superimposes natural short-term cyclic variations on long-term trends in precipitation. This makes it difficult to detect long-term regional climate trends and make accurate predictions.
- There are now fewer long-term monitoring stations in the Pacific than there were a few decades ago. To accurately assess trends in water resources as climate changes, more data and basic monitoring are severely needed.
In the Central North Pacific sub-region:
- Average air temperature in Hawai’i has risen significantly in the past 100 years. This rise in air temperature has accelerated in the past 30 years.
- Increasing air temperature is more rapid in high-elevation environments located more than a half mile above sea level.
- Annual precipitation has decreased significantly in the past 100 years.
- In the past 30 years, all Hawaiian Islands have experienced greater numbers of consecutive dry days and fewer days of intense rainfall.
- Base flow, the groundwater component of streamflow, has shown significant downward trends of 20% to 70% in the past 100 years. This trend indicates a decrease in groundwater resources.
- The sub-region has experienced a decrease in climate monitoring stations. The ability to assess future climate changes in meaningful detail is at risk.
In the Western North Pacific sub-region:
- Although variability is high, maximum and minimum air temperatures have exhibited upward trends over the past 60 years.
- Eastern Micronesian islands such as Majuro and Kwajalein have shown a significant downward trend in rainfall over the past 60 years, while western Micronesian islands show non-significant trends toward more precipitation. In the past 60 years, there have been fewer extreme one-day rainfall events in Guam and the CNML
- The smallest islands are extremely vulnerable to droughts of any severity.
- The sub-region suffers from a declining number of climate monitoring stations and is currently not adequately instrumented to assess future climate changes in meaningful detail.
In the Central South Pacific sub-region:
- In the past 60 years, average, minimum, and maximum air temperatures have been increasing. The largest observed increases have been in minimum air temperatures.
- In Sāmoa, precipitation records in the past 100 years have shown no trend.
- The frequency of extreme precipitation and drought events has not changed significantly in the past 60 years.
- No significant trends were detected in streamflow, which may be due to the short length of record.
- The region suffers from a declining number of climate monitoring stations and is currently not adequately instrumented to assess future climate changes in meaningful detail.
FOCUS ON ADAPTATION
Case Study 2-1
Managing vulnerable water resources in atoll nations
Water supplies on small, low-lying atoll islands are extremely vulnerable to droughts and to saltwater inundation caused by high tides. Water for drinking and other uses comes from two sources: rainwater catchments and shallow wells that draw from a layer or “lens” of freshwater that is underlain by brackish water or saltwater. Groundwater in the part of the lens that is near the ground surface in the central depression of the island is also important for taro cultivation. On some atoll islands, the freshwater lens is thin and highly vulnerable to contamination from the saltwater below, especially if too much freshwater is drawn from the lens.
The El Niño event of 1997–1998 caused severe droughts and water shortages on many of the Pacific Islands. Between January and April 1998, Majuro Atoll in the Marshall Islands received only 85% of the normal rainfall for the period (Presley, 2005). By April 1998, the Majuro Water and Sewer Company (MWSC), which relies primarily on rainwater catchment and to a less extent on groundwater, was only able to provide water to the island’s 27,000 residents and businesses for about 10 hours every two weeks. Health officials reported more than 1,000 cases of dehydration, drought-related skin disease, and respiratory infections (“Marshall Islands drought assistance continues,” 1998).
Because of human health concerns, large reverse-osmosis water-purification systems, capable of producing 473,174 liters (125,000 gallons) of freshwater per day from treated seawater, were brought to Majuro to help alleviate the water shortage. Concurrently, groundwater withdrawals from the freshwater lens in the Laura area of the atoll were increased from 378,541 liters (100,000 gallons) to a maximum of 1,082,627 liters (286,000 gallons) per day (Presley, 2005). During the drought, public concern arose about these increased groundwater withdrawals because of the potential impact of saltwater intrusion on taro, breadfruit, and banana crops. The US Geological Survey, in cooperation with the Republic of the Marshall Islands government and the Federal Emergency Management Agency, installed monitoring wells to determine the condition of the freshwater lens during the drought. Results indicated that saltwater intrusion had not affected crops despite the increase in groundwater withdrawals. The study demonstrated the importance of maintaining a groundwater monitoring program to (1) evaluate the status of the freshwater lens, (2) indicate a sustainable pumping rate that will protect the resource from saltwater intrusion, and (3) help local organizations such as the MWSC address public concerns (Presley, 2005).
This case study demonstrates the vulnerability of freshwater resources on atoll islands. Data from monitoring are needed to manage rainwater and groundwater resources conjunctively and increase the adaptive capacity of low islands to meet the challenges posed by climate variability and change. With no monitoring plan in place or funding to upgrade the groundwater pumps in Laura, the existing on-island adaptive capacity to respond to the drought was low, despite warnings received in advance.
Integrated management of rainwater and groundwater resources is critical for water security, especially on the less-developed atoll islands in the Republic of the Marshall Islands and Federated States of Micronesia (Hamlin & Takasaki, 1996). One way to help alleviate chronic water-supply shortages during droughts would be to develop ground-water resources for non-potable uses where feasible so that rainwater can be saved for drinking and cooking.

Case Study 2-1 Photo 1 Taro crops destroyed by saltwater inundation at Lukunoch Atoll, Chuuk State, Federated States of Micro nesia. Giant swamp taro (Cyrtosperma) is a staple crop in Micronesia that requires a two- to three-year growing period from initial planting to harvest. It may take two years of normal rainfall to flush brackish water out of a taro patch, so there will be a five-year gap before the next harvest, assuming no more saltwater inundation takes place (Hezel, 2009). (Courtesy of John Quidachay, USDA Forest Service.)
Although groundwater from shallow wells can be used to mitigate water shortages during droughts, rainwater catchment systems are the only source of freshwater when storm waves and uncommonly extreme high tides known as “king tides” inundate low-lying atoll islands, turning all the groundwater brackish. In December 2007 and again in 2008, several atoll islands in the Federated States of Micronesia were flooded by a series of high-sea/surf events. These saltwater floods had a significant impact on taro crops that are commonly cultivated in a depression near the center of the island. In December 2007, on the outer islands of Chuuk State, where 13,000 people or one-fourth of the state population resides, an estimated 90% of all taro crops were destroyed by saltwater inundation (Hezel, 2009).
FOCUS ON ADAPTATION
Case Study 2-2
Using climate forecasts to save money and protect human health
When we leave the house in the morning, we often check the local weather forecast and make some quick decisions: Should I bring an umbrella? How about a sweater? By assessing the risks and taking action, we are effectively mitigating our vulnerability to weather-related impacts. While most people do not think twice about weighing uncertain weather information and taking action based on their best estimate of risk, it has proven much more difficult for community members, policymakers, and natural resource managers to integrate climate forecasts into their decision-making processes. By definition, climate risks have longer-term consequences, which make them easier to ignore in the short term. Yet a landfill on the island of O’ahu in Hawai’i demonstrated that climate information can be used to make management decisions that save time, money, jobs, and the health of our communities and natural environment.
Each year, the Weather Forecast Office (WFO) in Honolulu uses national El Niño and La Niña outlooks from NOAA to create island-level forecasts for Hawai’i. In conjunction with the Pacific ENSO Applications Climate (PEAC) Center, the WFO uses television, radio, and print and electronic newsletters to inform policymakers, managers, and communities about the potential seasonal impacts of an El Niño or La Niña event. In October 2010, the Honolulu WFO gave its winter wet-season (October to April) briefing, indicating that due to a moderate-to-strong La Niña (Figure 2-17) developing in the Pacific, O’ahu could expect above-average winter rainfall.
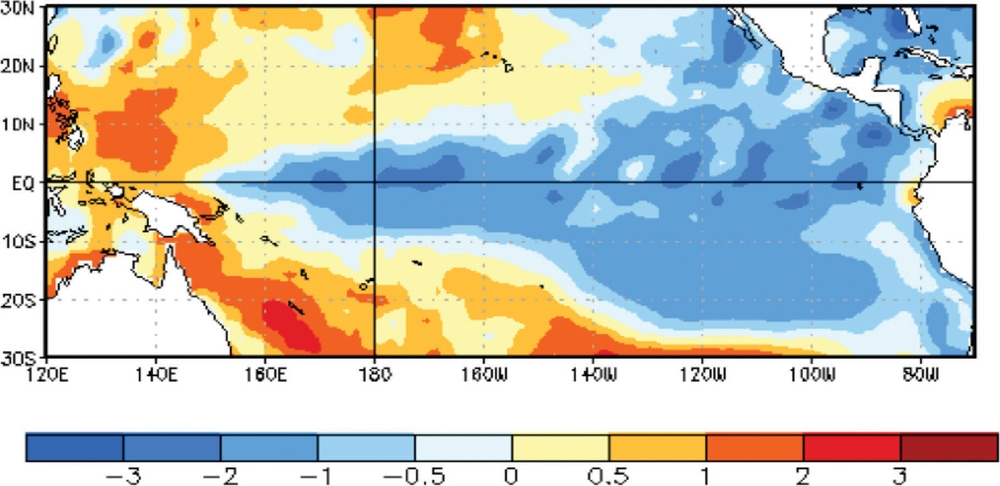
Figure 2-17 The NOAA Climate Prediction Center (CPC) released a seasonal ENSO outlook indicating La Niña conditions, or colder-than-average sea-surface temperatures in the equatorial Pacific Ocean. Here, in December 2010, the plume of cold (blue) water is visibly extending westward along the equator. (Courtesy of NOAA CPC, “December 2011 Sea-surface Temperatures.”)
The vice-president of an O’ahu commercial landfill, PVT Land Company in Nanakuli, used this information, and his company immediately took steps to mitigate the climate risks. The company’s managers decided to move quickly to upgrade infrastructure that would divert and hold large amounts of stormwater. By the end of November 2010, PVT had finished upgrading its storm drainage system and retention ponds.
The dry Nanakuli area usually receives a total of 254 to 356 mm (10 to 14 inches) of rain annually, but on January 13, 2011, the area received about 356 mm (10 inches) in a single storm. Other local landfills were not prepared to handle the intense rainfall and ended up closing down. They also released hazardous untreated water and waste onto local beaches. But due to their good use of climate forecasts, PVT Land Company was open for business the next day.
By remaining open, PVT estimates that they saved about $1 million in gross sales, potential damage to infrastructure, and lost salaries. This estimate does not include the additional financial impacts from the construction and trucking jobs across the island that would have had to slow down or stop had they not been able to properly dispose of their on-site debris, or the savings from avoiding potential litigation had the stormwater system failed.
This case demonstrates the actual and potential savings associated with taking an active role in making planning and management decisions based on the best available climate information, as well as the type of successful adaptations that can be accomplished when adaptive capacity in a region and institution is very high. It is often difficult to quantify long-term negative consequences that are associated with failing to act on or make a decision earlier in time; however, the PVT case provides an excellent shorter-term example with quantifiable benefits for policymakers, scientists, communities, and businesses who are willing to work together to make and act upon climate forecast-based decisions. The PVT landfill continues to use seasonal climate forecasts to guide their mid-range planning process and is interested to learn about what longer-term local climate projections can assist them in their goals of continuing a safe and efficient business.
For more information on the PEAC Center or to receive their free regional ENSO forecast newsletter, please visit: http://www.prh.noaa.gov/peac/
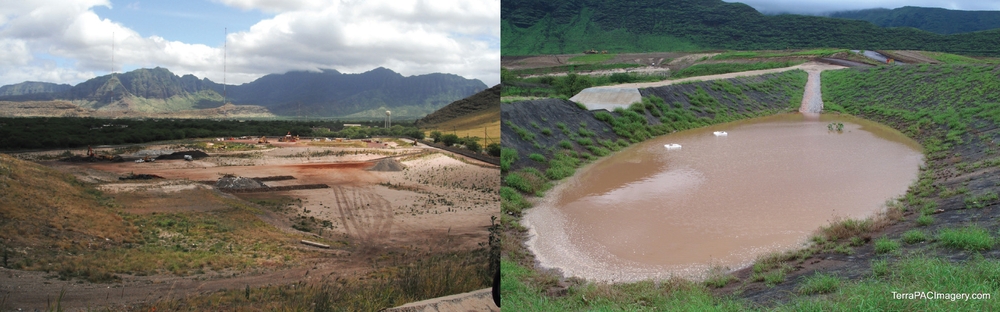
Case Study 2-2 Photo 1 The PVT Land Company (left) is O’ahu’s only landfill for construction-site waste and receives over 200 truckloads of construction debris per day. If it was unable to receive waste, construction and trucking jobs on O’ahu would have to slow or cease. In making a fast decision using a seasonal climate forecast, PVT upgraded their stormwater drainage system and retention pond (right) to be able to accommodate increased volumes of stormwater. (Courtesy of Dr. Victoria Keener [left]; courtesy of Bill Lyon, TerraPac, LLC [right].)
FOCUS ON ADAPTATION
Case Study 2-3
Climate change likely to intensify freshwater disputes in Hawai’i
While the high islands of Hawai’i are wetter than much of the western United States, Hawai’i has a similar regional history of intense legal fights over water. Ongoing conflicts not only illustrate how sectors and players compete but also show how changes in the abundance and distribution of water caused by climate change may intensify these prolonged battles.
Contemporary conflicts over water allocation in Hawai’i have their origins in the mid-1800s, when King Kamehameha III created private property in land but continued to hold water as a public trust, setting the stage for conflict between emerging water-intensive agribusiness and traditional users. Today’s battles take place under a legal framework that includes judicial precedent (including decisions made during the Hawaiian Kingdom) (Hawai’i Revised Statutes [HRS] 1-1); state constitutional provisions that reiterate the public trust in water and Native Hawaiian rights (Haw. Const. art. XI, § 1 & 7, art. XII §1-4 & 7); and the state’s Water Code (HRS 174C). The State Commission on Water Resource Management attempts to balance public trust uses of water (including traditional and customary Hawaiian practices, the procreation of fish and wildlife, and the maintenance of ecological balance and scenic beauty) against a goal of maximizing beneficial uses (including agricultural, commercial, and industrial consumption).
The largest ongoing fight has been on the island of O’ahu, where the Waiāhole Ditch system was developed in 1913–1916 to deliver water from the wet, windward Ko’olau Mountains to the dry, southern leeward plain for sugar cultivation. While originally designed to capture stream water, the construction of the delivery tunnels pierced large volcanic dike compartments (Figure 2-1), releasing stored groundwater and over time changing the underlying hydrology of windward streams (Takasaki & Mink, 1985). Beyond the immediate impact on ecosystems, this significantly disrupted nutrient flow into Kāne’ohe Bay, the largest estuarine system of the Pacific Islands (in re Water Use Permit Applications, 94 Haw. 97 P.3d 409 (2000)).
The current battle ignited in 1995 with the closure of the plantation using this water. Before the State Commission on Water Resource Management and later the Hawai’i Supreme Court, leeward interests (including groups in the agricultural, development, military, and tourism sectors) sought to maintain ditch flows, while conservationists, Native Hawaiians, and small riparian farmers sought to restore windward streams. The current allocation restores approximately one-half of the water to the streams of origin. The years of litigation have cost millions of dollars, and today, the case is on its third appeal to the Hawai’i Supreme Court.
The Hawai’i Supreme Court’s decisions have affirmed a public trust in water and demand adherence to the precautionary principle in managing the trust. Decisions up to now, however, have not taken into account the decline in rainfall all and base flow observed over the past 60 years (Oki, 2004) or effects from other threats to forested recharge areas.
An ongoing battle on Maui is even more intense than the Waiāhole fight because of concerns about groundwater available for the island’s human population. Small riparian farmers and conservationists have sought regulation of groundwater withdrawals and restoration of streamflows from historic plantation diversions that were designed to capture 100% of base flows (Figure 2-18). This battle has pitted developers, agribusiness interests, and the county against small farmers, Native Hawaiians, and conservationists. It has been before the State Commission on Water Resource Management and is currently on appeal to the Hawai’i Supreme Court (Commission on Water Resource Management, 2010).
As on O’ahu, rainfall and base flow on Maui show a statistically significant long-term decline (Figures 2-5, 2-8). Recent data (Giambelluca et al., 2011) suggest that this trend could continue, with profound consequences for the island’s water resources.
On the leeward side of Hawai’i Island, an emerging dispute over the allocation of water focuses on the effects of water use on groundwater-dependent ecosystems. Water demand is being driven by significant resort, commercial, and residential development. According to the 2010 US Census, population in the North Kona and South Kohala areas increased more than 30% in the past decade. With few streams on this part of the island, water needs must be met by groundwater. The underlying hydrology is poorly understood, however, and the state’s calculation of sustainable yields depends on a simple mathematical model (Oki & Meyer, 2001). Water-planning documents that estimate consumption show demand likely to exceed the sustainable yield in most growth scenarios (Hawai’i County, 2010).
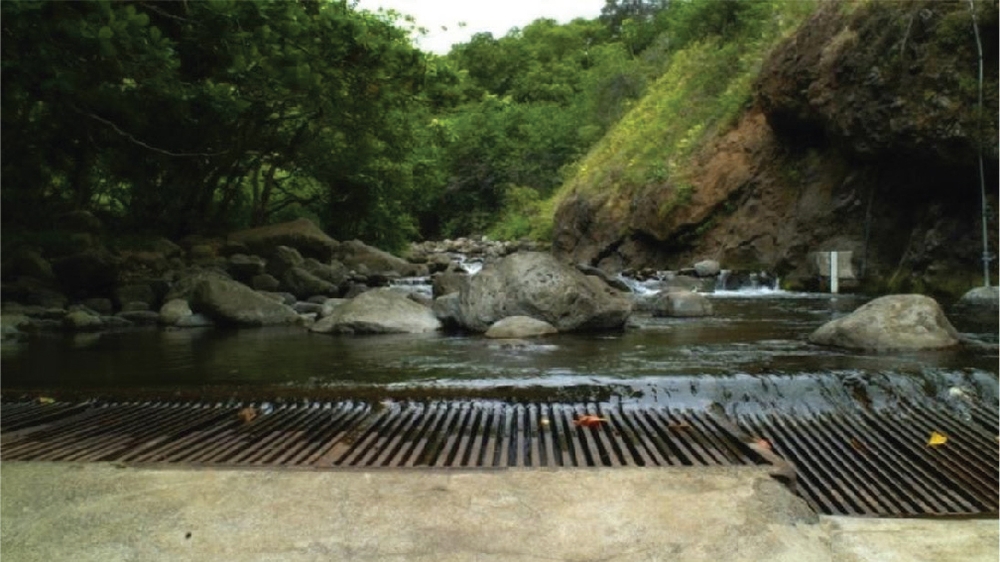
Figure 2-18 In Maui’s ’Īao Valley, conservationists and small farmers would like to restore historic streamflows away from plantation-era diversions that capture all base flow. Proponents of restoring historic flow levels would like to use the water for traditional cultural and agricultural practices and for restoring the habitat of native species. (Courtesy of Jonathan L. Scheuer.)
Important coastal resources with dual ecological and cultural significance depend on groundwater. These include anchialine pools (Figure 2-19), coral reefs, and Native Hawaiian fishponds. They may be significantly affected by increased groundwater withdrawals (Oki, 1999). Current work to model these systems and integrate new recharge and rainfall data may lower estimates of what withdrawal levels will be sustainable.
In these and other emerging situations, changing climate may well intensify water disputes that already tend to be the most difficult, unresolved public policy issues in the islands. While some policy tools (such as the Public Trust and the Precautionary Principle) may help resolve these conflicts, it is likely that disputes will multiply and intensify as demand for water increases, possibly in the face of diminishing supply.

Figure 2-19 Anchialine pools, such as the Kuki’o Pools on Hawai’i Island, are unique environments found only in the coastal tropics and sub-tropics. The pools have no surface connection to the ocean yet can range from fresh to brackish. Anchialine pools are critical habitat for several rare and endemic species, such as opaé ula red shrimp, snails, and insects. (©2010 Rosa Sey, “One of the Kuki’o anchialine ponds,” used under a Creative Commons Attribution-NonCommercial-NoDerivs license.)