Appendix I
Building a Portfolio That Lasts Forever
We have included in this appendix a series of exhibits which aims to give you a more visual understanding of why Rob Kirby’s investment approach (adapted for Indian conditions) consistently delivers market-beating returns. We begin with a histogram of the Sensex which shows that in twenty-one out of the last thirty-one years (i.e. in 68 per cent of the years), the Sensex has delivered positive returns. In these twenty-one years of positive returns, in the majority of the years, the Sensex has given returns below 30 per cent per annum.
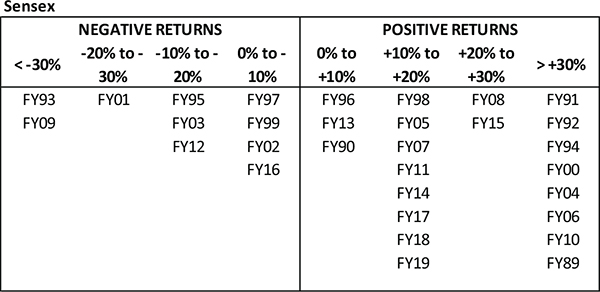
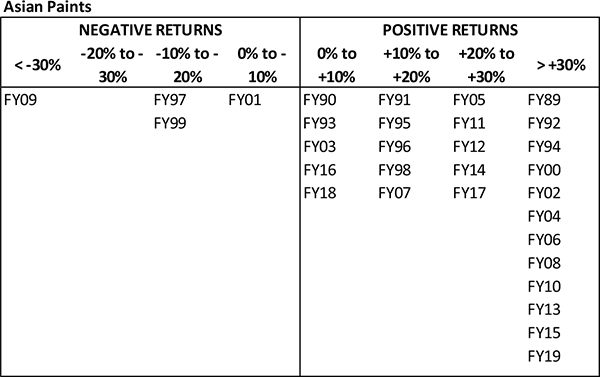
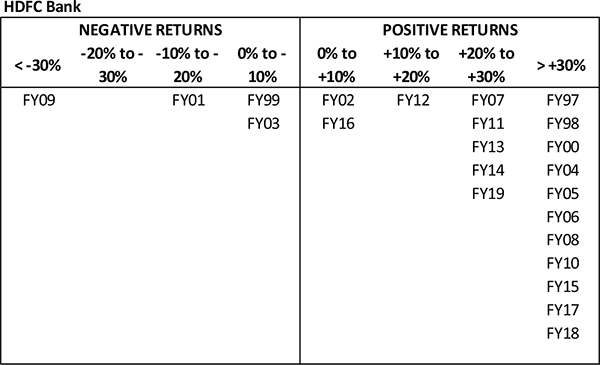
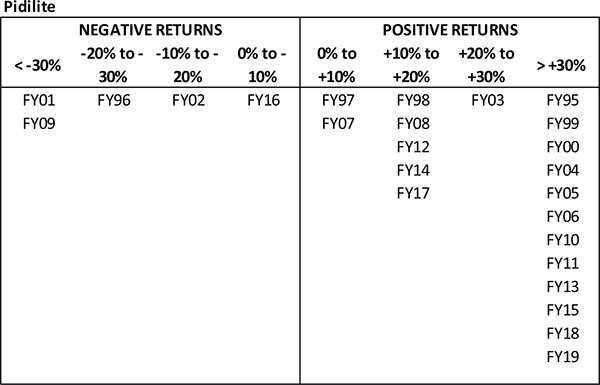
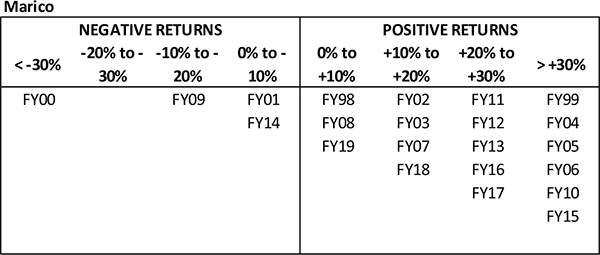
The stock-specific histograms that follow are those of typical companies identified employing the investment approach enumerated in the final section of Chapter 9 (‘Simplifying Idea 3: Robert Kirby and Coffee Can Investing’). We have shown that for these companies:
- Positive returns occur with significantly greater consistency than with the Sensex. Most companies which pass our filters delivered positive returns in twenty-six out of thirty-one years, i.e. in 84 per cent of the years as opposed to 68 per cent for the Sensex.
- In the years in which returns are positive, these companies’ returns are typically above 30 per cent per annum.
- The years in which these companies give negative returns (such as FY99, FY01 and FY09) are typically followed by years in which these companies give returns above 30 per cent per annum.
Finally, in the last exhibit shown in this appendix, we have crunched the data from all the iterations of Kirby’s investment approach to illustrate what is happening over long periods of time. Firstly, for any portfolio, the returns improve with time (we call this the ‘patience premium’). Secondly, if you invest in a high-quality portfolio such as the ones which we have built in Chapter 9 of this book, you improve your returns further (we call this the ‘quality premium’).



The risk-reward trade-off in Kirby’s investment approach relative to the Sensex and government bonds*
* Source: Marcellus Investment Managers, Ace Equity. The return from Kirby’s investment approach is the average of all portfolio iterations highlighted in Chapter 9 of this book.