Chapter 16
Planned Amortization Class (PAC) and Companion REMICs
A planned amortization class, or PAC bond, is a REMIC class structured with a sinking fund schedule. A PAC bond provides protection against both faster and slower prepayment rates as long as they remain within the PAC bond's structuring bands. A PAC bond is said to provide both call and extension protection. The prepayment protection and subsequent cash flow certainty of the PAC bond is provided by the companion bond. The companion bond, also referred to as a support bond, absorbs the PAC bond's prepayment risk.
The reallocation of prepayment risk between the PAC and companion bonds is achieved via the division of principal. However, rather than parsing principal across time like a sequential structure, the PAC-Companion structure asymmetrically distributes prepayment risk across the transaction; irrespective of time, the companion bond assumes the prepayment risk—the early return of principal—shunned by the PAC bond.
16.1 The PAC Bond Sinking Fund Schedule
The PAC bond's principal repayment schedule is determined as follows:
- Calculate the projected principal cash flows, scheduled and unscheduled (prepaid), of the underlying collateral at both the lower and upper PSA bands used to structure the PAC bond. The structuring rule used to determine the PAC projected principal cash flow is as follows:
where: MP = Monthly principal (scheduled and unscheduled) - Once the PAC principal repayment schedule is determined, the original balance of the PAC bond at deal inception is equal to the summation of the expected PAC principal cash flows:
- Finally, to complete the structure, compute the companion balance. By extension of equation 16.2, the companion bond original balance is the remaining balance of the structure's underlying collateral.16.3


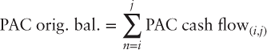
Figure 16.1 illustrates the determination of the PAC bond's principal repayment schedule. In the earlier months the principal repayment schedule is determined by the lower structuring band. During this time a slower prepayment assumption results in a lower return of principal. In the later months, the schedule is determined by the upper structuring band. The intuition is relatively straightforward: Given the upper structuring assumption and the passage of time eventually the collateral balance outstanding declines to a point such that despite its faster prepayment rate the upper limit principal repayment is not sufficient to continue yielding principal repayments exceeding those given bythe lower structuring assumption. Once this inflection point is reached, the PAC principal repayment schedule is determined by the upper structuring band.
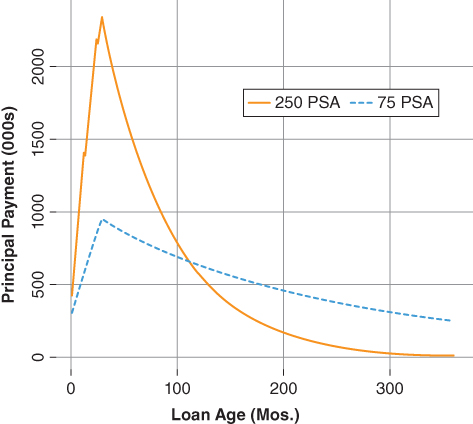
Figure 16.1 PAC Bond Schedule
Using the PAC bond structuring technique outlined above, a dealer is able to structure REMIC classes that offer a certain degree of both call and extension protection. Notice, the PAC bond's allocation of principal is independent of time meaning that prepayment risk is allocated across the capital structure between the PAC and its companion class.
Figure 16.2 graphically illustrates the expected principal cash flows of a PAC bond collateralized by a 4.00% 30-year MBS. Initially, principal prepayments exhibit a monthly increase due to both scheduled principal and seasoning (section 9.2). Once the collateral balance declines to the point at which the upper band principal repayment 16.1 is less than that of the lower band the PAC schedule takes on a markedly steeper slope.
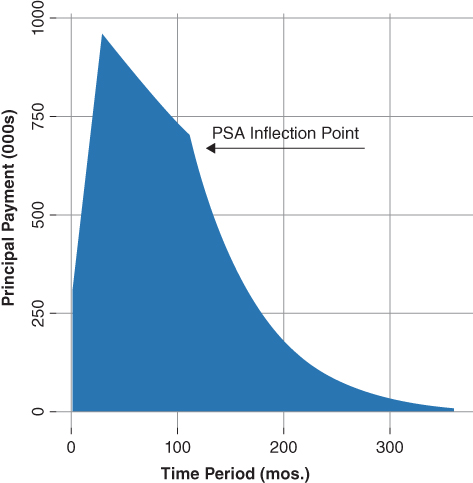
Figure 16.2 PAC Bond Schedule
Initially, based on the above discussion one may conclude the PAC principal payment schedule represents a fixed amount that must be paid to the PAC bond each month. Although this conclusion is conceptually appealing it is not the case. In fact, there may be times when the collateral's prepayment rate is so slow it does not cover the PAC bond's scheduled principal payment. With the former in mind, it becomes evident that the PAC principal payment schedule represents a cumulative amortization target, which, in turn, requires the establishment of the PAC bond's targeted principal balance. The targeted principal balance is used in the REMIC's waterfall payment rules to allocate the principal payments to the PAC and its companion bond.
Table 16.1 illustrates the point based on the cash flow profile presented in Figure 16.2. In the first period, the original balance of the PAC is $148,769,215 and the PAC's scheduled principal payment is $301,663, resulting in a target balance of $148,467,552.
- Assume the underlying collateral reported a prepayment in period one that is less than the lower band PSA target amount, returning $201,663 instead of $301,663. As a result, the PAC bond outstanding balance is $148,567,552—greater than the targeted balance.
- In the second period, the principal returned by the underlying collateral is also less than scheduled PAC principal, again due to a slower prepayment rate than the lower PSA structuring band. In all, the PAC bond is now $200,000 behind schedule ($148,140,045 − $148,340,045).
- In the third period, the underlying collateral returns $400,000, which is more than the amount scheduled in the period. The PAC bond receives the scheduled amount plus any shortfall from the targeted amount—in this case the PAC bond is paid the full $400,000, which is more than the scheduled amount of $353,298. Thus far, the PAC bond is $153,298 behind schedule.
- In the fourth period, the underlying collateral returns $550,000. The PAC bond receives a $532,295 principal payment and is brought to its scheduled balance while the companion bond is paid the remaining principal amount $17,705.
Table 16.1 PAC Bond Cash Flow Example
| Period | PAC Bond Target Bal. | PAC Bond Sched. Pmt. | Actual Principal Pmt. | Actual PAC Bond Ending Bal. |
| 1 | $148,769,215 | $301,663 | $201,663 | $148,567,552 |
| 2 | $148,467,552 | $327,507 | $227,507 | $148,340,045 |
| 3 | $148,140,045 | $353,298 | $400,000 | $147,940,045 |
| 4 | $147,786,747 | $378,997 | $550,000 | $148,467,581 |
The PAC's target balance is established using equation 16.1. In turn, the target balance is used to determine the principal payment needed to bring the PAC's ending balance equal to its target balance, in the same period. As illustrated in Table 16.1, the principal paid in any period is equal to the beginning balance less the target balance in the period. With the above example in mind, the bondlabPAC waterfall cash allocation rules may be expressed as follows:
- {Pay 100% of available interest to each class pro-rata, based on each class's respective accrued interest}
- {Pay 100% of the available principal in the following order:}
- Pay principal to Tranche 1, the PAC bond, the minimum of:
- The amount required to bring its period outstanding balance equal to the period PAC target balance.
- The PAC bond beginning balance.
- Pay the remaining principal received in each period to tranche 2, the companion bond, until its balance is reduced to zero.
- Once the companion bond balance is reduced to zero, pay to the PAC bond the minimum of:
- The PAC bond period beginning balance.
- The PAC bond beginning balance less the principal paid in (1) above,
until the PAC bond balance is reduced to zero.
- Pay principal to Tranche 1, the PAC bond, the minimum of:
Together the PAC sinking fund schedule and the waterfall payment rules highlight the structural support provided to the PAC bond by the companion bond. Indeed, a companion bond is often referred to as a support bond reflecting the market's recognition of the additional cash flow support provided to the PAC bond by the companion bond.
Notice, the first payment priority in the principal waterfall 1.(a). The payment rule maintains the PAC bond's targeted balance schedule thereby regulating its average life profile. For example, should the prepayment rate slow-down and there isinsufficient principal to maintain the PAC's scheduled balance, then the entire principal amount is paid to the PAC bond and none to the companion bond.
- Payment priority 1.(a) limits the PAC bond's extension risk while increasing that of the companion bond.
Payment priority 2 directs the excess principal to the companion bond. Thus, should the prepayment rate speed-up resulting in more than sufficient principal to maintain the PAC's scheduled balance, then principal exceeding that required to bring the PAC to its scheduled balance is directed to the companion bond.
- Payment priority 2 limits the PAC bond's call risk while increasing that of the companion bond.
Payment priority 3 indicates that the structural relationship between the PAC and companion bond exists so long as the companion bond's outstanding principal balance is greater than zero. Once the companion bond is paid-down to zero, the PAC bond's outstanding principal balance is equal to the collateral's outstanding balance and the PAC bond's structuring bands are extinguished—that is, they no longer apply to the principal payment rules. Once the companion bond is paid to zero the transaction's structural enhancements are exhausted and the PAC bond is referred to as a broken PAC.
Figure 16.3 illustrates the point. Assuming the underlying collateral repays at 350 PSA, above the PAC bond's upper structuring band, the PAC bond breaks at month 36, the point at which the companion bond's outstanding balance is retired. The companion bond is retired early because the prepayment speed applied over the life of the transaction is above the upper structuring band. Consequently, principal repayments, both scheduled and prepaid, exceeding the PAC's scheduled payments are directed to the companion bond. Once the companion bond's balance reaches zero the PAC's structuring bands are extinguished the PAC bond begins to pay-down at a faster rate than that set by its scheduled balance.
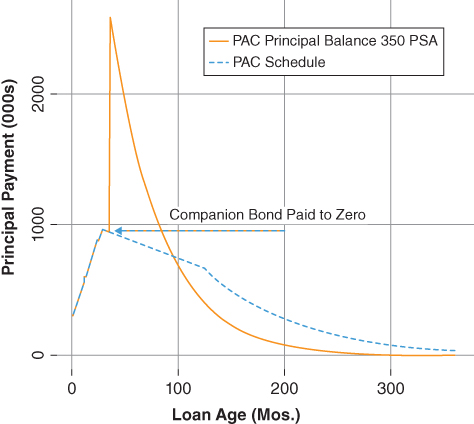
Figure 16.3 Broken PAC Bond Principal Repayment vs. Scheduled
The allocation of principal via the application of a scheduled payment (along the capital structure) alters both the magnitude and timing of the principal cash flow to the investor. The magnitude of principal returned is managed by the structural element of the transaction, namely, the PAC bond's sinking fund schedule. In the event the realized prepayment rate is either below or above the PAC's structuring bands, the timing of the principal cash flow to the investor is also changed.
Table 16.2 summarizes key metrics of the PAC-Companion transaction. Notice, the longer average life of the companion bond relative to that of either the underlying collateral or the PAC bond. The longer average life is the result of the transaction's structuring rule (equation 16.1), which results in the companion bond receiving a greater relative share of the backloaded cash flows. Another point of interest is that the companion bond, despite its longer average life, reports a lower effective duration relative to the PAC bond, an indication of its callable nature. Finally in the example presented, both the PAC and companion bonds are priced at a premium.
Table 16.2 REMIC PAC-Companion Analysis
| MBS 4.00% | Tranche 1 (PAC) | Tranche 2 (Companion) | |
| Net Coupon: | 4.00% | 3.00% | 6.33% |
| Note Rate: | 4.75% | 4.75% | 4.75% |
| Term: | 360 mos. | 360 mos. | 360 mos. |
| Loan Age: | 0 mos. | 0 mos. | 0 mos. |
| PAC Band (PSA) | 75–250 PSA | ||
| Orig. Bal. | $148.7mm | $51.3mm | |
| Price: | $105.75 | $105.00 | $110.00 |
| Yield to Maturity | 3.26% | 2.38% | 5.67% |
| Spot Spread | 1.33% | 0.40% | 3.32% |
| Pricing WAL: | 9.81 | 8.97 | 13.5 |
| First Principal Pmt: | 01-2013 | 01-2013 | 01-2016 |
| Last Principal Pmt: | 12-2042 | 11-2042 | 11-2042 |
| Modified Duration | 7.72 | 7.96 | 8.43 |
| Convexity | 49.9 | 51.2 | 71.2 |
| Effective Duration | 7.13 | 7.19 | 2.60 |
| Effective Convexity | −15065 | 307 | 6236 |
Dealers typically create newly issued bonds at par to meet investor preference. The need to create par-priced bonds illustrated in both this chapter and the previous chapters highlights the importance of derivative execution in a successful REMIC issuance, which is dependent on both the allocation of principal and interest. Interest allocation strategies will be presented in later chapters.
16.2 Key Rate Duration Analysis
Figures 16.4 and 16.5 illustrate how the allocation of principal via a sinking fund schedule alters the key rate duration profile of the PAC bond relative to that of the underlying collateral. The PAC bond's short-dated key rate tenors are, in the aggregate, modestly longer than those of the underlying collateral while the long-dated key rate tenors are less than those of the underlying collateral. The key rate duration analysis implies the PAC bond is more sensitive to the shorter tenors of the curve than is the underlying collateral. Further, notice the PAC bond's higher 10-year key rate duration relative to the collateral, implying greater sensitivity to prepayment expectations. The PAC bond's greater sensitivity to the 10-year, and by extension mortgage prepayment expectations, is a direct result of the structural elements employed in the transaction—the PAC sinking fund schedule.
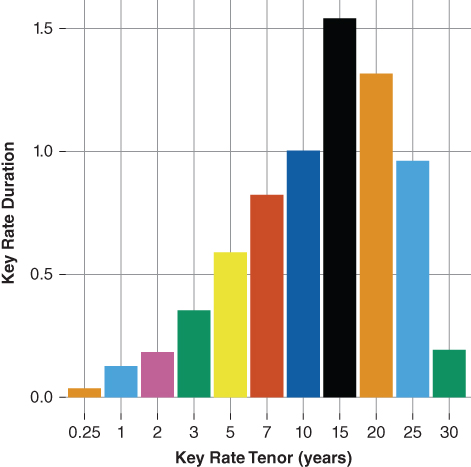
Figure 16.4 Key Rate Duration MBS 4.00%
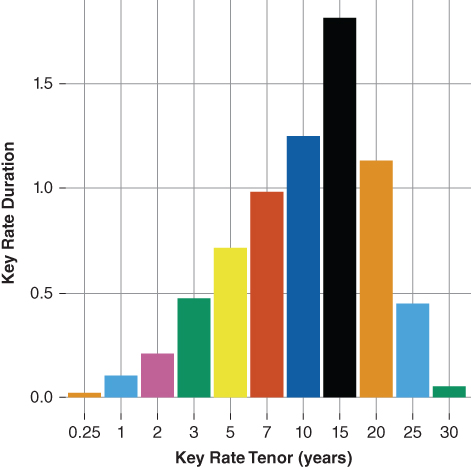
Figure 16.5 Key Rate Duration Tranche 1 (PAC)
Figures 16.6 and 16.7 illustrate the companion bond's key rate duration profile relative to that of the underlying collateral. The companion bond exhibits greater exposure to the short tenor key rates than does either the underlying collateral or the PAC bond. Furthermore, the companion bond reports a negative 10-year key rate exposure, which in absolute terms is greater than those of either the collateral or PAC bond, which indicates it is more leveraged against mortgage prepayment rates than is either the underlying collateral or the PAC bond.
- The companion bond's negative 10-year key rate duration is a reflection of its callable nature (equation 3.8). Indeed, the key rate duration analysis presented in Figures 16.5 and 16.7 suggests the PAC bond investor has “purchased” prepayment protection from the companion bond investor which is evident in the relative yield to maturity difference between the two: the companion bond offers a higher yield to maturity.

Figure 16.6 KRD MBS 4.00%
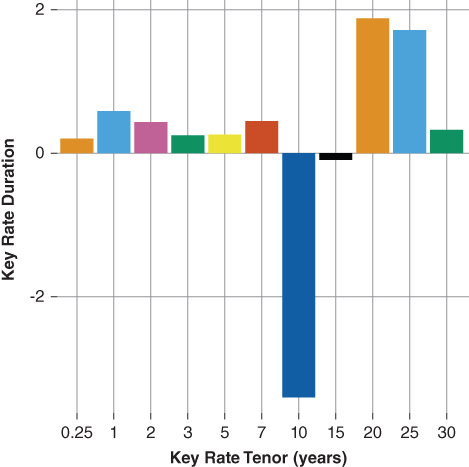
Figure 16.7 KRD Tranche 2 (Comp.)
16.3 Option-Adjusted Spread Analysis
The option-adjusted spread analysis presented in Table 16.3 further illustrates how the division of principal along the capital structure alters the valuation of MBS cash flows. The PAC bond's OAS is negative indicating the tranche is priced “rich” relative to either the collateral or the companion bond. The PAC bond's ZV spread is less than its spread to the curve indicating the cost of amortizing cash flows along the curve is 22 basis points. Notice the curve cost is greater for the companion bond, due to the fact that its cash flows are heavily back loaded.
Table 16.3 REMIC PAC-Companion OAS Analysis
| MBS 4.00% | Tranche 1 (PAC) | Tranche 2 (Companion) | |
| Net Coupon: | 4.00% | 3.00% | 6.30% |
| Note Rate: | 4.75% | 4.75% | 4.75% |
| Term: | 360 mos. | 360 mos. | 360 mos. |
| Loan Age: | 0 mos. | 0 mos. | 0 mos. |
| Price: | $105.75 | $105.00 | $110.00 |
| Yield to Maturity | 3.33% | 2.39% | 5.67% |
| OAS | 0.52% | −0.14% | 1.34% |
| ZV-Spread | 1.28% | 0.44% | 2.91% |
| Spread to the Curve | 1.52% | 0.66% | 3.29% |
| Effective Duration | 7.13 | 7.19 | 2.60 |
| Effective Convexity | −15065 | 307 | 6236 |
The PAC bond OAS is negative and its option cost (58 bps) is less than that of either the underlying collateral (76 bps) or the companion bond (157 bps). The lower option cost of the PAC bond is due to the structural element employed—the sinking fund schedule—and reflects the prepayment protection afforded by the PAC schedule. The higher option cost of the companion bond reflects the transfer of prepayment risk from the PAC bond to the companion bond. Indeed, the companion bond's option cost is greater than that of the underlying collateral. The option-adjusted spread presented in Table 16.3 further reinforces the notion that the PAC bond investor has effectively transferred prepayment risk to the companion bond investor in exchange for a lower yield.
16.4 OAS Distribution Analysis
Additional insight may be gleaned by examining the output of the short-term rate simulation. Examination of the weighted average life distribution allows the investor to examine the degree to which prepayment risk was transferred between the PAC and companion bonds. The spot spread distribution helps to quantify the degree to which the presence of the structural element—the PAC bond sinking fund schedule—alters the valuation of the MBS cash flows across the capital structure.
16.4.1 PAC WAL and Spot Spread Distribution Analysis
Figures 16.8 and 16.9 illustrate the average life profiles of the underlying collateral and that of the PAC bond. The PAC bond exhibits a weighted average life distribution that lies within that of its underlying collateral.
- The minimum average life of the PAC bond's distribution is 8.6 years while that of its collateral is 7.9 years.
- Similarly, the maximum average life of the PAC bond's distribution is 10.4 years while that of its collateral is 11.49 years.
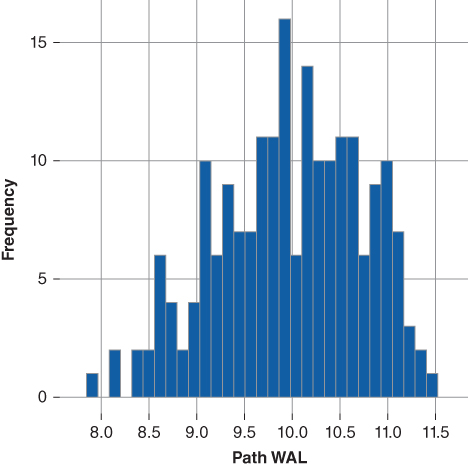
Figure 16.8 WAL Dist. MBS 4.00%
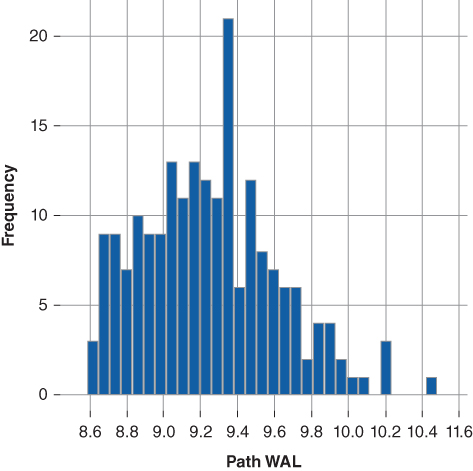
Figure 16.9 WAL Dist. PAC
Overall, the OAS weighted average life analysis indicates the PAC bond does offer somewhat more certainty in terms of weighted average life vis-a-vis the collateral. However, the distribution analysis suggests that over time the PAC bond's underlying structural element degrades and as a consequence the PAC bond's average life profile slowly begins to resemble that of its underlying collateral.
Figures 16.10 and 16.11 illustrate the spot spread distribution of the PAC bond and its underlying collateral. Notice the downside tail risk—potential negative spot spread—of the PAC bond relative to its collateral which contributes to the PAC bond's negative OAS. The negative tail risk is a function of the PAC bond's call risk. That is, given a strong downward trajectory of the short-term spot rate prepayments are expected to increase. Recall, a prepayment rate consistently above the upper PAC band will ultimately result in a broken PAC or loss of prepayment protection as the companion bond's outstanding balance is paid down faster relative to that of the PAC bond. Table 16.3 clearly shows that the PAC bond investor accepts both a lower yield and option adjusted spread in exchange for the prepayment protection afforded by the PAC schedule. However, once the PAC's bands are exhausted the PAC bond is as equally callable as its underlying collateral. In turn, the faster prepayment rates result in a lower spot spread.
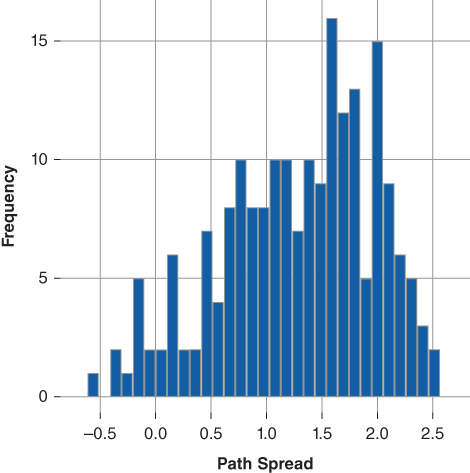
Figure 16.10 Spot Spd. MBS 4.00%
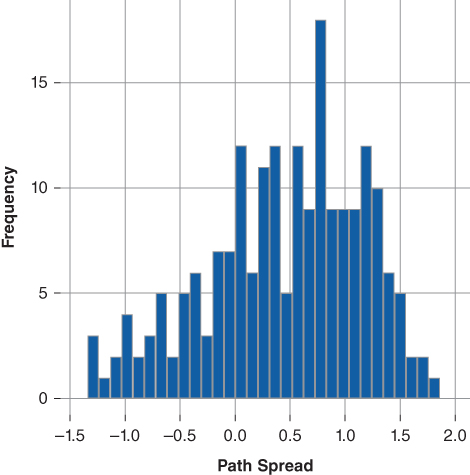
Figure 16.11 Spot Spd. Dist. PAC
16.4.2 Companion WAL and Spot Spread Distribution Analysis
An examination of the companion bond's weighted average life and spot spread distributions highlight the extent to which prepayment risk is transferred from the PAC bond to the companion bond. In addition, the distribution analysis aids the investor in quantifying the influence of the companion bond's sharply negative 10-year key rate duration.
Figures 16.12 and 16.13 illustrate the average life profile of the companion bond and that of its underlying collateral. The companion bond's underlying WAL distribution lies outside that of its underlying collateral.
- The companion bond's minimum weighted average life is 1.8 years while the underlying collateral's weighted average life is 7.9 years.
- The companion bond's maximum weighted average life is 14.5 years while the underlying collateral's weighted average life 11.49 years.
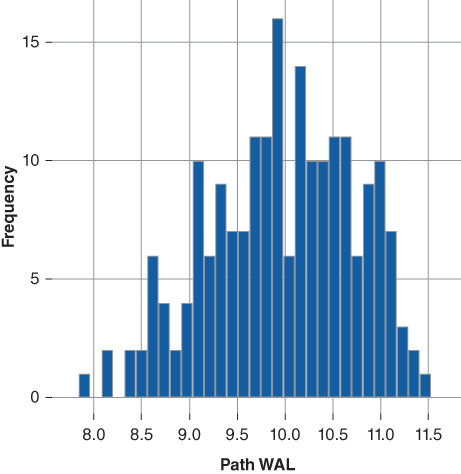
Figure 16.12 WAL Dist. MBS 4.00%
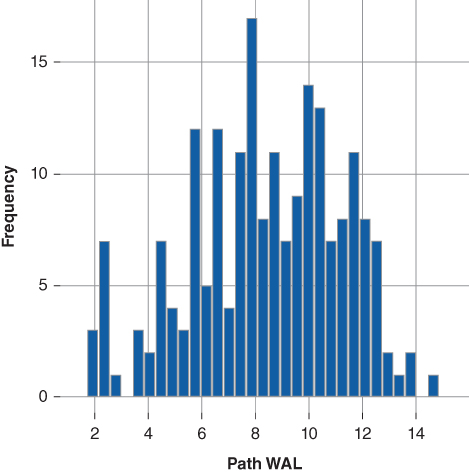
Figure 16.13 WAL Dist. Companion
Overall, the OAS weighted average life analysis indicates the companion bond has less cash flow certainty than the underlying collateral. The companion bond exhibits both greater call and extension risk than does the underlying collateral, which reflects its strongly negative 10-year key rate duration and by extension its leverage against borrower prepayment.
Figures 16.14 and 16.15 show the spot spread distributions. The companion bond, unlike either the PAC bond or the underlying collateral does not report a negative spot spread. Furthermore, the companion bond's spot spread distribution exhibits both more dispersion, suggesting a greater range of possible outcomes relative to the underlying collateral, and its distribution is shifted to the right, which improves its overall tail risk relative to its underlying collateral.

Figure 16.14 Spot Spread MBS 4.00%
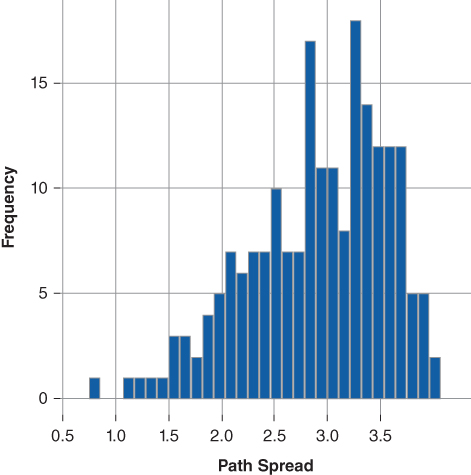
Figure 16.15 Spot Spread Dist. Comp.
Together, the option-adjusted spread analysis (Table 16.3) and the distribution analysis suggest the PAC bond pricing is rich relative to the underlying collateral, while the companion bond is priced cheap relative to the underlying collateral. Naturally, one would expect such a finding since REMIC arbitrage is dependent on creating a greater relative share of “rich” cash flows (PAC bond) based on investor preferences, than “cheap” cash flows (companion bond). However, the spot spread distribution analysis suggests that the companion bond, given its pricing, may offer better relative value than the underlying collateral.
16.5 A Final Word Regarding PAC Bands
A PAC bond may be created such that it provides more or less prepayment protection. For example, a PAC bond structured with wider bands will provide more prepayment protection than a PAC bond structured with narrower bands. The PAC scheduled principal rule (equation 16.1) dictates a declining PAC bond original balance as the PAC bands widen. Thus, by extension, the ratio of PAC bond principal to companion principal declines as the PAC bands widen:
- A wider PAC band results in stable PAC and companion bonds. The intuition is as follows:
- The wider PAC band provides more prepayment protection to the PAC investor.
- As the PAC band range increases the ratio of the PAC principal to the companion principal falls.
- As the PAC to companion principal ratio falls the inverse increases—contributing to the average life stability of the companion bond.
- As the ratio of the companion bond to underlying collateral increases, the companion bond's average life profile will begin to mirror that of the underlying collateral. Thus, it is reasonable that as the outstanding balance of the companion bond converges to that of the underlying collateral its average life profile will become more stable, the extent to which is limited by the underlying collateral.
16.5.1 PAC Band Drift
The discussion above clearly illustrates PAC bands are not constant over time. Indeed, PAC bands tend to drift with the ebb and flow of mortgage prepayment rates, a phenomenon known as PAC band drift. Following the previous intuition we can formulate general rules describing the expected PAC band drift:
- In the event the collateral's prepayment rate remains consistently below the lower end of the PAC's PSA band the ratio of the PAC bond's principal balance outstanding to that of the companion declines. Recall from the above, when structuring a PAC-Companion transaction wider bands are associated with a lower PAC:Companion ratio.
- Under the slower prepayment scenario, the lower band falls and the upper band goes up; the PAC band widens.
- Should the collateral's prepayment rate remain consistently above the upper end of the PAC's PSA band the ratio of the PAC principal balance outstanding to that of the companion increases. Again, when structuring a PAC-Companion transaction narrow bands are associated with a higher PAC:Companion ratio.
- Under the faster prepayment scenario, the lower band goes up and the upper band falls; the PAC band narrows.
16.6 Static Cash Flow Analysis
Static cash flow analysis further illustrates the points above. Figure 16.16 presents the average life analysis of the PAC and companion bonds across seven prepayment scenarios ranging from 50 to 350 PSA.
- Notice, within the 100 to 150 PSA PAC bands, the PAC bond's average life is stable at 9.02 years, while the companion bond reports a more volatile average life between 15.8 year to 7.8 years. Specifically, given a faster PSA assumption the companion bond must absorb greater principal repayment, reducing itsaverage life. Conversely, under a slower PSA assumption, principal repayment is directed to the PAC bond and away from the companion bond extending its average life.
- Both the PAC and companion average lives shorten under faster PSA assumptions—the PAC to a lesser degree.
- Both the PAC and companion bond average lives extend under a slower PSA assumption—the companion bond to a greater degree. The PAC bond average life extends modestly to 10.19 years while that of the companion bond extends to 24.12 years.
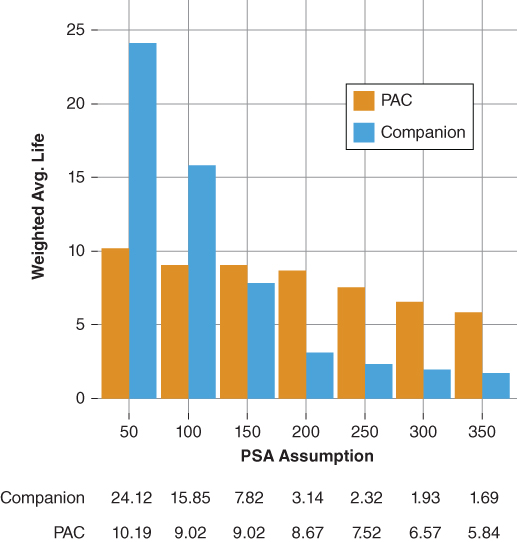
Figure 16.16 Average Life Analysis