Chapter 19
Accrual REMIC Z-Bond
An accrual class is used to manage the average life profile of another class in the structure. The accrual bond's ability to manage the average life profile of another class is achieved by redirecting its interest payment due as principal paid to that class whose average life it supports. To accomplish the redirection of its interest payment the accrual bond's principal balance increases—accrues—at the stated coupon rate. Once the targeted class's balance is reduced to zero the accrual bond's outstanding principal balance is paid down to zero. Thus, the accrual bond is conceptually similar to that of a zero coupon bond; hence, its acronym Z-bond.
A Z-bond is typically used in either a sequential structure or a PAC-Companion structure to manage extension risk. However, more often than not the Z-bond is viewed by the dealer as a structural enhancement that is used to clean up tail cash flows as well as manage extension risk.
Structurally, the Z-bond is an example of the division of principal. At first blush, considering the Z-bond as an example of the division of principal seems somewhat counterintuitive since its payment waterfall rule is based on the redirection of interest. However, the redirected interest is used to accomplish the following:
- Pay down the principal balance of the targeted class.
- Determine the amount by which the Z-bond's principal balance is accrued.
The Z-bond structure achieves the division of principal through the redirection of interest. Further, the Z-bond represents a subtle truism of structuring; once the collateral's cash flow is deposited into the trust, both principal and interest become mutually interchangeable.
The Z-bond example builds on the earlier PAC-Companion structure. The BondLabPACZ transaction illustrates the use of a Z-bond to manage the companion bond's average life profile. The BondLabPACZ waterfall rules may be written as follows:
- { Pay 100% of available interest to each class pro-rata, based on each class's respective accrued interest}
- { Pay 100% of the available principal in the following order:}
- Pay principal to Tranche 1, the PAC bond, the minimum of:
- The amount required to bring its period outstanding balance equal to the period PAC target balance.
- The PAC bond beginning balance.
- Pay to Tranche 2, the companion bond, as principal from the accrued interest to be paid to the Z-bond.
- Tranche 3, the Z-bond, beginning balance is increased up to the interest amount used to pay as principal to Tranche 2, the companion bond.
- Pay the remaining principal received in each period to Tranche 2 until its balance is reduced to zero.
- Pay to Tranche 3, the Z-bond, from the remaining collateral principal until its adjusted balance (Adjusted balance = Beginning balance + Amount paid in step 3) is reduced to zero.
-
Once the companion bond balance in reduced to zero, pay to the PAC bond the minimum of:
- The PAC bond period beginning balance.
- The PAC bond beginning balance less the principal paid in (1) above,
until the PAC bond balance is reduced to zero.
- Pay principal to Tranche 1, the PAC bond, the minimum of:
Recall, in the BondLabPAC transaction the companion bond is sized to $52.2 million. In our example, the companion classes consist of both the companion bond and the Z-bond, which is sized to an original balance of $15 million. The Z-bond manages the average life profile of the companion bond and cleans up its tail cash flows. Figure 19.1 summarizes the PAC-companion-Z structure.
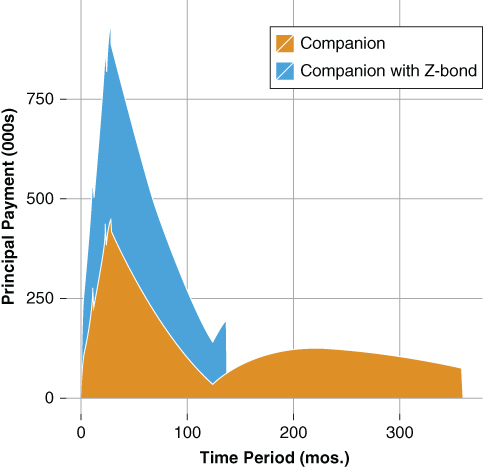
Figure 19.1 Comparison of Companion Bond Execution
Notice, neither the PAC nor companion class is structured to a “market” or par coupon execution. Rather, all classes are structured such that the class coupon is equal to that of the underlying collateral (Table 19.1). In addition, the PAC class price required to make the REMIC arbitrage is $108, significantly above par. Further, both the PAC and companion class OAS valuations are relatively low, suggesting efficient execution of the Z-bond structure requires a relatively rich valuation of the PAC class. Additionally, the dealer would likely strip the PAC class to achieve par execution. From Chapter 14, coupon stripping, given an IO price of $24, the dealer may strip 125 bps, bringing the PAC price down to $100.5, creating an IO with a minimum value of $7.50.
Table 19.1 REMIC PAC-Companion-Z OAS Analysis
| MBS 4.00% | Tranche A (PAC) | Tranche B (Companion) | Tranche C (Z-bond) | |
| Net Coupon: | 4.00% | 4.00% | 4.00% | 4.00% |
| Note Rate: | 4.75% | 4.75% | 4.75% | 4.75% |
| Term: | 360 mos. | 360 mos. | 360 mos. | 360 mos. |
| Loan Age: | 0 mos. | 0 mos. | 0 mos. | 0 mos. |
| Orig. Bal. | $148.7mm | $36.3mm | $15.0mm | |
| Price | $105.75 | $108.00 | $103.00 | $101.00 |
| Yield to Maturity | 3.26% | 2.97% | 3.31% | 3.86% |
| OAS | 0.52% | 0.06% | −0.40% | 1.21% |
| ZV-Spread | 1.33% | 1.06% | 1.21% | 1.29% |
| Spread | 1.52% | 1.24% | 1.70% | —% |
| Effective Duration | 7.13 | 7.01 | 3.71 | 16.8 |
| Effective Convexity | −15056 | 862 | 810 | 3325 |
As stated earlier, the purpose of the Z-bond is to manage the average life of the companion bond as well as clean up its tail cash flows. Figure 19.1 illustrates a comparison between the principal cash flow of the companion bond presented in Chapter 16 absent the Z-bond execution and the companion bond cash flow given the Z-bond execution. Notice the following:
- The companion with Z-bond execution reports greater principal received in each period. Recall the Z-bond interest is redirected to the companion bond as principal. Consequently, the companion with a Z-bond reports greater principal paid in any given period than that of a comparable companion bond without a Z-bond.
-
The companion with Z-bond execution also reports a shorter principal payment window. The presence of the Z-bond cleans up the companion cash flow relative to that of a comparable companion bond without a Z-bond execution.
The net effect of this structuring strategy:
- The companion receives more principal earlier.
- As a result, the companion bond's average life is reduced because its tail cash flows are eliminated by the Z-bond.
The remainder of this chapter focuses on analysis of the Z-bond. In the PAC-companion-Z bond structure, the Z-bond serves as the companion bond of last resort to the PAC bond. Given the intent of the Z-bond is management of the companion bond's average life profile, and the purpose of a companion bond is the management of the PAC's sinking fund schedule, the Z-bond should exhibit greater average life variability than either the PAC or companion bond.
Figure 19.2 compares the average life profiles of the PAC, companion, and Z-bond from 50 to 350 PSA. It shows that the PAC bond offers a stable average life across the full range of the PSA scenarios analyzed. The companion bond exhibits slightly more extension and call risk across the PSA scenario range than that of the PAC bond while the Z-bond exhibits the greatest average life variability across the PSA scenarios.
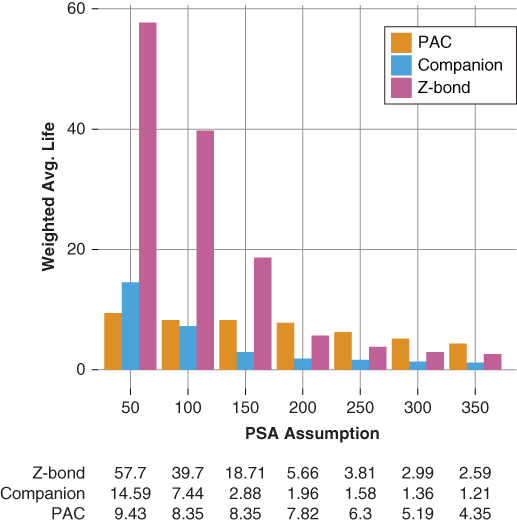
Figure 19.2 Average Life Analysis
Indeed, under the slowest prepayment scenarios (50 and 100 PSA), the average life of the Z-bond is greater than that of the underlying collateral. At first blush, one may ask, how can the Z-bond report a greater average life than that of the collateral?
- Z-bond interest payments are deferred and capitalized as principal. Thus, the amount of principal returned is greater than original face amount.
- A slower prepayment assumption extends the timing of the return of principal, increasing the time weight used in the average life calculation.
Together, these principles produce an average life exceeding that of the underlying collateral. Of course, one may argue that the average life may be calculated based on the maximum accrued current balance—or principal returned—thereby reducing the average life and bringing it in line with the expectation relative to the underlying collateral. Recall, from equation (3.4) the average life calculation is based on the face value or total principal of a bond. Indeed, at new issue the face value of the Z-bond presented is $15 million. However, its principal accrues at the coupon rate. Thus, at the time of the return of principal to the investor, the Z-bond's face value has gone up. Consequently, if one were to calculate the average life of the Z-bond based on the sum of the principal returned as opposed to its original principal amount, the conceptual equivalent of its face amount, the average life of the Z-bond falls to 24.4 years—still longer than that of the collateral.
Nonetheless, for purposes of exposition and to further illustrate the impact of the redirection of principal as capitalized interest the Z-bond's average life is reported, in its strictest sense, using the original principal balance at issuance. Consequently, the Z-bond's average life as reported in Figure 19.2 is, at least in its strictest sense, correct and highlights the Z-bond's average life variability as the companion of last resort.
19.1 Key Rate Duration Analysis
Figure 19.3 illustrates the Z-bond's key rate duration profile and further shows how the deferral of interest payments and their capitalization as principal influences the Z-bond's weighted average life, and by extension its effective duration. Overall, the Z-bond exhibits an effective duration similar to that of its conceptual cousin the zero coupon bond. In this case, the Z-bond's effective duration is 16.8 versus that of its average life of 24.4.
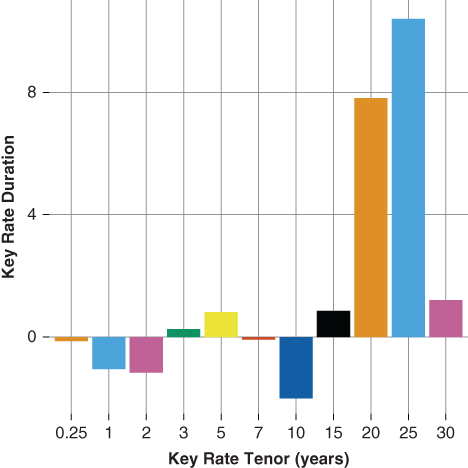
Figure 19.3 Z-Bond Key Rate Duration Analysis
The Z-bond, like the companion bond from which it was derived, exhibits mixed key rate durations through the five-year tenor—the sum of which is −1.36. The short tenor key rates suggest that the Z-bond's price behavior moves positively with changes in the short end of the curve. The intuition is straightforward. A bear flattening of the curve with the short end twisting up results in lower forward rates and slower future prepayment expectations. The Z-bond reports mixed intermediate key rate durations (7-, 10-, and 15-year), the sum of which is −1.30. Although lower than those of the companion from which the Z-bond is structured the key rate durations along these tenors reflect the callable nature of the Z-bond. Specifically, as a last cash flow tranche the Z-bond is least callable bond within the structure.
The Z-bond's 20-, 25- and 30-year key rate durations are 7.8, 10.4, and 1.2, respectively. In all, these key rate durations sum to 20.2 years, accounting for 122% of the Z-bond's overall effective duration. The heavy key rate durations between the 20- and 30-year tenors reflect the capitalization (accrual of the redirected interest).
19.2 Option-Adjusted Spread Analysis
Option-adjusted spread analysis can be used to further quantify the Z-bond's risk characteristics. The following sections examine the average life and spread distributions of both the underlying collateral and the Z-bond.
19.2.1 OAS Weighted Average Life Distribution
Figures 19.4 and 19.5 compare the average life of the underlying collateral to that of the Z-bond. The deferral of interest, which is capitalized as principal, results in a significantly longer average life than that of the underlying collateral. The Z-bond exhibits an OAS average life distribution ranging between a minimum of 13 and 55 years (in the strictest sense), significantly greater than that of collateral that ranges between 8 and 12 years. Not only is the Z-bond's average life longer than that of the underlying collateral, reflecting the fact that it represents last collateral cash flow, but the Z-bond's average life range is also greater, reflecting the greater prepayment risk inherent in both its last cash flow priority and companion bond nature.
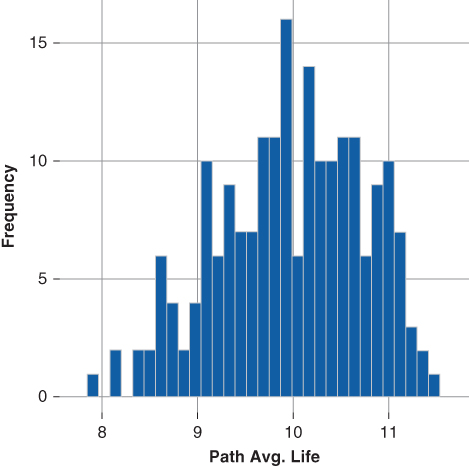
Figure 19.4 MBS 4.00% Avg. Life Dist.
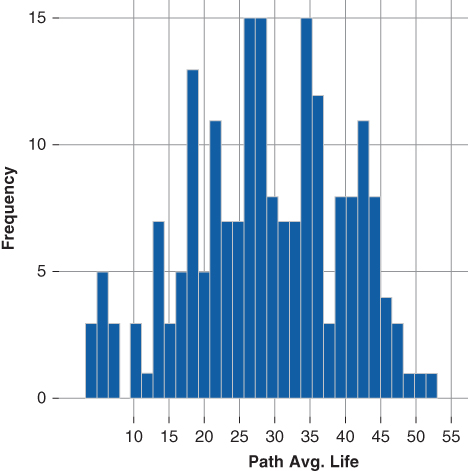
Figure 19.5 Z-bond Avg. Life Dist.
19.2.2 OAS Spread Distribution
Figures 19.6 and 19.7 show that relative to the underlying collateral, the Z-bond reports a wider overall spot spread distribution, with more negative observations than those of the underlying collateral. Further, the Z-bond also reports some modestly higher spot spread observations at the extreme right of the distribution. The tail distribution of the Z-bond relative to the collateral is due to the fact that the Z-bond principal accrues at the fixed coupon rate. Consequently, across higher short-rate trajectories the Z-bond is expected to underperform while lower short-rate trajectories favor the Z-bond. Naturally, the level at which the Z-bond's coupon is struck in relation to the long-term forward rate will influence its relative performance. For example:
- Given a rising interest rate environment,
- A Z-bond whose coupon is struck above the expected long-term forward rate will perform better than one whose coupon is struck below the long-term forward rate.
-
Given a falling interest rate environment,
- A Z-bond whose coupon is struck above the expected long-term forward rate will perform better than one whose coupon is struck below the long-term forward rate.
Simply said, a higher coupon is preferable to a lower coupon because the investor has, by investing in a Z-bond, locked in her reinvestment rate until such time the Z-bond begins to pay interest and return principal.
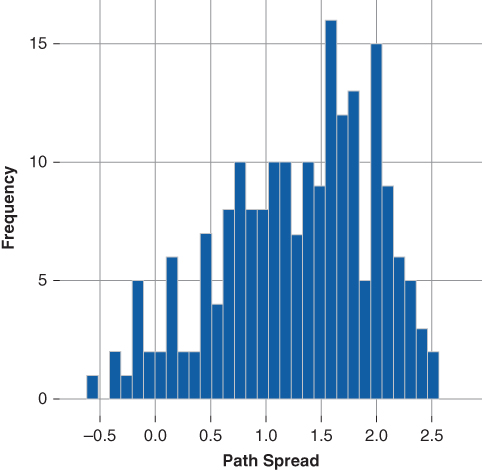
Figure 19.6 MBS 4.00% Spot Spd. Dist.
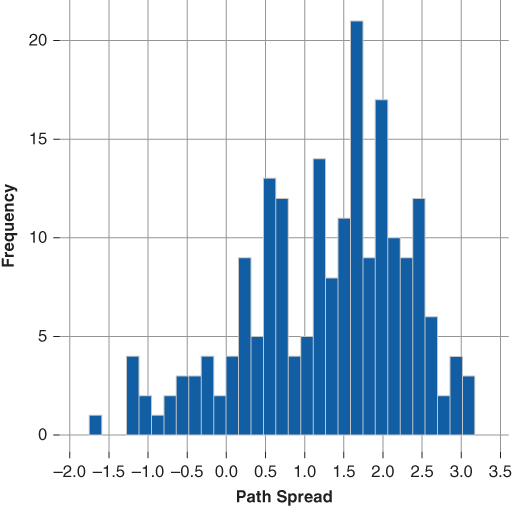
Figure 19.7 Z-bond Spot Spd. Dist.
Further, notice the average life profile of the PAC bond using a Z-bond structure relative to that of the PAC-Companion structure presented in Chapter 16. The PAC bond's average life profile also exhibits less extension and call risk relative to that of the PAC-Companion structure. The re-direction of interest, paid as principal, to the companion stabilizes the PAC bond. Thus, it follows that the presence of a Z-bond also alters the valuation of the PAC bond. The reader is encouraged to use Bond Lab to construct a relative value analysis between the PAC-Companion and the PAC-Companion-Accrual bond classes.