
Chapter 4
Establishing the
foundation—the
geodatabase
What is a geodatabase?
This chapter is about establishing the foundation of any GIS—the geodatabase. It provides an overview of the process of building a geodatabase by outlining some basic concepts on spatial data structure, spatial data modeling, and the design of the database itself. The chapter highlights the geospatial data sources needed in a census and the related geographical classifications in census geography that allow the identification of the geographic features and core objects of the census geodatabase. The chapter particularly emphasizes the geocoding concept and its central role in linking statistical data with geography, including a clarification about its association with the georeferencing concept.
At its most basic level, a geodatabase is a collection of geographic datasets of various types held in a common file system folder or a multiuser relational database management system (RDBMS) such as Oracle®, Microsoft SQL Server, PostgreSQL, or IBM DB2®. Geodatabases come in many sizes, have varying numbers of users, and can scale from small, single-user databases built on files up to larger workgroup, department, and enterprise geodatabases accessed by many users.
But a geodatabase is more than a collection of datasets. The term geodatabase has these meanings in ArcGIS:
•The geodatabase is the native data structure for ArcGIS and the primary data format used for editing and data management. While ArcGIS works with geographic information in numerous GIS file formats, it is designed to work with and leverage the capabilities of the geodatabase.
•The geodatabase is the physical store of geographic information, primarily using an RDBMS or file system. Accessing and working with this physical instance of a collection of datasets can be done either through ArcGIS or through a database management system (DBMS) using Structured Query Language (SQL).
•Geodatabases have a comprehensive information model for representing and managing geographic information.
•Geodatabase software logic provides the common application logic used throughout ArcGIS for accessing and working with all geographic data in a variety of files and formats. This functionality supports working with the geodatabase and includes working with shapefiles, computer-aided design (CAD) files, triangulated irregular networks (TINs), grids, imagery, Geography Markup Language (GML) files, and numerous other GIS data sources.
•Geodatabases have a transaction model for managing GIS data workflows.
Geodatabase design is based on a common set of fundamental GIS design steps, so it’s important to understand these GIS design goals and methods.
GIS design involves organizing geographic information into a series of data themes—layers that can be integrated using geographic location. So it makes sense that geodatabase design begins by identifying the data themes to be used and then specifying the contents and representations of each thematic layer.
This approach involves defining the following:
•How the geographic features are to be represented for each theme (for example, as points, lines, polygons, or rasters1 along with their tabular attributes
•How the data will be organized into datasets, such as feature classes, attributes, raster datasets, and so forth
•What additional spatial and database elements will be needed for integrity rules, implementing rich GIS behavior (such as topologies, networks, and raster catalogs), and defining spatial and attribute relationships between datasets
Spatial data structures
This section will focus on the characteristics of a spatial database structure, highlighting the fundamental concepts used to represent and organize geographic features and their spatial relationships in a computer system. It includes some basic spatial concepts to allow the user to understand what characterizes geospatial information and distinguishes the structure of a spatial database from a conventional database. The aim here is to understand the fundamental concepts useful to grasp what is needed for building a geospatial database for census, using specific examples related to census and statistical contexts.
Geospatial data
The core element of a GIS is geospatial data2—that is, data about objects3 located on the earth’s surface. What distinguishes geospatial data from conventional data is that, in addition to the descriptive attributes that characterize conventional data (such as demographic characteristics or time), geospatial data is inherently described by its position on the earth (through geographic coordinates latitude and longitude; Cartesian coordinates x,y,z; address; place-name, etc.) and its geometric form (such as boundaries of a country).
For example, a parcel of land can be described as follows:
•Geometrical data
○Position
–Located at 100 Nelson Mandela Ave.
–X=a; Y=b within system (X,Y)
○Form
–Dimensions (sides and arcs constituting a polygon)
•Attribute (descriptive) data
○Landowner
○Land use
○Condition
○Area
○Date last sold
In other words, geospatial data has two dimensions: the “where” (spatial component) dimension and the “what” (attribute) dimension, the only one for the conventional data. Attribute data can be stored as different field types in a table or database: character, numeric (integer or floating), date/time, and binary large objects (BLOB).
Examples of geospatial data include roads, rivers, pipelines, cities, administrative units (province, county, ward, district, etc.), crop coverages, mountain ranges, and more. Examples of spatial attributes (or properties) include the width of a river, length of a road, or the boundary of a given country. Often it is also desirable to attach nonspatial attribute information such as the name or the type of road (e.g., Primary, Secondary, Highway), place, and city names, to the spatial data.
Spatial data structure definition
The formal organizational structure of geospatial data in a computer system is generally called a spatial data structure. Since the inception of GIS, many approaches have been proposed to represent as accurately as possible geographic features of the real world with their geometric aspects. For example, three of the most common representations of the basic features in maps are points, lines, and polygons (areas or regions).
Spatial data structures aim to organize geometry in 2D, 3D, or higher (e.g., time) for a faster processing of user spatial queries and other geometric operations. The selection of a specific spatial data structure, also called low-level data structure because it deals closely with implementation and execution at the machine level, may considerably influence the processing of spatial queries.4
A key geodatabase concept is the dataset. It is the primary mechanism used to organize and use geographic information in ArcGIS. The geodatabase contains three primary dataset types:
•Tables
•Feature classes
•Raster datasets

Figure 4.1. Geodatabase primary database types.
Feature classes are homogeneous collections of common features, each having the same spatial representation, such as points, lines, or polygons, and a common set of attribute columns (e.g., a line feature class for representing road centerlines). The four most commonly used feature classes are points, lines, polygons, and annotation (a term for map text).
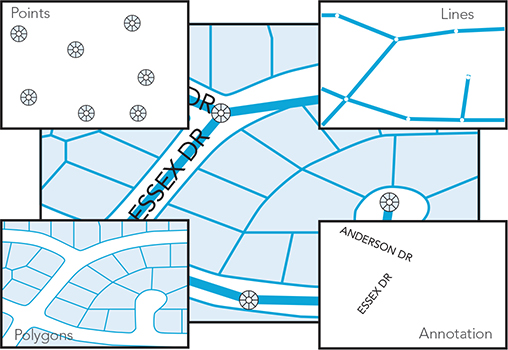
Figure 4.2. Feature classes.
In the geodatabase, attributes are managed in tables based on a series of simple yet essential relational data concepts:
•Tables contain rows.
•All rows in a table have the same fields.
•Each column has a data type, such as integer, decimal number, character, and date.
•A series of functions and operators is available to manage tables and their data elements.
Creating a collection of these dataset types is the first step in designing and building a geodatabase. Users typically start by building a number of these fundamental dataset types. Then they add to or extend their geodatabases with more advanced capabilities to model GIS behavior, maintain data integrity, and work with an important set of spatial relationships.

Figure 4.3. Table attributes.
Spatial data models
Earlier, spatial data structure was defined as what is needed for data to be organized and implemented on computer systems, but we should consider the higher level of abstraction, independent from the implementation and physical aspects.
A spatial data model reflects the conceptual view of the user to the “geographic reality” or “real world” in consideration. This has the advantage of adding and updating the components of the “geographic reality” under consideration for representation, independently from the GIS software in use or to be used.
In a GIS, as a computer system, space would be represented either as a continuum (or surface) or in a discrete manner, with both representations having their advantages and disadvantages for specific applications—hence the representation of spatial data respectively in a raster or vector mode.
Vector vs. raster
The spatial data model used to represent the world as a surface divided into a regular grid of cells (i.e., arranged in rows and columns) is the raster data model. The raster model is useful for storing data that varies continuously, as in an aerial photograph, a satellite image, or an elevation surface. A raster data model describes how an image is stored. A raster defines the pixels (cells) in rows and columns, the number of bands, and the bit depth that compose the image. When you view a raster, you are viewing an image of that raster data.
All images are rasters, but not all rasters are considered images. For example, a digital elevation model (DEM) is a cell-based raster dataset but is typically not considered an image. Other types of rasters that are not considered images per se are magnetic data, interferogram, bathymetric data, and other grid-based datasets.
Each cell (pixel) contains an attribute value and location coordinates. Unlike a vector model, which stores coordinates explicitly, raster coordinates are contained in the ordering of the matrix. Groups of cells that share the same value represent a geographic feature.

Figure 4.4. Raster—each cell contains an attribute value and location coordinates.
However, the resolution of the raster depends on its pixel size: the smaller the pixel size, the higher the resolution, but also the larger the data volume (hence a trade-off to be made about the size versus the cost of storage and processing).
A vector model is a coordinate-based data model that represents spatial objects or geographic features using a data structure whose geometric primitives are points, lines, and polygons. This allows the representation of discrete objects defined by their coordinates with a precision that depends on the number of coordinates in consideration.

Figure 4.5. Vector—a coordinate-based data model that represents geographic features as points, lines, and polygons.
The vector model is appropriate for the representation of point-based features such as wells, dwellings, schools, landmarks, urban centers at small scale, line-based features (such as roads, railways, rivers, pipelines, boundaries, etc.), and polygon-based features (such as lakes, forests, cities at large scale, administrative units, provinces, countries, or regions). Other popular data structures like the irregular tessellations are also used in some vector-based models, such as TINs, contour lines, Thiessen or Voronoi polygons, and so on.

Figure 4.6. Irregular tessellations—tessellation is the tiling of a plane using one or more geometric shapes, with no overlaps and no gaps.
The vector model would be suitable for census data collection units at point level as well as at EA. We will expand on the vector model when we use it for the building of a census geospatial database at the EA level because it’s a vector-oriented model database.
Let’s first illustrate the vector versus raster models, representing the same geographic feature.

Figure 4.7. Vector versus raster—representation of points, lines, and polygons in vector and raster formats.
Topology
Topology in GIS is generally defined as the spatial relationships between adjacent or neighboring features. If features are coincident and share the same location of coordinates, boundaries, or nodes, chances are that geodatabase topology can help better manage geographic data.
Geodatabase topologies help ensure data integrity. Using a topology provides a mechanism to perform integrity checks on data and helps to validate and maintain better feature representations in a geodatabase. For example, making sure that a feature set that represents an EA completely covers the area and leaves no gaps or overlaps is a function of topology.
In addition, topologies can be used for modeling numerous spatial relationships between features. These topologies enable support for a variety of analytic operations, such as finding adjacent features, working with coincident boundaries between features, and navigating along connected features. The geometric primitives of the vector data model are represented in a computer database as follows: a point is represented by one pair (x,y); a line (a set of connected points) is represented by a sequence of x,y coordinates with the starting and ending points called nodes; and a polygon (a set of connected lines) is represented by a set of x,y coordinates in which the starting point coincides with the ending point of the loop.

Figure 4.8. Comparison between topological and spaghetti data structures. Topology is the arrangement that constrains how point, line, and polygon features share geometry. Without this, you have a spaghetti data structure.
Topology is the arrangement for how point, line, and polygon features share geometry. Topology is employed to do the following:
•Constrain how features share geometry. For example, adjacent polygons (such as parcels with shared edges, street centerlines, and census blocks) share geometry and adjacent soil polygons share edges.
•Define and enforce data integrity rules: no gaps, overlapping features, or slivers should exist between polygons.
•Support topological relationship queries and navigation, such as identifying feature adjacency and connectivity.
•Support sophisticated editing tools that enforce the topological constraints of the data model.
•Construct features from unstructured geometry, such as creating polygons from lines.
Topology explicitly stores the relationships among the geometric primitives. As shown in figure 4.8, it represents the polygons in an optimal way.i Topology is defined as the mathematics branch that deals with the spatial relationships (connectivity, adjacency, etc.) among the geographic features represented by the primitives (point, line, polygon) in a GIS. The topological data structure determines explicitly, for example, how and where points and lines connect and whether polygons are adjacent. In short, topology describes the geometric relationships of the geographic features of a given space.ii
The use of topology distinguishes a GIS database because it allows users to make spatial queries. This capability is useful for network analysis and necessary for various spatial analyses, all of which constitutes the power of GIS.
It is worth mentioning that a simple vector model, used by CAD systems, stores vector data without establishing relationships among the geographic features. It is called the spaghetti model. With this model, vector data consists of simple lines with no topology and usually no attributes. For example, spaghetti lines may cross but those crossings are not recognized as intersections (see figure 4.8, which compares the spaghetti and topological models).
Geospatial database design
Earlier, we defined geospatial data and the models to represent geospatial data to structure them in a way that would allow their implementation in a computer system. The next step is to create and maintain a database to help organize and manage geospatial data. What distinguishes a GIS from a CAD system is that a GIS relies on a DBMS, constituting an integrated software that allows users to store, manipulate, and retrieve data from a geospatial database.
Database modeling
Using abstraction from concepts by humans to their implementation in the machine, database modeling relies generally on a three-tier model:
1.A conceptual model involving the identification of the geographic features to be included in the database as entities/objects, the definition of their attributes, and how they relate to one another. An abstraction and objective representation of the real world independent from the DBMS software to be used.
2.A logical model, a resulting outcome from the transformation of the conceptual model using the DBMS data model techniques (e.g., relational, object, or object-relational).
3.A physical model, a resulting outcome from the transformation of the logical model, dealing with storage devices, file structure, and access methods that sort data records. A physical model deals with the storing and encoding of data—the lower-level data structure of the database.
Many GIS databases within NSOs are created without necessarily going through the modeling process. Some organizations tend to select the GIS technology first and then proceed with the creation of the database in accordance with the selected software requirements. NSOs, particularly in developing countries, often do not have the time or the expertise required to understand how to establish their geodatabase. The challenge here is that this work is fundamental to success and will have an effect across all business processes. Diligence in creation of the database model and developing guidelines and best practices are recommended for building a comprehensive and sustainable geospatial database that can respond to the needs of the census and beyond. Database modeling would lead to the preparation of a detailed data dictionary that guides the database development process and serves as documentation in later stages, justifying any additional investment the NSO would need for the creation of its geospatial database.
Database designers tend to give attention to the DBMS data model techniques used for the geospatial database creation. An array of techniques has evolved from the flat file, hierarchical, and network models, to the relational and the object-oriented models. However, the relational and, to a lesser degree, the object-oriented and the hybrid object-relational are the most used, but with the relational still prevailing and dominating the field. The dominance of the relational (RDBMS) in the database field would be arguably attributed to the many resources invested in its development, its massive installed base that developed even before the appearance of the object-oriented, and particularly to its close ties with SQL,5 the standard database query language adopted by virtually all mainstream databases.
Some would even ask that if object-oriented programming languages like Java or C# (C++) are so popular, why aren’t object-oriented database management systems (OODBMSs) more popular, too? The debate between relational and object-oriented within the database community, paralleling the debate of vector versus raster in GIS,6 does not seem to be going away soon; it is, however, tempered by the increasing use of the hybrid object-relational approach. We will elaborate more on the relational model and provide an overview on the object-oriented model as well.

Figure 4.9. Parcel tables store information both about the parcel itself (points, parcel lines, and parcel polygons) and the attributes that describe it (type, owner, year of last sale, etc.).
Relational database model
In a relational database model,7 the geographic features and their relationships are represented by tables of data (files). The relational database model is used to store, retrieve, and manipulate tables of data that refer to the geographic features (see the example of a parcel table in figure 4.9). The focus is on the potential relation between any two features, which is defined by a name and a list of attributes, including a key identifier that characterizes the relation. The manipulation of relations, suitable for mathematical operations, would thus allow queries and reports; this gave the model its “relational” name.
The relational model, dealing with the formats of the attributes and the relations that link the geographic features and used at the implementation level of the database, is based on the entity-relationship (E/R) model, developed by P. Chen in 19768 as an abstract concept of the database.

Figure 4.10. Parcel table with map and example of linking to attribute data via unique ID or PIN.
Census GIS database: Basic elements
In creating the census GIS database, we start by identifying the components of a census geographic database and stress the different stages in its development, including geographic data inventory for EA delineation; geographic data conversion through scanning, digitizing, or use of earth observation data; construction and maintenance of topology; integration of various digital data; implementation of an EA database; metadata development; and data quality control.
The basic elements of the census database include the following:
•Boundary database—including polygons that represent the census units
–Administrative units
–Census units/EAs
•Geographic attribute tables
•Census data tables—nonspatial attributes including a unique ID that allows for the link to the corresponding geography
•Other vector data—e.g., points of interest, landmarks, transportation or water features
The geodatabase storage model is based on a series of simple yet essential relational database concepts and leverages the strengths of the underlying DBMS. Simple tables and well-defined attribute types are used to store the schema, rule, base, and spatial attribute data for each geographic dataset. This approach provides a formal model for storing and working with your data. Through this approach, SQL can be used to create, modify, and query tables and their data elements.
You can see how this works by examining how a feature with polygon geometry is modeled in the geodatabase. A feature class is stored as a table, often referred to as the base or business table. Each row in the table represents one feature. The shape column stores the polygon geometry for each feature. The contents of this table, including the shape when stored as a SQL spatial type, can be accessed through SQL.
Object-oriented model
An object-oriented model represents the “real world” in the form of a set of objects. Each object is associated with a unique identifier, encapsulating attributes defining its characteristics, and methods defining its behavior. Objects sharing the same set of attributes and methods are grouped in classes, and new classes can be derived from the existing classes through inheritance (the new class inherits all the attributes and methods of the existing class and may have additional attributes and methods).
Objects are at the core of the object-oriented model (as tables are at the core of the relational data model), but they seem to be more natural to represent the real world. The OODBMS, supported by the oriented-object programming languages such as Smalltalk, C++, Java, and others, was created to overcome the shortfalls of the RDBMS. But, mainly for lack of agreement on a standard for object-oriented database and the strong implementation of RDBMSs, the OODBMSs have been used more frequently to complement the RDBMSs than to replace them.
In this regard, superimposing the object-oriented database concepts on relational databases is more commonly used by the commercial GIS products. The Esri geodatabase9 is object-relational and illustrates the object-oriented concepts extension brought to relational-based databases. The subsequent examples will rely on the use of this geodatabase.

Figure 4.11. Thematic layers are one of the main organizing principles for GIS database design.

Figure 4.12. Census data model (see the online ancillaries for a complete, up-to-date version of the data model).
Worth noting is that to provide a complete description of the reality to be represented in a database and ultimately allow the programmer or developer to maintain a sustainable database, the data models must be completed by a data dictionary. Usually, the data dictionary contains all the necessary metadata about the name and definition of the entity types and attributes included in the data model as well as any codes used to identify the entities and their attributes—the type of each attribute and the domain of its values. (More information on metadata will be provided in chapter 6, and on metadata for dissemination in chapter 9).
Basemap considerations
A comprehensive GIS-based census database should have at its foundation the smallest statistical unit for data collection, be it an EA, a census tract, a block group, a census block, a dwelling or housing unit, or an address. Basemaps constitute one of the main sources of data for the delineation of EAs, but they need to meet some requirements to support the EAs’ delineation process.
All census geographers should consider specific factors as part of their basemap inventory process, such as the types of basemaps, either available or to be created eventually, required for the census purposes. NSOs are not typically the custodians of the basemaps in the country because their creation may require a national mandate. Often a NMA takes on this role and has staff with surveying and cartographic skills and equipment necessary to build a complete national digital basemap. Thus, NSOs would most likely need to acquire various basemaps from different outside providers or use map services, requiring national institutional coordination and collaboration.
NSOs need various up-to-date basemaps at different scales,10 the master data from which enumeration and publication maps are made. They primarily need national base data covering the whole country, at small scale, showing the major administrative area boundaries and the location of major reference features. NSOs also need topographic data at large and medium scales, generally produced by their NMAs, which show elevation and other major topographic features needed for demarcation. They also need city and cadastral data at large scales showing land parcels, streets and roads, city buildings and important landmarks, or any features that may be useful for census mapping in urban areas. In addition to this base data, NSOs need maps showing population distribution from the previous census, or any features that may be useful for GIS-based census purposes. (This will be further covered in chapter 6.)
Because the information will be incorporated into the GIS-based census database, the legend and metadata about the sources should be well documented to be part of the data dictionary. Maps or map services should include the sources of data, the geographic referencing information, and the scale, including consistent map projection, but also the other cartographic parameters like map datum, grid, and any other information helpful to map users. These parameters should fully match those adopted in the new technologies (GIS and GPS) before trying to use this data in a GIS project.
Quality control and quality improvements to basemaps
The quality of geospatial data, including maps that are used in the census, has a major influence on the quality and reliability of the census data to be collected. Striving for high accuracy may be costly, but adequate activities need to be carried out that go beyond data conversion in terms of quality control, quality review, and editing of the maps used during the enumeration. Problems and inconsistencies must be resolved before the final products can be generated.
Specific measures help to ensure the data quality of the final maps used by the enumerators. One such measure is to ensure the consistency of the geospatial database that will be the basis for the creation of digital maps. We should, for example, check that two adjacent EAs actually connect on the map with no overlapping, or that a supervisory area (SA) correctly includes the assigned EAs. The aim is to make sure that full and unduplicated coverage of the country’s territory exists by correctly delineated EAs (i.e., without undercoverage or overcoverage).
In addition, we need to check that the metadata (map scale, data sources, date of production, etc.) is properly attributed. Because the digital map is composed of a set of data layers, checking their organization is very important to avoid any overlay in which a top geographic data layer would hide features of a layer in a lower level. While most of the consistency checks are increasingly done interactively on computers, the quality control of the cartographic work may still require, for some developing countries, printing of the updated maps and organizing them by administrative unit. Traditionally, NSO census geographers gave the maps to local administrators for final checking and corrections, including the accuracy of the directional positioning of localities and the area coverage—a kind of peer review. Indeed, involving local authorities provides some ownership to the data and ultimately builds confidence in the results. Today, this process is changing with the use of a digital approach to map production.
Many country experiences have proven that the use of GIS, integrated with remotely sensed data and GPS, facilitates the quality control of the field data and in turn increases its quality. More specifically, with GIS and its geospatial database, the delineation of EAs can be substantively improved because a number of questions about the EA will be addressed (such as total number of dwellings/households per EA or locality) and also with regard to updating data on roads, streets, and reference points for map orientation. Actually, map updating and improvements refer to the activities aimed at updating data on housing units for the organization of field census operations, making the list of buildings and housing units up-to-date. We will see in later sections how the logistics of fieldwork activities will be better planned, managed, and monitored with this same data.
Earth observation data
As noted earlier, population and housing censuses require up-to-date and detailed basemaps for the accurate delineation of EA boundaries. But in many instances, basemaps suitable for a census are either outdated or inaccurate when they are available, or in some cases simply do not exist. Modern satellite imagery, digital aerial photography, and GPS, combined with GIS, have been increasingly used to overcome the lack of appropriate basemaps for the EA demarcation.
In the last few decades, the integrated use of remotely sensed data11 (aerial photos and satellite imagery) and GPS has been practiced to field-validate EA boundaries that were created in the office using available GIS-based maps from the previous census or sometimes as a substitute for up-to-date basemaps when they were not available.
NSOs have many more imagery-based options than they had just a few years ago. Digital aerial photography, known for its high resolution and accuracy, can obviously be used for census mapping. While its acquisition cost and particularly the expertise and equipment needed for the additional processing required to produce orthophoto12 maps used to be prohibitive for the NSO to pursue, imagery costs have decreased and continue to do so today. Some aerial imagery providers, such as Woolpert, have begun to provide orthorectified imagery at very competitive rates. This trend is reinforced by aerial photography and imagery captured from drones that can be processed much faster and easier than ever before. Similarly, high-resolution satellite imagery (providing geographic details that are quite comparable to digital orthophoto maps) are also decreasing in costs and increasing in coverage and accessibility. Today, some cost-free initiatives13 are available. Satellite-based remote sensing and GPS technologies constitute a viable alternative in support of EA delineation (more details on the use of earth observations are in chapter 5).
Defining census geography
Census geography refers to how the country is geographically divided prior to the actual census enumeration to facilitate field operations, data processing and analysis, and ultimately reporting and disseminating census results. In this section, we will elaborate on the various geographic classifications, including the enumeration geography (administrative areas approach), the grid- and point-based approaches, and the spatial register–based approach.
Geographic classifications
One of the key issues a NSO faces when it starts to prepare for a census geography program is choosing the geographic classification approach to determine the geographic units for census enumeration, as so many other operations depend on this choice—in other words, what would be the geographic level or scale to which statistical data will be linked, as the “geography on which the census is collected will determine the geography on which the census data can be disseminated.”14 An increasing number of approaches are being used and are outlined in the following paragraphs.
Administrative areas approach/enumeration geography
The traditional administrative areas approach involves the use of existing administrative boundaries to provide the basis for the geographic areas, representing the smallest area for which population information is available. It consists of the creation of a list of all administrative and statistical reporting units in the country, with the relationships between all types of administrative and reporting unit boundaries being defined.
Most countries have their own specific administrative boundary hierarchy, generally a nested administrative hierarchy (see figure 4.13) by which the country and each lower-level set of administrative units (except the lowest) are subdivided to form the next lower level; the lowest level often constitutes the EA. The numbers of boundaries vary between countries depending on the physical size, population, and population distribution of each country. The number of boundaries is also influenced by the number of tiers of government with countries having national, state, and local governments (see the following example of administrative hierarchy from the UN workshops for the 2010 Round of Census).

Figure 4.13. Nested administrative hierarchy.
However, this approach makes it more difficult to provide statistical information describing other geographic areas. (In certain countries, EAs are further subdivided into blocksiii bounded by physical features such as streets or rivers; see figure 4.14.)
This process of division of a country into areas for census purposes is also known as enumeration geography. Relying on the boundaries of administrative areas is considered for some a natural and more appropriate approach for surveying populations, housing units, and geographic areas because they conform to the boundaries of the physical features on the ground (i.e., roads, railroads, rivers, lakes) and on urban development patterns.15

Figure 4.14. Geographic hierarchies based on census blocks. Source: US Census Bureau.16
Grid-based approach
Enumeration geography relies on administrative areas aligned with physical boundaries for census purposes. But some would argue that a reliance on physical boundaries that have the potential to change is precisely the reason not to use administrative areas in favor of other geographic classifications. In this regard, the statistical grid is proposed as an alternative, especially in Europe,iv where a big advantage of the grid-based statistical system is seen to be the application across boundaries. Grids are stable over time and not affected by frequent administrative boundary changes. Indeed, grids offer a great potential for cross-border studies needed by the global community to tackle environmental, health, socioeconomic, population, urban planning, emergency management, and national security concerns. It also offers the potential for studies of indicators where the data heavily depends on the spatial entity to which it relates.17
While the boundaries of administrative areas are often irregular, statistical grids, used as geographies for population and census information, are fundamentally spatial units with equal size and even distribution. Moreover, grid-based statistics offer flexibility in the size of the grids, starting with relatively small grids and increasing in size to larger and larger grids (e.g., from 100 m × 100 m to 10 km × 10 km or bigger) and constituting a nested framework. These grid cells provide a great potential for comparable spatial statistics and statistical time series.
One major criticism with grids is that they are not population-centric, meaning that there will be a different number of people in the same-sized grid cell, depending on urban or rural locations. However, statistical grids offer a spatial reference system that can serve as the smallest statistical area unit for which—respecting statistical confidentiality—data may be provided to the user, providing an effective approach for environmental and other non-population-based statistics. The most important advantage of statistical grids is the independence of administrative (national or international) boundaries. Furthermore, being a spatial reference system, statistical grids provide a mechanism for integrating data from other sources and are suitable for GIS-based overlaying capabilities and other spatial analysis. They can serve as the smallest statistical area unit with better solutions for statistical disclosure control. In this regard, grid statistics are being increasingly adopted in some national statistical institutions, particularly in Europe, as an alternative to census blocks.18

Figure 4.15. Example of data displayed in grids and other geographic units.vi
The debate of grid-based approach versus population/administrative areas approach has been recurrent for some time now. The UN-EG-ISGI19 discussed the issue thoroughly in several meetings and conducted a comparative study, highlighting advantages and disadvantages of the two approaches. The conclusion is that the solution is not either/or and that statistical grids can complement traditional statistics based on administrative/statistical units, and thus, when needed, a mixed approach20 that combines administrative areas with grids is advisable. Since statistical grids can be used for many purposes, such as regional/spatial analysis and planning, research, environmental, and other telecommunications purposes, some efforts are being made to develop standards to consolidate the use of grid-based areas.v National Statistics Center of Japan (NSTAC) has been working with grid data for some time and is providing population census data in multiple geographic units.
Point-based approach
Another approach dealing with higher geographic levels consists of geocoding statistical units associated with unreferenced location information (address, property, or building) to the level of single coordinates (e.g., x,y,z coordinates). This point-based location has the advantage of increasing the spatial resolution of the statistical data and provides considerable flexibility when linking the statistical information to any type of geographic area of interest and delivering aggregations at any spatial unit. It allows for considerable adaptability to changes in the geographic areas over time or to adapt to new geographies that emerge. Another advantage of a point-based location of people and dwellings is that it increases the spatial relevance of statistical information, particularly in crisis management, as in the case of flooding and other natural disasters.21
The point-based approach is increasingly used through the direct capture with GPS of the coordinates (latitude and longitude) of point-based features such as dwellings or other features of interest. Some countries are embarking on capturing a latitude-longitude for every housing unit, building their geospatial infrastructure, known as the dwelling frame.22
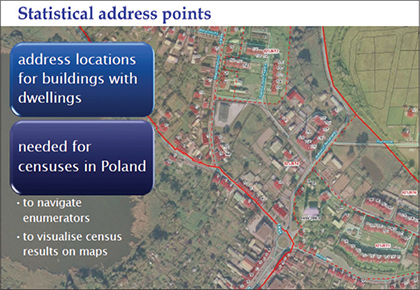
Figure 4.16. Statistical address points database excerpted from the Polish Modern Census, Example of Statistical Address Points, Poland. See The Polish Modern Census: Incorporating Geospatial Technology and Data with Administrative Information.23
Spatial register–based approach
An alternative that has been used particularly in Europe and Nordic countries24 is the register-based approach. The register-based approach involves the full use of the existing administrative sources related to individuals, households, dwellings, and addresses. Some cases extend to other relevant registers providing information on business units, tax, education, and employment.25 Usually, administrative records are data collected as part of the management of federal, state, or local governmental programs.
Countries using administrative registers expect to reap these benefits: reduced costs; no burden of massive responses; reduced time to produce census outputs; and better coverage and quality of census data. However, coverage and data quality depend on the quality of registers, including reliable information related to households and addresses. In addition, some preconditions related to the use of administrative data should be met. They include the existence of a legal framework allowing their use for census purposes with adequate protection of privacy and the availability of comprehensive and reliable registers (population, buildings/dwellings, and addresses). Institutional cooperation is also required because of transparency issues, such as, generally, several institutions being custodians of the registers, easy access to the registers, and acceptance from the people as the data is at the individual level (e.g., using a nationwide unique ID).
Some countries are even using spatial-based registers. For example, in Netherlands, two important geographical registers became accessible for statistical use because of the new law governing Statistics Netherlands. These registers contain information on roads, from highways to streets, and data on address-location—that is, x and y coordinates. The Dutch census of 2011 was carried out almost entirely by collecting data from registers, such as the housing registry, in combination with other sources, such as the land registry and the central bank. Studies show that in the absence of geocoded population registers, disaggregation and spatial modeling techniques can help to fill the gaps.26
Enumeration areas27
We have outlined the different geographical classifications used for census purposes. A common central piece is the need to identify the statistical unit required for census data collection. In the following paragraphs, we will focus on the design of the still most used one: the EA that is used with the traditional administrative areas approach.vii The UN Principles and Recommendations defines EA as the operational unit for data collection during the census that comprises the lowest level of the geographic hierarchy of administrative and statistical units.
As stated previously, the delineation of the EAs for census purposes is a defining step of the census geography program, carried out at an early stage of the census process. Taking into consideration a certain number of critical design criteria, EAs should do the following:
•Cover the whole country—by showing clearly that there are no gaps in the territory to be enumerated—and not overlap.
•Fit within the national administrative hierarchy and be consistent, as much as possible, with other relevant geographic units (needed for education, health, environmental, and development purposes).
•Have clearly observable and easily identifiable boundaries on the ground—enumerators need to be able to find the boundaries of the area for which they are responsible (use preferably physical features such as rivers, lakes, roads, railroads, parcel boundaries, or any other visible feature that defines a sharp boundary, and try to ensure that these features are shown and named on the updated maps).
•Have populations of approximately equal size.
•Be small enough and accessible to be covered by an enumerator during data collection but large enough to guarantee confidentiality of personal information.
•Be consistent (to a larger extent) with EA boundaries used in the previous census to allow comparability over time.
•Be small and flexible enough to respond to the dissemination demands for small-area data and the ability to be aggregated to present information on larger geographic units, and be useful for other types of data collection activities.28
Practically, the design of EAs is guided by two major needs: on one hand, it should facilitate the census data collection and the related field operations, and on the other hand, it should allow the production of useful census output products for various census data users.
It is important to stress that the size of the EA is of utmost importance for the field operations because it affects the way the census is conducted. The size of EAs should be defined by simultaneously considering population size and surface area. The chosen population size (most important in terms of censuses) varies from country to country and is determined based generally on pretest results and estimates from the previous census. However, for most practical purposes, the population size of an enumeration is generally in the low to mid- hundreds. As per surface area and accessibility, the main criterion is to ensure that one enumerator can count the population within the EA in the time scheduled for data collection, knowing that enumeration can proceed more quickly in towns and cities than in rural areas.

Figure 4.17a. Enumeration area showing a boundary line cutting through a building.

Figure 4.17b. Enumeration areas showing significant change since the previous survey.
We have just set the guiding principles that NSOs need to follow for EA design. In chapter 6, we will present how we use geospatial technology to help delineate them. After the delineation of EAs, we need to proceed with the design of SAs, which is usually straightforward. SAs provide the means for crews of enumerators to be effectively guided and managed, given that experience has shown that supervision of the enumerator’s work is an essential requirement for the success of any census. Each SA contained usually a group of eight to ten contiguous EAs to facilitate the enumeration and assignment of workloads. Indeed, the EAs assigned to the same SA must be compact to minimize travel times (allowing the supervisor to travel to the field to observe enumerators and ensure accuracy in recording information, resolve problems, and conduct verifications) and of approximately equal size. They should be delineated to be included in the same field office area, which is usually defined according to administrative units, and thus their boundaries must not cross administrative boundaries.
Census management areas consist in turn of aggregations of SAs and are defined for facilitating the management of the census enumeration. They might relate to either administrative regions or statistical areas because they are devised as operational zones, driven by the need of management for the most efficient data collection. GIS spatial analysis tools can be used in this process to create efficient EAs that help reduce costs and save time.
Geographic coding
The creation of the traditional geographic classification system includes two processes: dividing a country into smaller geographic areas and assigning a code to each of the resulting geographic areas. This geospatial enabling process constitutes one of the major approaches to what is known as geocoding. The purpose of the following section is to introduce the geocoding concept relevant for census mapping and its different approaches related to data collection. We will further clarify the difference between geocoding and georeferencing.
Coding scheme
Generally, the NSO is the custodian of a coding structure, a system that uniquely identifies each level of the administrative hierarchy, including the assignment of a unique code (alphanumeric or preferably numeric) to each EA, called the coding scheme. This unique code (a series of numbers) is used to ensure unique enumeration during the census data collection and is used in data processing to compile enumerated information for households in each EA and to aggregate this information for administrative or statistical zones for dissemination.
Geographic units are numbered at each level of the administrative hierarchy—usually leaving gaps between the numbers to allow for the future insertion of newly created zones at that level. Indeed, the coding scheme should be flexible and expandable to accommodate any changes in the structure of the administrative hierarchy and the EAs.
For example, at the province level, units may be numbered 5, 10, 15, and so on. A similar scheme would be used for lower-level administrative units and for EAs. Since there are often, for example, more districts in a province than provinces in a country, more digits may be required at lower levels.
The unique identifier for each smallest level unit—i.e., the EA—then consists simply of the concatenated identifiers of the administrative units into which it falls.
•An EA code of 01-07-22-018-076392 means that enumeration area 076392 is located in region 01, province 07, municipality 22, Barangay 018.
A prerequisite to the building of a GIS database at the EA level is the development of a geocoding scheme in which the unique code can be used to link the digital EA boundary (geographic features) to the aggregated census data (attributes recorded for them). The development of a coding scheme is therefore necessary to assign a unique code to each EA, needed for data processing. When we assign geographic identifiers, such as latitude-longitude coordinates, to the boundaries or the centroid location of the EAs, the resulting codes, referred to as geocodes, will allow data to be linked geographically and displayed on a map and therefore establish a link between GIS boundaries and tabular census data. Some NSOs are going even further than EAs to geocoding street addresses, landmarks, buildings, and dwelling and housing units. For some data users, geocoding is referring more specifically to this latter operation.

Figure 4.18. Example of an enumeration area coding scheme from Philippine Statistics Authority.29
Definitions of geocoding
Geocoding (geographically enabling unit records) is defined as the process of finding associated geographic coordinates (expressed in latitude and longitude) from other geographic data for the statistical units, such as street addresses or postal codes. (Geocoding is a way to ensure that the data “knows” where it is.)
In other words, geocoding involves taking location information for these statistical units (such as address) and linking this information to a location coordinate (i.e., x,y,z coordinates) and/or a small geographic area. The geocodes (the location coordinates and geographic areas codes) obtained from this process can be stored directly on the statistical unit record or linked in some way to the record. There is a common misunderstanding between geocoding and georeferencing, so it is important to emphasize that while they are related, they are quite different. Georeferencing is often done, for example, with raster images. Georeferencing is the process of referencing data against a known geospatial coordinate system by matching to known points of reference in the coordinate system so that the data can be analyzed, viewed, and queried with other geographic data.
In the GIS industry, geocoding is synonymous with address matching, which is the process of assigning map coordinate locations to addresses in a database.30 A GIS is capable of doing this by comparing the elements of an address or a table of addresses with the address attributes of a reference dataset—the GIS data layer used as the geographic reference layer (e.g., a city’s street centerlines layer)—to find a match (i.e., to determine whether particular address falls within an address range associated with a feature in the reference).
But the concept of geocoding goes beyond address matching. It covers a continuum of spatial scales: from individual housing units to EA levels, up to higher administrative or national levels. The use of GPS, directly capturing precise data at the level of point locations (latitude and longitude coordinates), allows the coding of centroids, building corners, or building point-of-entry coordinates for a unit such as a block of land, building, or dwelling.
A look at the main geocoding methods used by many countries during the 2010 Round of Censuses is informative. In this regard, at the forty-fourth session of the UNSC held in February 2013, the commission discussed the program review Developing a Statistical-Spatial Framework in National Statistical Systems, which was based on the outcomes of the Survey of Linking Geospatial Information to Statistics, led by the Australian Bureau of Statistics (ABS) in September–October 2012 and had fifty-two NSOs complete the survey. Participating countries recognized, among other things, that adding a geospatial capability to statistics requires the codification of location attributes linked to socioeconomic statistical information, known under the concept of geocoding. The results are summarized in figure 4.19.
Main geocoding methods |
Percentage using this method |
Comments |
Enumeration geography |
31% |
This is a traditional approach that takes the geospatial reference from the geography that the data is collected within, but forces enumeration geography and dissemination geography to be tied together. |
National registers |
23% |
Strong in Europe. |
Address coding |
9% |
The major countries using this method are Australia, New Zealand, USA, UAE, Poland and Portugal. |
Block, locality, and community coding |
8% |
Stronger in the Americas and Asia, and similar to enumeration geography but generally the areas are larger. |
Direct capture (via GPS) |
6% |
This method is being used in a number of developing countries througout the world, where these countries may be leapfrogging older methods. |
Figure 4.19. Main geocoding methods in the 2010 Round. Source: Final report for the Expert Group on the Integration of Statistical and Geospatial Information.31
Additional reference information
The provision of geocoded statistical data for small areas has become a new challenge for NSOs. On the one hand, the demand for spatial data and especially for data related to small areas has increased. On the other hand, the technical possibilities to collect and process georeferenced data using geospatial information technology, including geographical information systems, have also greatly increased. Statistical data is increasingly collected or organized in such a way as to be linked to a georeference system, most preferably a coordinate-based system, and structured in a geospatial database. This database benefits from being developed with an extended scope, encompassing the foundational elements related to the smallest statistical unit (e.g., EA), but also incorporating other reference information, such as topography, elevation, land parcels, transport networks, etc.
The added value of establishing detailed geographic databases of EAs that would encompass the needs for census data collection, support the processing of census data, and be directly linked to data dissemination for small areas is incalculable. These databases need to consistently integrate their database structure’s census data with other geographic reference data, such as roads, rivers, landmarks, and settlements, thus providing a critical base for disaster preparations. The participants noted that the geographic presentation of statistical data significantly increased the interest of users, resulting in a better appreciation of statistical products and statistical work in general.
Case study: Albania
The National Institute of Statistics of Albania (INSTAT) is the main producer of official statistics in the country and responsible for the coordination of the Albanian statistical system.
The production of official statistics in Albania is regulated by the “Law on Official Statistics” that follows the Fundamental Principles of Official Statistics of the United Nations and the European Statistics Code of Practice. Albania is a candidate for membership in the European Union and, as such, is committed to put in place standards in line with the acquis communautaire. The European Union directive Infrastructure for Spatial Information in Europe (INSPIRE) requires member states to share spatial themes through a network of services and to adopt its set of rules.
To build its GIS, the institute partnered with two Italian agencies, TeamDev and CIRPS—University of Rome. They determined census methodologies and introduced GIS technology into the 2011 census process.

Figure 1. A widget lets administrators geospatially monitor census coverage.
INSTAT’s expectations for GIS included supporting processes for a complete census count, making data easily available, and providing a foundation for future statistical surveys. Albania’s statistics department launched an enterprise GIS that enabled the country to meet these requirements, as well as complying with statistical standards. The system was used to complete the 2011 Albania Population and Housing Census and continues in place today, supporting the agency and the community.
GIS became an agent of transformation. INSTAT integrated geospatial processes with official statistical production to make its data location-based. The system improved continuity by connecting workflows and outputs. GIS also improved the quality of the institute’s data by running built-in processes that verified and checked accuracy.
INSTAT increased the value of its GIS by extending its usefulness beyond the initial census project, and the institute is now using it for planning and implementing current statistical operations. INSTAT’s digital data and maps are interoperable with other institutions’ digital maps and geographic data resources. Statistical information from INSTAT is readily available via a Web GIS application that is open, allowing users to gain access to information. “The statistical maps can be created by our users themselves with specific classification as per needs or specifics of the studies or phenomena,” according to Ervin Shameti, head of cartography and GIS sector.

Figure 2. INSTAT web application.
System rollout
Pre-enumeration phase
To begin, the GIS team built an enterprise geodatabase that various team members could access. Using geodatabase tools, they digitized building footprints and street lines from high-resolution orthophotos to create basemaps of the entire country. Because the digitization process would follow a complex workflow for managing vector and raster data, the team developed specific tools for quality and topology control that reduced editing errors and inconsistencies.
Next, the team customized software tools to delineate census enumeration area (EA) boundaries and codes. To reduce human error, the team built an algorithm that partially automated workflow procedures for mapping the physical morphology of the territory (ridges, slopes, streams), the boundaries of administrative units, the location and shape of roads and streets, and buildings.
Census controllers and supervisors began asking for EA and administrative maps. To produce these products, the team used a GIS tool to create a series of layout pages from a single map document quickly. A feature layer, or index layer, divided the map into sections based on each index feature in the layer and generated one page per index feature. This allowed them to create a multipage map series from a single map document.
Enumeration phase
The team developed an innovative custom application to monitor census coverage in real time during data collection operations. Enumerators transmitted data, such as the number of interviews completed, the number of households, and persons and housing units enumerated, via mobile texts. Located at the INSTAT headquarters, the GIS server mapped the data and made the maps accessible through its web service.
Managers could monitor census progress by date and location. The web service included widgets specific to tracking and visualizing census operational data such as a daily completion count. One widget compared the number of population, households, and housing units estimated prior to the field data collection with the actual number of census units that enumerators had surveyed that day. Another widget allowed users to query the same data and graphically display survey completions by groups, individual census takers, and administrative units.
Managers could use alphanumeric codes to access coverage data by unique identifiers of the census and administrative units. They could also choose to use a map interface to select and visualize data in its geographic context.
Post-enumeration and dissemination phase
To make the census data accessible online, the team developed GIS web applications. Users could interactively select a specific classification method to display the data (manual, natural breaks, equal interval, quantile, geometrical interval). They could also select the number of class breaks, apply transparency, and choose different color ramps. The web application was prepared and published in Albanian and English. Users accessed the app from their computers, tablets, and smartphones at www.instat.gov.al.
GIS technology
INSTAT uses ArcGIS software. The prevailing criteria that led the agency to choose ArcGIS were that it is simple and ready to use. Users can work in a single integrated environment, which reduces system implementation time.
ArcGIS ensured functional workflows between desktop and server environments. System administrators easily configured the system to support multiple departments and business processes without compromising the underlying data. It provided users with census data integrated with spatial dimensions, ensuring that everyone who needed data could access it using a map interface.
The team implemented the ArcGIS geodatabase on a Microsoft® SQL Server to store census data, administrative and statistical boundaries, and orthophotos.
Web GIS developer tools helped the team customize editing operations. Staff performed multiuser edits and digitized building boundaries, EAs, and street lines. An ArcGIS extension processed data from the digital elevation model (DEM) required for delineating EAs.
ArcGIS server technology acted as a dedicated geospatial data engine to support the enterprise. Using its development tools, the team built web applications, such as the mobile app that monitored field operations, and developed client applications in JavaScript™ and HTML. The technology provided a platform for web services that published geospatial information.
Business value gains
By implementing ArcGIS, INSTAT generated high-quality authoritative datasets and published census map products that it shared across the agency and with Albania’s citizens via the web.
Time savings. INSTAT estimates that ArcGIS saved it twenty weeks for print map production and four weeks for data dissemination. The agency also reduced quality assurance activities by ten weeks.
Labor efficiency. The enterprise geodatabase centralized information and automated controls, so the institute needed only two operators to perform quality assurance activities. This allowed managers to concentrate personnel resources on the massive activity of data entry.
Integrated systems. Application programming interfaces (APIs) and developer tools drove rapid application development. The apps were easier to integrate with other systems used during the survey.
Increased data value. Web GIS has made data more accessible, and therefore more people use it. They simply use a search tool to find what they need. Data contains location information so that it can be mapped, which makes the data easier to interpret and analyze. Also, different systems can use the same data for other purposes, which broadens the opportunity to map nonspatial data and analyze it.
Efficient data distribution. Production costs had always limited the number of printed atlases that INSTAT published. Now anyone can access the maps from a browser. INSTAT continues to print an atlas, but new versions include maps with QR codes that link to digital online interactive maps.
Web capability. Departments connect and share data on an enterprise-wide platform. Mobile apps connect field and office staff members. Managers no longer need technicians to make their maps. Rather, they can access GIS in their browsers, create their own statistical maps, and integrate them into their work.
Archival reduction. Digital maps have solved storage space concerns that come with paper maps.
Albania’s INSTAT successfully implemented GIS to modernize its procedures and data system, making the census process more effective and efficient. Most importantly, Albanians now have census information at their fingertips.
References
i.For example, the Esri approach uses nodes, arcs, and polygons as primitives for its vector data model. The first step is to record the location of all nodes—that is, endpoints and intersections of lines and boundaries. Based on these nodes, arcs are defined. (This is why Esri GIS software was initially called ArcInfo and then ArcGIS.) These arcs have endpoints, but they are also assigned a direction indicated by the starting point of the arc, which is referred to as the from node and the destination point as the to node. The orientation of a given arc can be assigned in either direction as long as this direction is recorded and stored in the database. The intermediary points of the lines are called vertices.
ii.See the UN Handbook on Geospatial Infrastructure in Support of Census Activities: “A topologically structured database stores not only individual features but also how those features relate to other features of the same or different feature class. For example, in addition to a set of lines representing a road network, the system will store the nodes that define road intersections, which allows the system to determine routes along several road segments. Or, instead of storing polygons as closed loops, where the boundaries between neighbouring polygons would be stored twice, a topologically structured GIS would store each line only once, together with information on which polygon is located to the left and to the right of the line. This avoids redundancy and facilitates the implementation of many GIS and spatial analysis functions.”
iii.It is worth noting that administrative boundaries such as the block level serve as the smallest area definition for geographic hierarchies in some countries such as New Zealand, Australia, Japan, the US, and Canada. The main reason is that small size and utility of census blocks make them good candidates to serve as a unit for acquiring, managing, and using spatial statistics.
iv.Over two dozen countries and institutions worldwide have already begun the transition to a grid-based statistical system for statistical reporting (i.e., some countries in the European Union since 1970). See, for example, Japan’s experience in Geographic Boundaries of Population Census of Japan, presented at the first meeting of the EG-ISGI at the UN Headquarters in New York, November 2013. Available at http://ggim.un.org/meetings/2013-ISGI-NY/documents/ESA_STAT_AC.279_P20_Geographic%20Boundaries%20of%20Population%20Census%20of%20Japan02.pdf.
v.Recent global efforts have culminated in the development of a discrete global grid systems (DGGS) abstract specification that has been developed under the auspices of the Open Geospatial Consortium (OGC). This system offers further options in the use of grids within the context of the principle of common geographies and in geospatially enabled statistics. See http://www.opengeospatial.org/projects/groups/dggsdwg and http://www.opengeospatial.org/pressroom/pressreleases/2656.
vi.National Statistics Center of Japan (NSTAC) presentation on Utilizing Grid Square Statistics at Esri UC 2018.
vii.UNSD conducted a survey on the main sources of census statistics that are used by countries or areas for producing the total population count for their censuses of the 2010 round of censuses. The compiled information indicates that the traditional census, based on full field enumeration, is still the predominant source of data for producing the total population count. Out of the 138 countries or areas that responded to the survey, 115 (83 percent) use the traditional census. Virtually all the countries or areas in Africa, Latin America, and the Caribbean and Oceania are using the traditional census as the main source of data for the total population count. In Asia, all countries or areas except four—Bahrain, Israel, Singapore, and Turkey—have the traditional census as the main source. Among the North American countries or areas that responded to the survey, Greenland has a register-based census while the rest rely on the traditional census. In Europe, 54 percent of the countries or areas use the traditional census while the rest are using alternative sources to generate the total population count. This report on the results of a survey on “Census Methods Used by Countries in the 2010 Census Round” is available at http://unstats.un.org/unsd/census2010.htm.
Notes
1.The “raster” concept will be defined in the next section.
2.The GIS community has used interchangeably the terms geographic, spatial, and geospatial to designate the data about objects on the earth’s surface. Geospatial data and information are more and more predominantly used by the global geospatial information management community.
3.It would be also called entities or features.
4.See the book Geographical Information Systems: Principles and Applications from Paul A. Longley, Michael F. Goodchild, David J. Maguire, and David W. Rhind.
5.SQL is an International Organization for Standardization (ISO) standard ISO/IEC 9075, a standard database query language adopted by virtually all mainstream databases.
6.The Handbook of Geographic Information Science, edited by John P. Wilson.
7.The relational model for database management uses a structure and language following some basic logic rules and was first described by Edgar F. Codd in 1969.
8.See pages 3–36 in the book The Entity-Relationship Model: Toward a Unified View of Data by Peter P. S. Chen.
9.See “What is a geodatabase?” in ArcGIS Desktop Help at https://desktop.arcgis.com/en/arcmap/latest/manage-data/geodatabases/what-is-a-geodatabase.htm.
10.The scale is the most important parameter that must always be present on a map: it is the ratio of the distance on a map to the corresponding distance on the ground. For example, on a 1:100,000 scale map, 1 cm on the map equals 1 km on the ground. Also, 1:1,000 or 1:5,000 is considered a large scale while 1:1,000,000 or less is considered a small scale. But this is often confusing or interpreted incorrectly, most likely because large scales are used to represent small areas of earth, while small scales represent large areas.
11.We will not go into the principles of satellite remote sensing and GPS because the concepts are easily found online and in many books, including the UN’s Handbook on Geospatial Infrastructure in Support of Census Activities and several books from Esri Press, including The ArcGIS Imagery Book, Imagery and GIS, and Essential Earth Imaging for GIS.
12.An orthophoto is an aerial photograph that is usually of very high resolution and which has been geometrically corrected. It combines the detail of an aerial photograph with the geometric accuracy of a topographic map. It is also called an orthoimage.
13.Examples include the Landsat initiative that makes data open and accessible or the new Sentinel 2 data. See chapter 5 on imagery for more information.
14.The definitions in this book follow the guidelines of the UN’s Principles and Recommendations for the 2020 Round of Censuses. See pages 94–95 of Principles and Recommendations for Population and Housing Censuses (UNSD, 2015).
15.See Timothy Trainor’s “Advantages and Disadvantages of Grid-based, Population and Administrative Geography Approaches” from the second meeting of the UN-EG-ISGI in Lisbon, Portugal, in 2015.
16.See Timothy Trainor’s “Common Geographic Boundaries: Small Area Geographies, Administrative, and Grid-based Geographies—One or Many?” from the US Census Bureau in 2014.
17.See “Production and Dissemination of Grid Data Since the 1970 Census in Finland.” 2010 CES - ECE/CES/2010/11. Available at http://ggim.un.org/meetings/2010-Paris/documents/Production%20and%20dissemination%20of%20grid%20data-Finland-e.pdf.
18.See note by the US Census Bureau in Combining Variable Spatial Data with Grids to Improve Data Visualization. ECE/CES/2010/12. Available at http://ggim.un.org/meetings/2010-Paris/documents/US%20Paper-e.pdf.
19.As stated earlier, the UN-GGIM Committee of Experts established an Expert Group to carry out the work on developing a statistical-geospatial framework as a global standard for the integration of statistical and geospatial information.
20.For example, Japan started with a population/administrative approach and then moved to a grid-based approach.
21.See “In-Depth Review of Developing Geospatial Information Services Based on Official Statistics,” Note by the United Kingdom Office for National Statistics. ECE/CES/2016/7. Available at https://www.unece.org/fileadmin/DAM/stats/documents/ece/ces/2016/mtg/CES_7-In-Depth_Review_Geospatial_adv_copy.pdf.
22.See South Africa Dwelling Frame. Available at https://undataforum.org/WorldDataForum/wp-content/uploads/2017/01/TA2.03_Laldaparsad.SouthAfricaSLaldaparsad_UNWDF_Jan2017-ver1.2.pdf.
23.See the Poland Central Statistical Office’s “The Polish Modern Census: Incorporating Geospatial Technology and Data with Administrative Information.” Available at http://ggim.un.org/meetings/2014-Global_Forum/documents/PL%20J.Dygaszewicz%20GGIM%20NY%202014.pdf.
24.Other countries are increasing using the register-based approach like Australia and the Gulf countries.
25.See the UN’s Principles and Recommendations rev.3. Available at https://unstats.un.org/unsd/publication/seriesM/Series_M67Rev3en.pdf.
26.See Netherlands paper: Cartography, Google and Neighbourhood Statistics presented at the Conference of European Statisticians (CES), 2010. ECE/CES/2010/16. Available at https://www.unece.org/fileadmin/DAM/stats/documents/ece/ces/2010/16.e.pdf.
27.Enumeration area—the operational unit for data collection during the census that comprises the lowest level of the geographic hierarchy of administrative and statistical units. (Cf. Principles and Recommendations definition.)
28.For more details, see the UN Handbook on Geospatial Infrastructure in Support of Census Activities.
29.See Philippine Statistics Authority’s “2015 Census of Population.” Available at http://rsso05.psa.gov.ph/content/2015-census-population.
30.Where geocoding requires a database of properly formed address, a database of streets, and a set of rules for matching the addresses to the streets.
31.See the UNSC’S Final report for the Expert Group on the Integration of Statistical and Geospatial Information, May 2015. Available at https://unstats.un.org/unsd/demographic/standmeth/handbooks/series_f103en.pdf.