The radio broadcasting industry nourished the “talk booth” concept in the early years. The size of the speech studio only needed to be large enough to accommodate one person (or possibly two for an interview), a table, a few chairs, and a microphone. This sanctified telephone booth-sized studios with very serious built-in acoustical problems. To understand the reason for these problems, we must realize that a roomful of air is a very complex acoustical vibrating system. In fact, it is a series of many resonant systems superimposed upon each other forming a super complex problem.
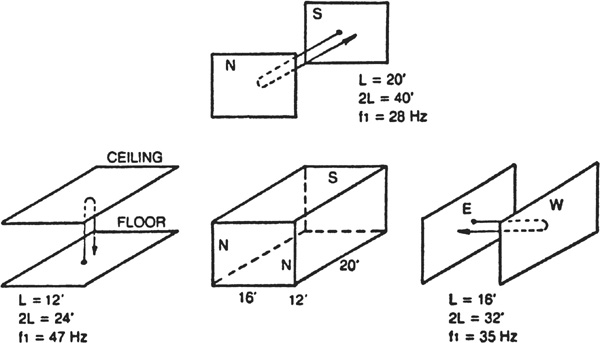
Let us consider a rectangular studio 12 feet high, 16 feet wide, and 20 feet long (ratios 3:4:5) as sketched in Fig. 6.1. First we shall pay attention to the two opposite and parallel N-S walls, neglecting for the moment the effects of all the other surfaces. Even though acoustically treated to some extent, some sound is reflected from these surfaces. For sound to travel a distance of one round trip between the two walls, or 2L feet, takes a certain, finite length of time. This time is determined by the velocity of sound which is about 1130 feet per second (about 770 miles per hour). At a frequency of 1130/2L Hz, this pair of opposing, parallel walls L feet apart comes into a resonance condition and a standing wave is set up. For example, in the N-S pair of walls in Fig. 6.1, L 20 feet and the frequency of resonance is 1130/40 or approximately 28 Hz.
FIGURE 6.1 The six surfaces of a rectangular room are broken down into three pairs of opposite and parallel surfaces when considering axial mode room resonances. Each pair has its fundamental resonance frequency and train of harmonics.
This resonance effect also appears at every multiple of 2L. Harmonics of 28 Hz appear at 56, 84, 112, 140 … etc. Hz. Although the term “harmonics” is not precisely accurate in this context, we’ll use it for convenience. The single pair of walls then gives a fundamental frequency and a train of harmonics at which resonance effects also occur, called axial mode room resonances. The E-W walls (Fig. 6.1) give another fundamental frequency of 35 Hz and a train of harmonics. The floor-ceiling combination gives a fundamental frequency of about 47 Hz and a third series of harmonics. These modal frequencies determine the sound of a room. They yield bad effects only if they pile up at certain frequencies or are spaced too far apart, as we shall see later.
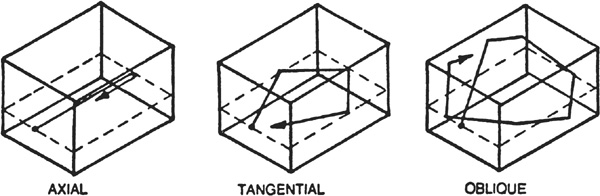
We have considered only axial modes of this room involving a single pair of surfaces. There are also tangential modes involving two pairs of surfaces and oblique modes involving three pairs of surfaces which have still different fundamental frequencies and harmonics (Fig. 6.2). Taken all together, these make the sound field of an enclosed space extremely complex. Fortunately, the effect of tangential and oblique modes is less than that of the axial modes. Basically, you can get by quite easily and reasonably accurately in designing a studio by considering only the axial modes, although you must depend on the resonance effects of tangential and oblique modes to do a certain amount of filling in between the axial modes.
FIGURE 6.2 Axial modes involve two surfaces; tangential modes four surfaces; and oblique modes six surfaces. The axial modes commonly dominate small studio acoustics.
Because of the standing wave effect the sound pressure at 28 Hz is far from uniform across the room, being very high near the surface of the N and S walls and zero at the center of the room. The situation is very much like the inside of an organ pipe closed at both ends. At the second harmonic near 56 Hz, however, the distribution of sound pressure in the standing wave is quite different, with two null points and a maximum in the center of the room as well as at each wall surface. When complex sounds of speech or music excite the fundamental and harmonics of a single series there is extreme complexity between a single pair of wall surfaces as the standing wave patterns shift. Adding the effects of the E-W and vertical modal series and adding the tangential and oblique modes results in a constantly shifting music or voice sound field, the complexity of which defies description.
Each room resonance frequency has a certain bandwidth (or Q).6,* The ideal situation is to have adjacent resonances (fundamentals and harmonics) locked arm in arm with neighbors through these resonance skirts. This results in signal components of constantly fluctuating frequency being treated uniformly. If the spacing of these resonances is too great, some of the precious signal energy is boosted by resonances, and some which “falls in the cracks” is discriminated against. On the other hand, if three or four room resonances occur at the same frequency or are very close together, signal energy in this part of the spectrum receives an abnormal boost. Such pileups are inevitably accompanied by gaps elsewhere in the spectrum. Good studio sound requires careful attention to these resonance frequencies which are, in turn, controlled by room dimensions and proportions.
Room size determines how the low frequencies are treated. The larger the room, the lower the frequency components the room can support. Small rooms result in great spacing of room modes. A talk booth of 6 feet × 8 feet cannot support sound lower than about 70 Hz. Even though there is little energy in voice below 150 Hz, such a small room is unsuitable for recording because of excessive mode spacing. The BBC has concluded that any studio of less than 1500 cubic feet is not practical. Any saving in construction cost is outweighed by cost of correcting acoustical deficiencies—and usually successful correction of deficiencies is not feasible.
We have considered the three axial frequencies and the three series of harmonics of the studio of Fig. 6.1. Now we must ask the question, “Are these frequencies properly distributed?” To answer this, each frequency must be computed and examined. This may be a bit tedious, but it involves only the simplest mathematics.
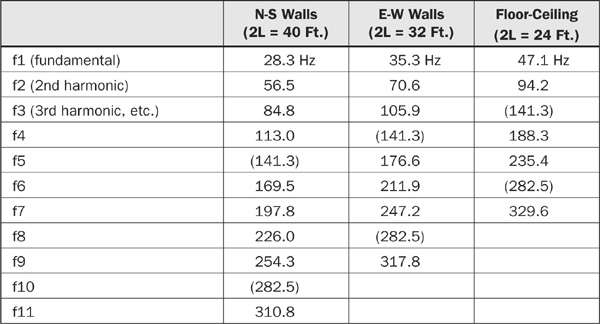
A convenient approach is to tabulate the series for each of the three room dimensions, such as in Table 6.1. The 141.3 Hz and 282.5 Hz occur in each column, and they bear a 2:1 relationship to each other. These coincident frequencies are called degeneracies. How well the other modal frequencies are distributed overall is difficult to see from columns of figures.
TABLE 6.1 Axial Resonance Frequencies
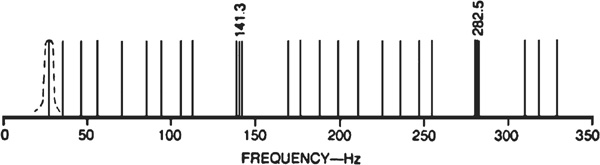
In Fig. 6.3 each modal frequency is plotted on a linear frequency scale. Each mode is represented by a vertical line, although actually each one has an average bandwidth of about 5 Hz (as shown for the lowest mode of Fig. 6.3). The triple coincident frequencies at 141.3 and 282.5 Hz are greatly spaced from their neighbors. The piling up at 141.3 and 282.5 Hz means that signal energy near these frequencies will be unnaturally boosted. Also, the great separation from neighboring modal frequencies guarantees that signal components in these gaps will be unnaturally depressed. This adds up to almost certain audible colorations at these two frequencies that are monotonous, and repetitive blasts of energy which distort music and are particularly obnoxious in speech.
FIGURE 6.3 The axial mode frequencies of a rectangular room 12 × 16 × 20 feet are shown as lines, although each has a bandwidth of approximately 5 Hz as indicated on the extreme left. Three coincident frequencies at 141.3 and 282.5 Hz are separated slightly for clarity.
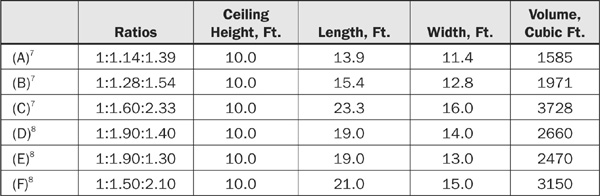
The 3:4:5 proportion of Figs. 6.1 and 6.3 were, at one time, highly recommended but they are ill-suited for studio construction because of poor modal distribution. What room proportions should be used? Numerous studies have been made on this subject. Three suggestions from each of two authors are presented in Table 6.2. In this table, studio dimensions following the suggested ratios are included based on a ceiling height of 10 feet. The studio volume, which varies from example to example, is included for each ratio.
TABLE 6.2 Studio Proportions
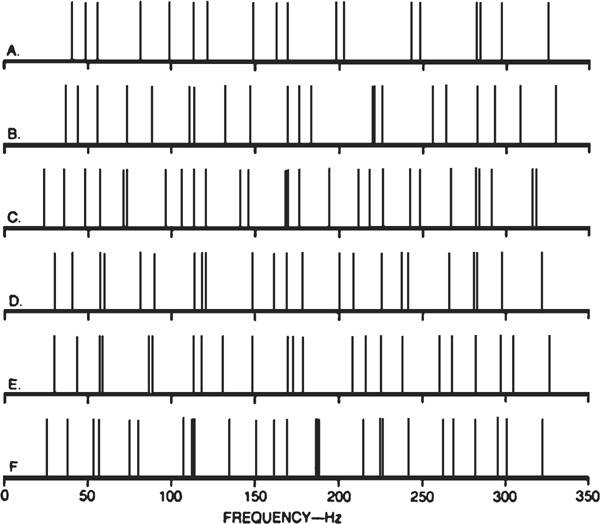
For a visual comparison of these ratios, the fundamental and harmonic series is plotted for each in Fig. 6.4. Although there are scattered double coincidences, all six show better distribution than the unfortunate 3:4:5 choice of Fig. 6.1. Yet none shows the equally spaced modal frequencies desired in our ideal studio. Nor should this bother you too much. It is just as bad to place too much emphasis on room proportions as it is to neglect them completely.
FIGURE 6.4 A plot of axial mode frequencies of six of the best studio dimension ratios listed in Table 6.2. Lines representing coincident frequencies are slightly displaced in several instances for clarity.
The presence of people and furnishings in a room so affects the actual modal frequencies that it is futile to worry over minor deviations from some assumed optimum condition. A practical approach is to be alert to problems of coincidence and mode spacing; to do what can be done to optimize them and then relax. If an existing space is being considered as a studio or control room, check the modal frequencies after the fashion of Table 6.1 and plot them as in Fig. 6.4 to see if serious problems exist. For new construction, do the same for proposed dimensions of any sound-sensitive rooms. A liberal education in axial modes awaits the persevering student who varies one dimension of a room (on paper) while holding the others constant and noting how the modal distribution is affected. You’ll soon conclude that eliminating coincidences is a major victory—beyond that, there is little to be gained.
In Table 6.2, the ceiling heights of the room are held constant and volume is allowed to vary. If the several proportions were adjusted so that the volume remained constant, the ratios would draw closer together. This is illustrated in Table 6.3 in which the ratios of Table 6.2 are adjusted so that all volumes are the same as that corresponding to the first ratio. In other words, when rooms of the same volume but of different proportions are considered, the six ratio examples we have been studying are not as different from each other as they first appeared to be. However, they are different, relatively speaking, and you cannot escape the fact that smaller dimensions yield higher fundamental frequencies.
TABLE 6.3 Varying Proportions with the Same Volume
The fundamental resonance frequencies and harmonics of the ratios of Table 6.3 adjusted for the same room volume are plotted in Fig. 6.5. Figures 6.4A and 6.5A are, of course, identical as they represent the common point of comparison in the two cases. Although frequencies are shifted, a family resemblance can be seen when comparing Figs. 6.4B and 6.5B, Figs. 6.4C and 6.5C, and other corresponding pairs. The coincident or nearly coincident pairs of Fig. 6.4 still exist in Fig. 6.5. In general, however, the larger rooms of Fig. 6.4 have the advantage of yielding closer average spacings.
FIGURE 6.5 A plot of axial mode frequencies of the same six examples of dimensional ratios of Fig. 6.4 but adjusted for the same room volume of 1585 cubic feet. Some coincident lines are displaced slightly for clarity (refer to Table 6.3).
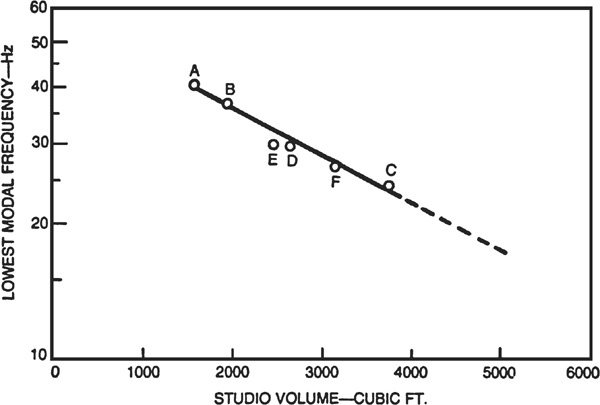
An inspection of the left edge of the six plots of Fig. 6.4 reveals that the larger rooms have lower fundamental frequencies than the smaller ones. In Fig. 6.6 the fundamental room resonances corresponding to the longest dimension of the six cases are plotted against room volume. For the smallest studio having a volume of 1585 cubic feet (Fig. 6.4A), the lowest signal frequency which would have the advantage of resonance assistance is about 41 Hz. The studio of Fig. 6.4C, with its volume of 3728 cubic feet can handle signal components down to 24 Hz. For speech purposes, the smaller studio is quite adequate, because speech energy below 40 Hz is extremely low. The 3728 cubic foot studio adds almost another octave in the lows, which is quite advantageous for music recording.
FIGURE 6.6 The six lowest modal frequencies of Fig. 6.4 as related to room volume. A 4000 cubic foot studio adds one octave to the room’s low frequency response as compared to a studio of 1500 cubic foot volume.
This discussion has been based on the axial modes of a room. The tangential and oblique modes have somewhat longer paths and hence would tend to extend the low frequency limit of a room. While axial modes have two reflections per round trip, tangential modes have four and oblique modes have six (refer again to Fig. 6.2). As energy is lost at each reflection, the reason for the lower amplitudes of tangential and oblique modal resonances is apparent.
However, axial reflections are perpendicular to the surfaces, the angle of incidence which gives the most efficient absorption. Tangential and oblique modal paths, while involving more reflections, are usually at smaller angles of incidence. This results in less absorption at each reflection. The limit is grazing incidence at which absorption is very small. Thus, the number of reflections for tangential and oblique is greater than for axial modes, but, acting in the other direction, there is the fact that the smaller angles of incidence result in less loss per reflection than the 90° incidence of axial modes. How do these opposing factors add up? Since the axial modes are more dominant than the tangential and oblique modes, the practical extension of a room’s low frequency response due to tangential and oblique modes is limited.
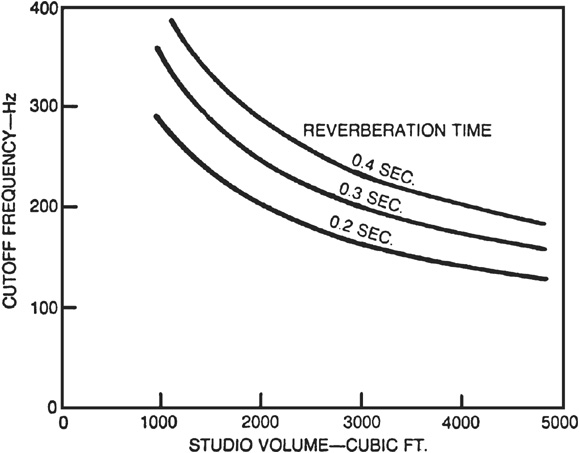
Every studio has some frequency above which the modal frequencies are close enough together to merge into a statistical continuum. This is called the cutoff frequency of the room. At frequencies higher than the cutoff frequency, various components of the signal will be treated more or less uniformly and the room will act more like a large auditorium. At frequencies below cutoff, excessive spacing of modes exists with resulting uneven treatment of signal components.
The cutoff frequency of a room is a function only of its reverberation time and volume and may be computed approximately from the following statement:9
where
Figure 6.7 is computed from this basic statement for volumes and reverberation times common in small studios. The larger and the more dead a studio, the lower the cutoff frequency and the less difficulty in handling the low end of the audible spectrum. In Figs. 6.3, 6.4, and 6.5 the plots of modal frequencies were terminated at about 300 Hz, which approximates the cutoff frequency of the average small studio above which modes are increasingly closer together.
FIGURE 6.7 The cutoff frequency of a room is that frequency above which modes are numerous enough and close enough together to merge into a statistical continuum. Cutoff frequency is determined only by the volume and reverberation time of the room.
• Rooms smaller than 1500 cubic feet are subject to insurmountable room mode problems and should be avoided for quality recording studios and control rooms. The larger the room, the closer the average spacing of modal frequencies and the more uniform the treatment of the various components of the signal.
• In choosing studio proportions, try to eliminate coincident frequencies below 300 Hz. Multiple coincidences in the region below 200 Hz are more apt to cause audible colorations than those between 200 and 300 Hz.
• Once multiple coincident frequencies are reduced or eliminated it is futile to carry modal analyses to extremes because occupants, furnishings, and other room irregularities result in great deviations from the idealized paper condition.
• The splaying of studio walls may be helpful in reducing flutter echo, but modal frequencies are only shifted to some unknown values. Splaying may also tend to break up degeneracies (coincident frequencies) in an otherwise symmetrical room, but keeping things under control by choosing proper proportions of a rectangular room is a satisfactory approach if flutter echo and diffusion are controlled by proper placement of absorbing material.
• What can be done to treat an unavoidable coloration in a studio? A tuned Helmholtz resonator can be introduced to tame the coincident frequency. The sharpness of tuning may have to be controlled to avoid the slow decay of sound in a high-Q structure. The construction and tuning of such absorbers is discussed in later sections.