CHAPTER 5
Choosing the Right Place to Start
AT THE THRESHOLD OF every blue ocean initiative is this question: Where do we begin? The answer: We begin by scoping out the initiative, which means working out which business or product/service offering you’re going to tackle.
For a start-up or an organization with only one predominant offering, choosing the right scope is straightforward: To ensure that it gets launched in the blue ocean, not the red, a start-up needs to focus on the offering it’s setting out to create. Focused organizations and small entrepreneurs—be they owners of a single restaurant, a plumbing service, or a local dental practice—should concentrate on their existing offering.
For existing organizations with multiple offerings, however, choosing the right scope is not at all straightforward. Think about GE, IBM, or Procter & Gamble, whose corporate umbrellas cover many large businesses, each with wide product and service offerings. Even a single division of a large organization can present a multitude of possibilities. The Consumer Lifestyle Division of Dutch electronics giant Philips, for instance, offers products ranging from electric shavers, to electric toothbrushes and air flossers, to blow dryers, curling irons, and women’s electric epilation devices.
To help complex organizations like these set the scope of their blue ocean initiatives, we created a simple, but powerful tool called the pioneer-migrator-settler map. It allows you to assess your current portfolio of businesses or offerings in one simple graphic and hence to see beyond today’s performance. With this tool, you will gain a clear picture of your organization’s value innovation pipeline, or the lack thereof, and the prospects for growth inherent in your portfolio.
In this chapter you will learn how to create a pioneer-migrator-settler map for your organization. We will show you how to use the map to select the right scope for your blue ocean initiative. We will also show you how the process of creating and using it builds people’s confidence in and support of the initiative, and how to avoid the traps in plotting it that can be especially problematic for organizations with histories of success behind them.
Mapping Today to See Tomorrow
Traditionally, leaders have used two measures to assess the strength of an organization’s portfolio of offerings: market share and industry attractiveness. The more attractive the market, the thinking goes, and the larger the piece of it you have, the healthier you are, and—here’s the important point for strategy—the less need there is to change course.
But is this so?
Market share is important. And most organizations want more of it. But market share is a lagging indicator. It’s a reflection of past, not future, performance. Kodak, for example, was the market leader in the photographic film industry at the precise moment digital film was taking off. Its market share was staggeringly large, but its strategic vulnerability was high. On the flip side, Apple’s share of the smartphone market was tiny when it launched its iPhone, while BlackBerry’s share was commanding. Yet we all know what happened. Apple’s small market share was a product of its recent entry into the industry, not a predictor of its future success, just as BlackBerry’s large market share was a product of its history that masked its strategic vulnerability.
A similar argument can be made for industry attractiveness, since today’s seductively tempting industry may become singularly unattractive tomorrow if, for example, lots of other organizations decide to jump in and put lots of resources behind their move.
The pioneer-migrator-settler map largely gets around these issues by replacing market share and industry attractiveness with “value” and “innovation.” Value is crucial, because it forces you not to rest on your laurels but to assess each of your businesses based on the value they currently deliver to buyers. The value you deliver today drives buyer behavior, which determines your future growth prospects, whereas the value you delivered yesterday determines your current market share.
Innovation, on the other hand, is key because it allows you to overcome existing industry conditions. Without it, companies are stuck in the trap of competitive improvements. With it, even a once-declining industry can be turned into a highly profitable growth market. Think of ActiFry’s strategic move, which turned a highly unattractive commodity industry—electric home French fry makers, which had been declining in value 10 percent per year—into a high-growth, high-margin, new market space. Or citizenM Hotels, which is transforming the stagnant low-profit, midrange hotel industry into a high-growth, highly profitable, new market space of affordable luxury accommodations. Industries, in the end, are what we make them. Do exciting things, innovate, and your industry will become vibrant. Do more of the same, and watch the industry’s attractiveness decline.
Assessing your product/service offerings according to how much innovative value they offer buyers lets you see how strategically vulnerable or healthy your portfolio really is. What you want to understand is this: which of your offerings or businesses are “me-toos” that offer only imitative value; which are better than competitors’ but only marginally so, delivering improved value; and which, if any, are value innovations that deliver a true leap in value. To capture this, the pioneer-migrator-setter map is divided into three segments:
• Pioneers are businesses or offerings that represent value innovations. They don’t have customers; they have fans. They offer unprecedented value that opens up a new value-cost frontier. These are the businesses or offerings that hold the key to renewing your portfolio. Their strategy breaks away from the competition. Pioneers are poised for strong, profitable growth.
• Settlers are the other extreme. These are businesses or offerings that offer value imitation. They compete by making incremental changes to an offering or its price. Their strategy converges with the rest of the industry. Unless the industry itself is growing and profitable, settlers have little or no prospect for growth.
• Migrators lie somewhere in between. They represent a value improvement over the competition and may even be best in class. But they do not offer innovative value.
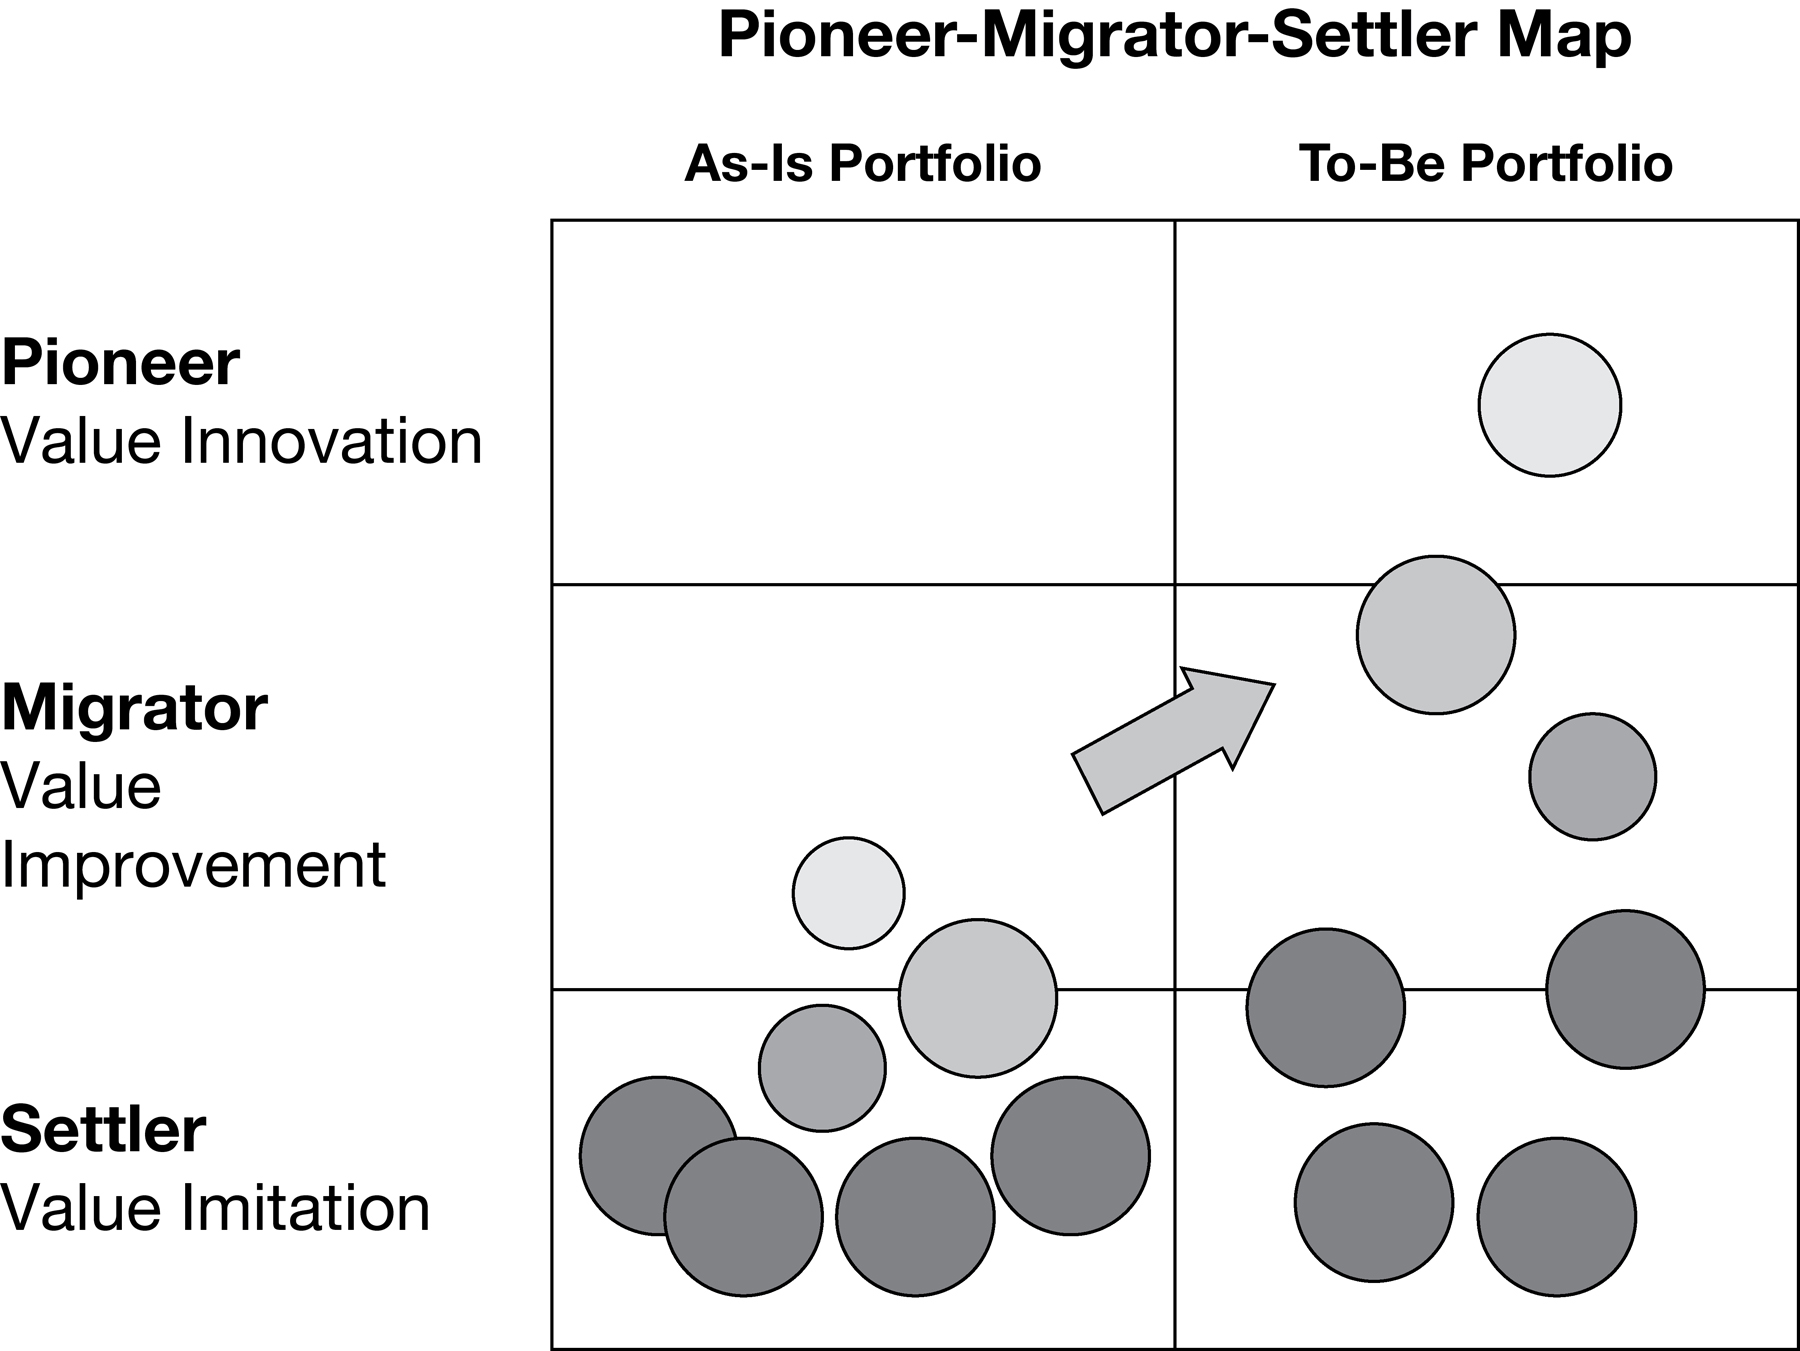
Figure 5-1 shows the filled in pioneer-migrator-settler map of a consumer appliance company. While each circle represents a different business, product, or service, for convenience we’ll refer to all of these as “offerings.” Adding in the current revenues derived from each of the offerings via the size of its circle shows you not only which are poised for growth, or vulnerable to decline based on their position on the map, but also how much is at stake, with a larger circle indicating that more would be at stake.
Figure 5-1
The Pioneer-Migrator-Settler Map of a Consumer Appliance Company

In the case of the consumer appliance company shown in the figure, one thing immediately jumps out: This organization is strategically vulnerable, because it is essentially living off its past success. It may be profitable today, thanks to its commanding market share in several of its units. But it is dominated by settler businesses, which means it is playing off past strategic moves, rather than creating new moves that will become the bread and butter of the future. In organizations with blue ocean offerings, you will see pioneers that are planting the seeds for tomorrow’s profit and growth.
Were you to plot Microsoft’s portfolio on the pioneer-migrator-settler map, you would see that it is in a similar position. Over the last 10 years or so, Microsoft has earned more than US$100 billion in profits; yet its stock price has remained relatively flat, and it is no longer the talent magnet it once was. Why? Were you to plot its offerings on the map, you see that almost all of its profit comes from just two products—Microsoft Office and Windows—both of which are now decades old and settlers. What the stock market and talent no longer see is the company’s next big killer app or any other pioneer. Sure its R&D labs are among the most impressive and well-funded in the world. The trouble is the company is not translating its advances in technology into value innovation offerings.
Microsoft is not alone. When we ask organizations to plot their current portfolios, most resemble the consumer appliance company’s we’ve mapped out here. How about you? If you were to plot your organization’s portfolio, how do you think it would stand in value innovation terms? Are you building your blue ocean growth businesses for tomorrow? Or not?
Understanding your company’s portfolio in terms of its degree of value innovation is critical for two fundamental reasons. First, it allows you to see beyond today’s performance numbers so you can identify whether you are strategically vulnerable and, hence, need to act. Second, having an aerial view of your portfolio, based on value and innovation—the indicators that fundamentally drive buyer behavior—readies you to begin scoping out your initiative. We say readies because even if your portfolio is dominated by settlers, as the consumer appliance company’s is, the last thing you want to do is embark on a corporate initiative to shift them all. That’s simply too broad a scope. And introducing too much change at once will lower people’s trust—in you and in the process—and likely exhaust everyone’s energy.
A successful blue ocean process is based on what we call an “earn the right to grow” approach. This means selecting one settler offering, applying the blue ocean shift process to it, seeing the results, and then, based on this experience, rolling out the process to other businesses or product/service offerings in your portfolio. In addition to helping size an initiative properly, this approach can build confidence among your people and trigger the feeling that you’re being both fair and reasonable, thereby relaxing them and strengthening their willingness to open their minds to new ideas.
How to Plot Your Pioneer-Migrator-Settler Map
Now let’s turn to you and your organization’s map. Defining the scope of your initiative will allow you to create a shared understanding of your portfolio in value innovation terms, and to see how widespread the need for change and blue ocean initiatives is across your organization. Here are the steps you want to follow.
Identify the key businesses or product/service offerings in your portfolio
Start by identifying your key businesses or product/service offerings and choosing the people who will participate in the process. At a minimum, the group should include the heads of each of the organization’s units. Oftentimes, the people selected may wish to bring one or two of their key people into the group. This can be very helpful, as well as feel reassuring, because it means they can calibrate their thinking with others from their unit when it’s time to plot their offering.
Identify which offerings are pioneers, migrators, and settlers
Next, provide each manager with the definitions of pioneers, migrators, and settlers, as we have above. Be clear that the goal is to arrive at a reading of where each business or product/service offering stands in terms of value and innovation and not in terms of market share or industry attractiveness. It is also important to remind people that each offering should be assessed from the point of view of buyers, not in terms of your organization’s other offerings. That is, how would buyers judge your offering: as a pioneer, a migrator, or a settler, compared to the other offerings available to them in the market? We’ve seen managers mistakenly plot an offering as a pioneer because it was the most innovative one the company had. But when we asked them to articulate how their offering provided a quantum leap in buyer value, compared to the available alternatives, it became clear that, from the buyers’ point of view, it was actually quite similar and should be plotted as a high settler. This kind of myopia is symptomatic of an organization that is too internally focused.
In plotting the businesses or offerings, let everyone know that the size of the circles should be drawn as a function of their revenue, relative to the organization’s other businesses (that is, the higher the relative revenue, the larger the circle). If you have a pioneer that does not have a mass following, and therefore is a small circle, place a question mark inside it. When an offering delivers unprecedented value, its revenues should reflect that. When that’s not the case, the question is why. It may be because the offering was just launched, which would make sense. But it might be because it’s actually not a value pioneer at all, but a technology pioneer that few buyers can see the value of. Be sure to explore this point. Many organizations with significant R&D budgets or that operate in technology-intensive industries fall victim to this misconception. When they plot their pioneer-migrator-settler maps, they show a scattering of pioneers. But the circles are usually small, and that’s not because they represent new offerings. As we probe, it becomes clear that, although the managers of these businesses can explain why these offerings represent breakthroughs in technology, they struggle to articulate in simple terms how and why these breakthroughs provide a leap in value for buyers. That’s an important point: It almost always signals a strong disconnect between the development people and buyers, which needs to be addressed if the money invested in R&D and technology development is to translate into commercially compelling blue oceans.
Plot your portfolio
Now, using a blank pioneer-migrator-settler map, plot your group’s assessment of each business or offering. To help you perform this task effectively, relevant materials and templates are provided for your free download and use at www.blueoceanshift.com/ExerciseTemplates. Usually, once a top management team has learned the core concept and workings of the pioneer-migrator-settler map in action, together they can complete their map with relative ease.
The aim is to capture each offering’s current position on the map. Notice that we said “your group’s” assessment and not “your” assessment. Why? As we explained in the previous chapter, firsthand discovery and fair process are critical components of the blue ocean shift process. While you may have an instinctive sense of how your organization’s portfolio should be plotted, that doesn’t mean other key players will agree. Say the manager of a sizable business or product/service offering has an inflated view of his or her unit, even though its offering may have long since become just like everyone else’s. If you were to plot that business or product/service offering as a settler, he or she would most likely pull back, resist, and resent you for seeming to downgrade his or her unit.
The best way to avoid this problem is to have the managers of the different units plot their offerings collectively. As a starting point, ask each of the managers to plot their unit’s offerings on the map. Then open a discussion so that people can probe one another on why the offerings are plotted as they are. Working together in this way helps keep everyone honest. As managers hear others’ perceptions, everyone’s knowledge of the organization’s total portfolio is upgraded, creating a shared understanding. So, in the end, the offerings that get plotted as settlers or low migrators get plotted as such by the people running those units. It’s their call, not yours, which is the outcome you want.
While plotting the pioneer-migrator-settler map, your managers may say they need additional research to assess their offerings’ positions accurately. This seems reasonable. Yet in our work we’ve found that when people are brought together to do the plotting as a group, their perceptions tend to be close to 80 percent accurate. The aim here is capturing the relative position of offerings within their industry, not perfection. In most cases we’ve found that quantitative market research results in slight, but not dramatic, movements on the map. But that research does not fundamentally change the relative position of the offerings. For example, with additional research, what we call a “low migrator” may be found to actually be a “high settler,” meaning it falls just below the demarcation line, rather than just above it. However, the marginal difference does not change the ultimate conclusion. So should this issue arise, try asking questions like these: “If further research were done, what would you expect?” “Do you think your current plotting would shift substantially, or would it be likely to nudge up or down?” “Is it likely that what appears to be a settler might actually be a pioneer, or vice versa?” In practice, we’ve found that nudging is almost always the answer. This tends to put this issue to rest so that the group’s focus can come back to the big picture.
If disagreements within the group arise about how high or low an offering should be plotted, get them to challenge one another’s assumptions by asking what is distinctive about its value and innovativeness. Is the business or product/service offering really a migrator or a pioneer? What is the unprecedented value it delivers? Does it capture the target mass of the market? Alternatively, if people think an offering is plotted too low, ask, “Is it really a settler?” Check to make sure that people don’t have an inflated view of their unit’s offering. Or, conversely, that they’re not underrepresenting its accomplishments. Continue to challenge people and keep the discussion going until there is a consensus that every business or product/service offering is properly positioned. This should allow you to agree on a fairly robust assessment of your current portfolio.
Developing the pioneer-migrator-settler map is an interactive process. Although there is often initial dissent about the appropriate assessments, we find that disagreements very soon become minor and that, after some shuffling, everyone agrees with the final picture.
Inside an Electronics Service Company
What are pioneer-migrator-settler map discussions really like? Let’s listen in on the dynamics of a top management team for a US electronics service company that we’ll call ESC, who were called in by the president to plot their pioneer-migrator-settler map. ESC has built a successful business in field repair for the end customers of electronics corporations and corporate IT and telecommunications infrastructure. Here, we will show how they interact with each other and build their shared understanding as they go through the process of plotting the map. Along with the president, attendees were the business development director, global operations vice president, IT director, strategic planning manager, controller, European operations vice president, Asian operations vice president, and the HR manager.
“As you know, we’ve been doing very well over the last few years,” the president begins. “We are now approaching US$500 million with over 5,000 employees in more than 10 locations.” The president turns to the controller. “And as I can confirm,” the controller adds, “we continue to earn operating margins notably higher than our parent company [a multibillion-dollar corporation].” Heads nod. Almost to a fault, people sit straighter in their chairs on hearing this. People visibly feel good about their performance and proud.
“Despite good business results so far,” the president continues, “what are our prospects for future profitable growth? There are a number of new challenges emerging in the market.”
After receiving an overview of the pioneer-migrator-settler map from a blue ocean expert, the team sets out to plot their portfolio. Upon first blush, it looks like the organization is swimming in a blue ocean. “Those corporate accounts are clearly pioneers,” the business development director argues as they begin plotting their portfolio. “The margins here are at the top of our industry.” “We agree,” the Asian and European operations vice presidents add, nodding their heads. After checking and verifying sales numbers, the controller confirms, “Globally our pioneers account for 35 percent of our total business. Not only are margins high, but so are revenues.” High-fives all around. After more discussion, the team plots another 30 percent of their portfolio in migrators, with only 35 percent of their business in settlers. The top team is feeling pretty good.
In presenting the map, the blue ocean expert notes that the team has plotted their portfolio based on corporate accounts, not based on their portfolio of service offerings. From the perspective of corporate accounts, the map looks strong. Only that’s not the point of the map, so the expert challenges the team. “In our industry,” one member shoots back, “we think and act based on corporate accounts, not service lines. That’s how our industry works.”
“When you are in a B2B service industry like ours, the dynamics are different,” the business development director explains. “It’s all about chasing RFPs [requests for proposals] for large corporate clients. That’s where the money is.” Heads nod in agreement. “When corporate accounts are highly profitable, we’re clearly doing something right. To us—and probably to the rest of our industry—that’s a pioneer.” The temperature in the room is rising slowly.
“All true,” the president responds. “Seen from the perspective of corporate accounts, we certainly have done a good job so far. But we all know that competition has been heating up. The question is: Are the services we offer what they need to be to stand apart and win big accounts in the future without significantly reducing our margins? If not, why should we expect strong profitable growth in the coming years?” You could visibly see people register the significance of the president’s subtle reframing. The industry may focus on chasing large RFPs and high profit margins, and ESC may have succeeded in doing so with its existing service offerings. But the prospect of ESC’s future profit and growth performance needs to be assessed based on how compelling its portfolio of services are from the perspective of customers. Customers will go where they can receive a leap in value.
The team agrees to go back and redraw their portfolio from a service line view of their business. This mapping of their business reveals a very different picture. No matter how much the top team debates and searches for what allows each service line to stand apart, the same answer ultimately comes back. Service line after service line is a me-too settler. “As far as we can tell,” the team concludes, “we essentially offer the same services in the same way as everyone else. Roughly the same quality of repairs, same pricing, same level of customer service, same turnaround speed…”
The team goes silent. Their pioneer-migrator-settler map looks very red. “How can the switch from corporate accounts and profitability to service lines and value innovation paint such a different picture?” one member asks. “We thought we were largely swimming in a blue ocean.” As the team probes the discrepancy, a realization hits them. Many of the corporate accounts originally mapped as pioneers are longtime customers, whose contracts date back five to seven years, while the more recent customers of less than two years are the ones the team has plotted in the settler section of the map.
The standard of what truly constituted a pioneer, or even a migrator, begins to take shape in people’s minds. The team realizes that they may hold inflated views of their business. Given the multiyear contractual nature of the industry, the higher-margin corporate accounts, in fact, seem to better reflect historical success and customer inertia, rather than innovative value delivered or future performance. More recent RFPs won have taken far longer to secure and have profit margins significantly lower than those of several years back. A new mood has set in. The atmosphere is somber.
The president breaks the atmosphere. “We are not in the valley of death,” he reassures the team. “We are still recognized as a leader in the field. We should feel good about that. But nontraditional players are now entering the industry, like major consulting companies intent on chopping the market up. There is also growing talk of some companies keeping field repair processes in-house as a way to build customer intimacy.”
“What are our growth expectations for the next five years?” the HR manager asks.
“Ten percent in real terms,” the controller responds.
“Does our pioneer-migrator-settler map show we have the horses for that?” the IT head continues.
“I was just thinking along the same lines,” the business development director says, as he projects the map the group has just collectively plotted on a wall for everyone to see clearly. The silence in the room speaks volumes. The team realizes that their efforts are focused on benchmarking competitors and making operational improvements. ESC has scant planned investments to rethink and innovate their service line to make it stand apart.
“Well, now. We have our work cut out for us, don’t we?” the president concludes.
What Your Plotted Map Reveals
Once your organization’s map is complete, you are ready to discuss its strategic implications. Is your portfolio settler-heavy—like ESC’s and that of the majority of companies that are stagnant or declining? Has a business that was once a pioneer, generating huge profits and growth, recently become a settler, suggesting that the organization’s growth is likely to slow if another pioneer is not launched?
The ideal portfolio to aim for depends, of course, on your industry. In fast-moving industries, for example, you will want and need to have more pioneers than settlers. In industries with large fixed costs for organizations and sunk costs for buyers, a portfolio with a few solid migrators and maybe one pioneer would be the right mix for securing today’s success while building for tomorrow.
Stress to the group that the objective is not to create a portfolio dominated by pioneers. It is to create a healthy balance between today’s businesses—your settlers that provide cash and a measure of earnings stability—and the pioneers that are the growth engines for tomorrow. This is the path to profitable growth. Figure 5-2 depicts this path for the consumer appliance company, showing how its managers have set out to shift their portfolio’s center of gravity from settlers toward a better balance of migrators and pioneers.
Figure 5-2
Creating a Healthy, Balanced Portfolio: The Case of the Consumer Appliance Company
If, after this exercise, you find that your current map already has a healthy balance across pioneers, migrators, and settlers, your organization is on a solid track to build for the future while seizing the present. In that case, you can hold off on launching a blue ocean initiative. To have a strong growth portfolio, a company needs robust pioneers; but it also needs stable revenues and cash flow to manage market expectations and provide resources. This is where settlers and migrators can add great value.
If, on the other hand, the portfolio you’ve plotted presents a situation not too far from the portfolio in figure 5-1, help the group to appreciate the strategic implications through questions like these: “What are the prospects for strong profitable growth from our settler and low migrator offerings?” “Are their industries growing so rapidly that we can expect strong profitable growth despite the offerings being settlers and migrators?”
Ask what might happen if you were to share the map with Wall Street analysts. Would they expect a positive earnings surprise from the organization, or would they be likely to rate your stock a hold or downgrade it? And, finally, discuss how customers might react to the map. If buyers saw your offerings as settlers or low migrators, would they be impressed and swear loyalty to your offerings? Or would that make them more inclined to demand price cuts and put further pressure on your profit margins?
The point here is to use the map to build a shared understanding of the likely consequences of inaction. Are the organization’s growth ambitions consistent with the aggregated pioneer-migrator-settler map the group has drawn? Or is there is a discrepancy? As the implications sink in, the team’s motivation to launch a blue ocean shift initiative takes hold and grows stronger. Now it’s time to catch the wave and share your intention to select a single business or product/service offering to launch a blue ocean shift initiative and begin upgrading your overall portfolio.
Defining the Right Scope
As you study the map you’ve created, you may find that, like ESC and the consumer appliance company in figure 5-1, you still have too many candidates to choose among. In the face of this common dilemma, we have found the following criteria to be particularly helpful. Ideally, the scope of your initiative should be defined by the business or product/service offering that meets all (or the greatest subset) of these four criteria.
First, the business or product/service offering is a settler or a low migrator; that is, it’s only slightly above settler status, making it clear that it’s currently swimming in a red ocean.
Second, it’s headed by a manager who is eager to break out of the red ocean and believes that fundamentally rethinking the strategy is key to doing that. Selecting a unit with such a manager is crucial: The manager’s enthusiasm and conviction that change is needed are what people in that unit will feed off during the process. This kind of energy both builds people’s confidence and signals that waffling will not be allowed. That goes a long way toward getting everyone on the same page. By contrast, selecting a manager whose unit may desperately need to change, but who offers nonstop excuses as to why things are the way they are, or myriad reasons for why no new idea or approach could possibly work, is to court failure before the process even starts. These kinds of managers project the wrong kind of energy, the kind that signals to those below them that they don’t really believe in the initiative. That, in turn, will eat at people’s confidence and willingness to give their all. You can lead a horse to water, but you cannot make it drink. So don’t try.
Third, ideally, no other major initiatives should be underway in the unit. If the people who support a business or product/service offering are already stretched by a major reorganization, say, or the implementation of a new enterprise resource planning system, this is usually not where you want to start, even if the leader is genuinely interested in undertaking the initiative. People can do only so much beyond their regular jobs and do things well.
Fourth, the business or product/service offering has its back against the wall. While a settler offering may have limited prospects for growth, as discussed above, that doesn’t necessarily mean it’s losing money. In fact, it could still be quite profitable. When a settler or a low migrator offering is not just swimming in a red ocean of competition, however, but is also operating in the red, or facing an onslaught of all-new competitors that are gaining traction fast, that situation helps create a sense of urgency and a willingness to try new ideas to turn the tide. This natural energy tends to unlock a hunger for a new approach that a blue ocean initiative can leverage.
Over the next week or weeks, if needed, engage the managers of each unit in a series of discussions to assess their readiness—and that of their units. Then select the one that best meets all or the greatest subset of these four key criteria.
With the right scope for your initiative set, and with credibility and positive energy building, you are now ready to put the right team together to make a blue ocean shift happen. That’s the subject of the next chapter. So let’s get started.