CHAPTER 7
Getting Clear About the Current State of Play
DO YOU HAVE ONE simple picture that captures your overall strategy, a picture that every manager understands and that puts everyone on the same page? Do you know what factors your industry or target industry competes on and invests in? Do you know what sets your product or service offering apart, and how it diverges from the competition’s? In short, do you and your team have an objective view of the current state of play in your industry?
Whether you are about to embark on a blue ocean shift, or simply want to make sure you truly understand your industry’s status quo, having a clear and shared picture of the current strategic landscape is critical. First, it ensures that you have a strategy, not merely a collection of tactics that may make sense individually, but that don’t add up and may even be contradictory. Second, it ensures that everyone is on the same page. Only when people agree on what the current strategy and strategic landscape are, and see and agree on the clear need for change, will you create real alignment and inspire their willingness to act. You and the team leader you’ve chosen may appreciate the need to break out of the red ocean and fundamentally rethink your strategy, but that doesn’t mean others on the team will share this view, let alone the wider organization.
Beyond this, we’ve found that while managers typically have a strong sense of how they and their rivals compete on one or two strategic dimensions, few grasp the full picture. They may have slogans, which they confuse with strategy, like “We are the friendliest airline,” or “Our strategy is to be the best full-service global bank.” But when we probe for specifics, the discussions are typically fuzzy and full of sound bites that competitors could just as equally easily use to describe their products or services.
To address this problem, we developed the strategy canvas, the diagnostic tool that you will use throughout the blue ocean shift journey. Drawing the “as-is” strategy canvas for your offering will give the team—and, through them, the wider organization—an objective picture of current industry dynamics as well as your own and your competitors’ strategies. Because there is no foregone conclusion about what the strategy canvas will—or won’t—reveal, the team will be able to discover for themselves the relevance, or irrelevance, of challenging the status quo and rethinking the strategic profile of your organization’s offering in blue ocean terms. This combination of fair process, with firsthand discovery and atomization, is what ensures that people will own, internalize, and have confidence in the results of their work.
The Strategy Canvas
The strategy canvas is a one-page visual analytic that depicts the way an organization configures its offering to buyers in relation to those of its competitors. It crisply communicates the four key elements of strategy: the factors of competition, the offering level buyers receive across these factors, and your own and your competitors’ strategic profiles and cost structures. And it tells a story: It allows you to see—and understand—where you and your competitors are currently investing; the product, service, and delivery factors the industry is competing on; and what customers receive from existing competitive offerings. Drawing the strategy canvas of the industry you intend to penetrate is equally critical if you are an entrepreneur intent on creating a new business, or a new nonprofit, because it highlights in one simple picture what you will be up against in strategic terms. It’s also a potent visual to use in discussions with potential investors or funders.
Figure 7-1 shows the strategy canvas for the UK charity fund-raising industry before the launch of Comic Relief. The horizontal axis specifies the key factors the industry historically competed on and invested in, which range from pity pleas, to advocacy counseling and care services, to year-round fund-raising events and activities. Note that this axis captures the “key competing factors,” not the key value factors for buyers. This is important. Why? Because as you will likely soon discover, there is often a stark difference between the factors organizations compete on and assume deliver value and the factors that buyers actually value. In fact, what companies compete on often not only fails to add value from the buyer’s perspective, but can actually detract from it. Think of the year-round fund-raising events and marketing solicitations that charities compete on, which create donor fatigue, rather than inspiring people to give. Think of all the buttons on the average TV remote control, which frustrate and confuse more than they assist. Or think of the vast array of channels you get when you sign up with a cable TV provider, when all you really want are the three or four that carry the shows you love to watch.
Figure 7-1
Strategy Canvas of the UK Charity Fund-Raising Industry (Pre–Comic Relief)
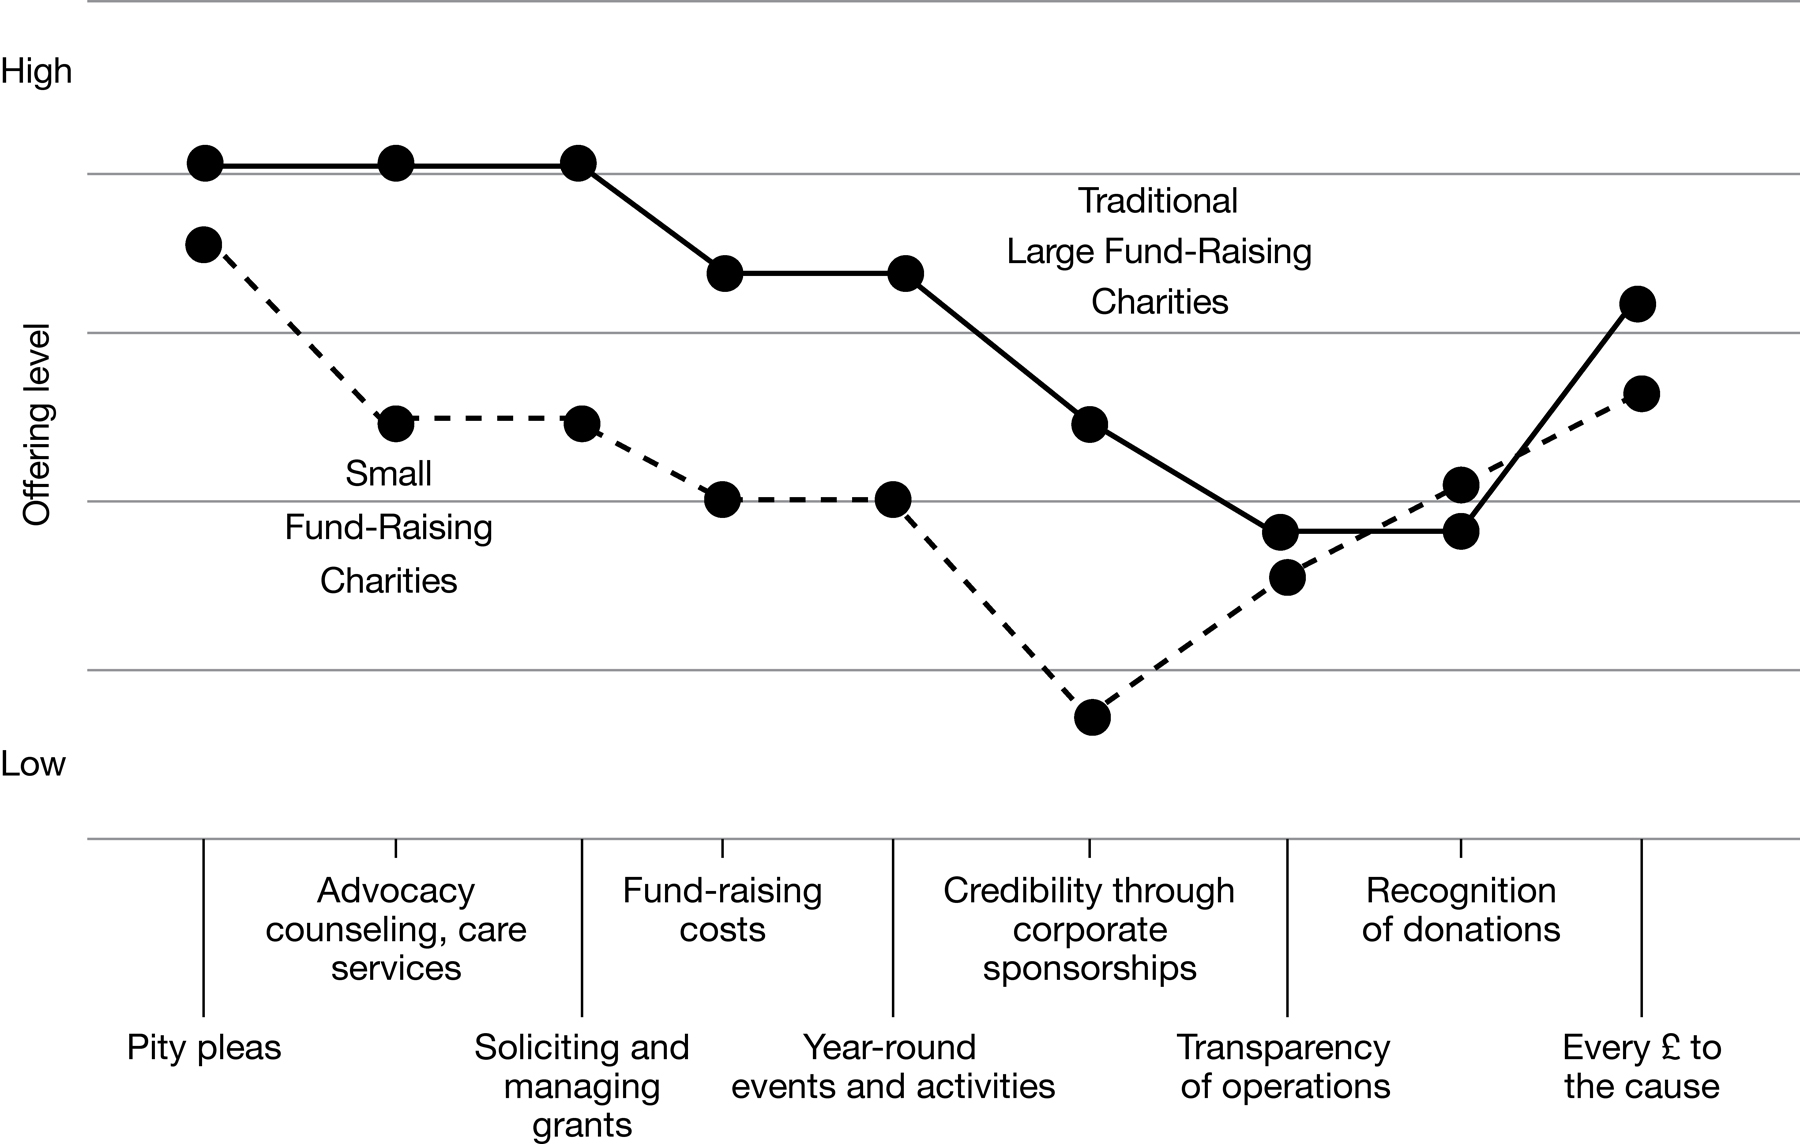
As your team focuses on identifying your industry’s key competing factors, they will also begin to surface all the areas you and your competitors currently invest in as you attempt to keep up with or surge past one another. These factors increase your cost structure, absorb your organization’s time, and can complicate operations. But because they seem to be de rigueur, they are rarely questioned. So as the team expressly identifies these factors, they will also be creating a roster of candidates to consider later, when you’re looking for things to eliminate or reduce in order to drop your cost structure while simultaneously offering buyers a leap in value.
The vertical axis of the strategy canvas captures the offering level buyers receive or experience for each of an industry’s key competing factors. In the case of the UK charity fund-raising industry or, for that matter, any nonprofit, donors are effectively the buyers of the nonprofit’s mission and credibility, which they “pay” for with a donation. A high score on the vertical axis means that an organization offers buyers—here, donors—more, while a relatively low score means that an organization offers less. You now connect the dots to create your strategic profile—a graphic depiction of your organization’s relative performance across its industry’s factors of competition—and your competitors’. A strategy canvas, as exemplified in figure 7-1, is what we call the as-is strategy canvas because it captures the industry’s current as-is state of play. It helps to create a common understanding on industry reality among the team.
What the Strategy Canvas Reveals
Looking at the canvas in figure 7-1, we can literally see why the industry had become a red ocean of competition. The industry has essentially commoditized itself. Despite the fact that there are thousands of charities in the UK, from the donors’ point of view there is enormous convergence in their strategic profiles. From a donor’s perspective, large traditional fund-raising charities all effectively compete in a similar way. The same can be said for small fund-raising charities. What’s more, the strategic profiles of both large and small charities essentially follow the same basic shape, only at different offering levels. As both large and small charities try to improve the value of their offerings by providing a little more for a little less, and benchmark industry best practices, the basic shape of their strategic profiles converges. The result, as seen in the figure, is that industry players’ strategic profiles become nearly mirror images of one another without challenging the basic shape of their curves. This is not rare. It is commonplace.
Think about major retail banks in São Paulo, New York, Paris, Lagos, or Tokyo. Are there any stark differences in their relative locations, façades, atmosphere, or even tellers? Or, from the buyers’ point of view, are almost all of them pretty much the same, except for the language spoken? What about gas stations the world over? Any major differences in what you would expect? Again, the same. Or law firms and management consultancies? Here, too, they’re fairly similar, other than potentially being distinguished by a famous high-profile lawyer or a thought-leader consultant. And these are just a few examples. Take a moment and we are sure you will come up with your own long list of organizations whose strategies are driven by one-upping the competition.
The strategy canvas helps you change that. It pushes you to take a step back from the detail you are typically enmeshed in, and clearly see your industry’s defining contours—to differentiate the forest from the trees. It allows you to capture and depict a macro picture of the current state of play in your industry, without getting lost in the technical details of small operational differences. Focusing on the basic shape of the industry’s strategic profile is essential, because it’s impossible to make a blue ocean shift without challenging and altering the industry’s basic strategic norms. Depicting the small operational deviations that individual players are making in their offerings will only clutter the big picture that buyers see and be irrelevant for your intended strategic shift.
The Importance of Focus, Divergence, and a Compelling Tagline
To make a blue ocean shift, the basic shape of your strategic profile cannot look like everyone else’s. It must distinctively diverge, so that when buyers think about your offering, they do not lump it together with the offerings of other industry players. Specifically, to make a blue ocean shift and stand out to buyers, your strategic profile needs to meet three criteria: First, it should be clear that its basic shape on the strategy canvas diverges from the industry’s average profile. It shouldn’t simply be a little more, or a little less, than what the competition does. Second, your strategic profile has to be focused. It shouldn’t just over-deliver or under-deliver on the same set of factors the rest of the industry competes on. Rather, it should concentrate on the key factors that can offer buyers a leap in value, while eliminating and reducing others. This is what allows your strategy to achieve lower costs at the precise moment you are also offering greater value.
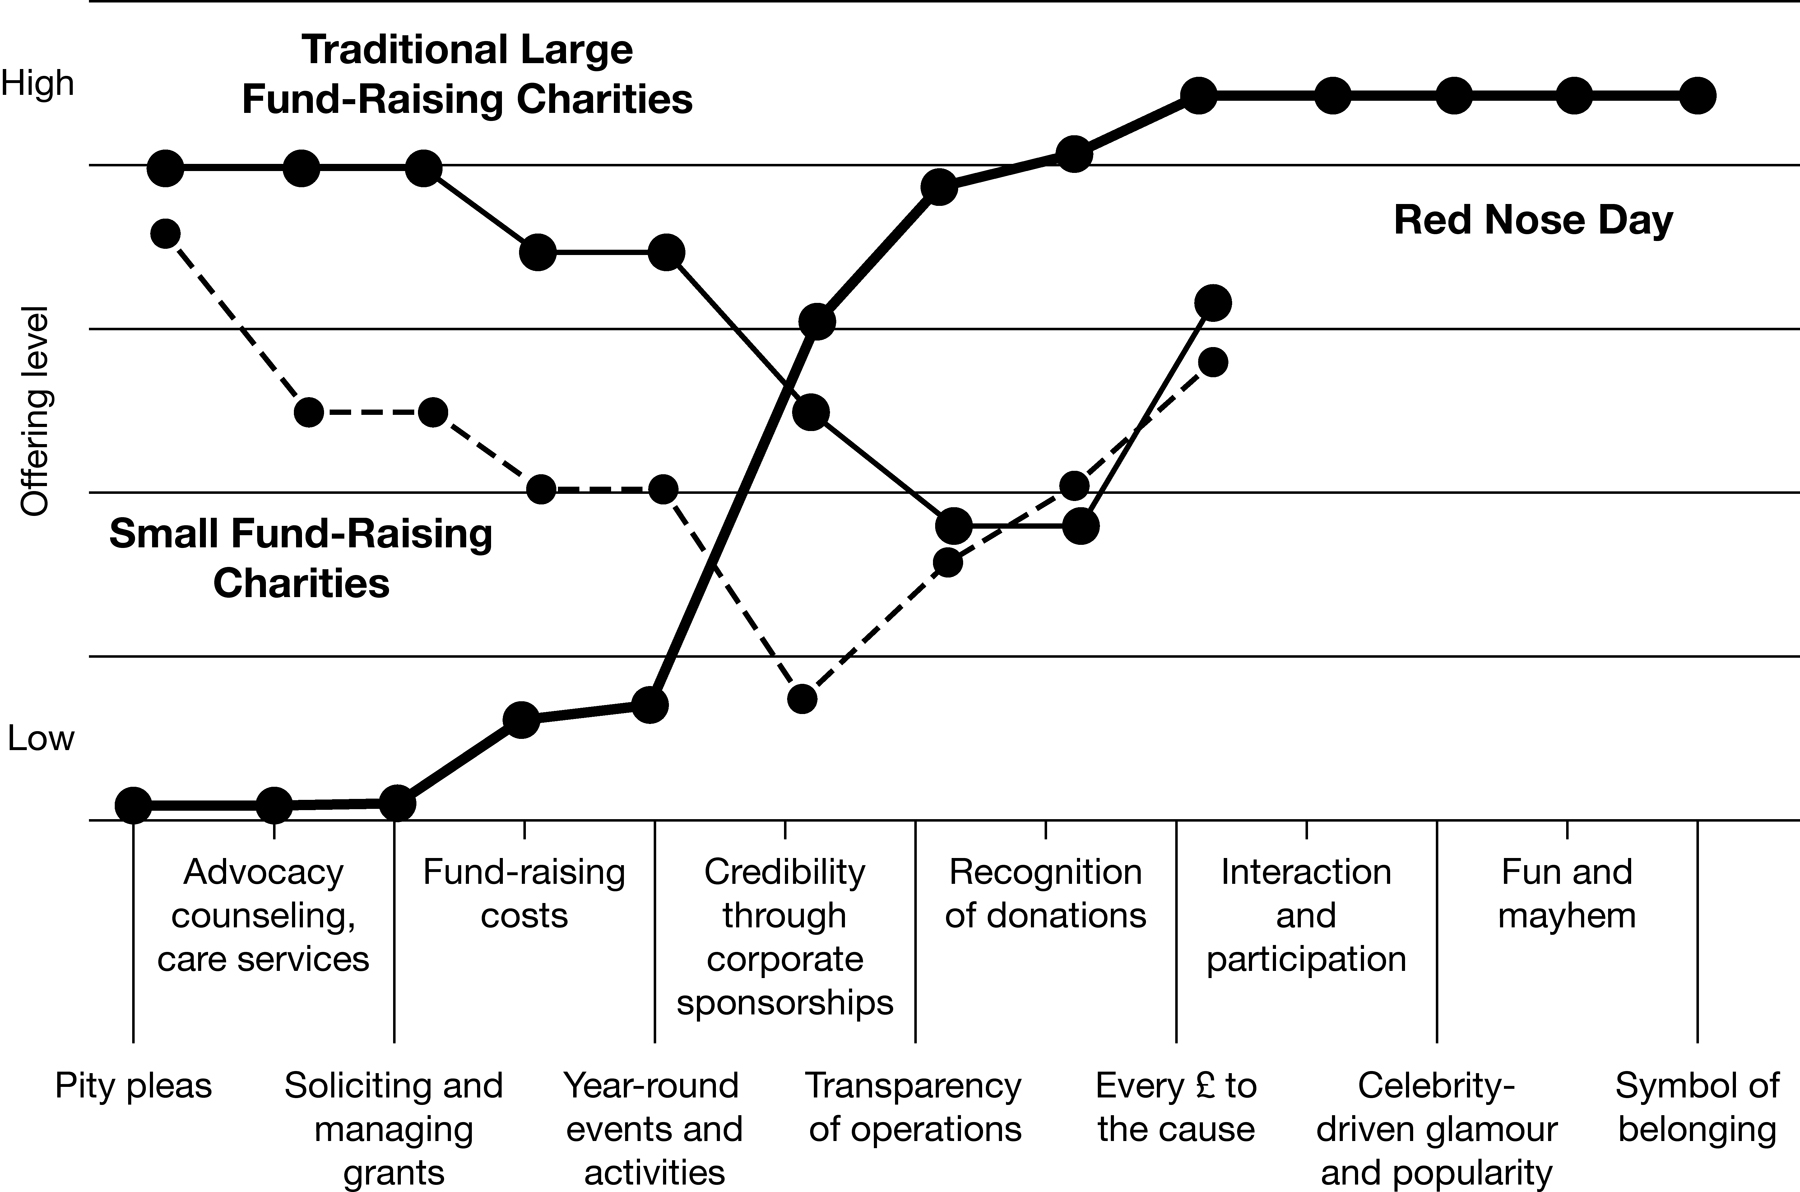
Finally, your strategic profile should have a compelling tagline that speaks to the market and honestly reflects what your offering provides. It must have integrity, not be a wishful marketing slogan. Buyers see through empty slogans fast. A compelling tagline is an important initial litmus test to ensure that the divergence and focus behind your strategic profile are actually linked to a leap in buyer value, and not merely differentiation for differentiation’s sake. Consider the strategic profile of Comic Relief, known as Red Nose Day in the United States, which we discussed in depth in chapter 3. Figure 7-2 shows how its strategic profile meets all three criteria, opening up a blue ocean of new market space in the UK charity fund-raising industry. Later on, in step four of the process, we will show how this new, or “to-be,” strategic profile can be derived.
Figure 7-2
Strategy Canvas of Comic Relief “Doing Something Funny for Money”
What does the as-is strategy canvas of your industry or target industry look like? Would it look like that of the UK fund-raising charity industry pre–Comic Relief, where all the major players’ strategic profiles followed the same basic shape, and essentially converged, from the buyers’ point of view? What does it reveal about your strategic profile? Does it march in lockstep with everyone else’s, or does it stand apart, as Comic Relief’s does? These are not questions for you to answer yourself. These are the questions you should ask the team to answer through the process of drawing the as-is strategy canvas of your industry.
How to Draw Your Strategy Canvas
The as-is strategy canvas is a self-assessment, not a customer survey. The aim is to understand the team’s perspective, what the team members see and register about the current strategic landscape: What do they believe the business or product/service offering you’ve identified competes on? How much or how little of each key factor does your organization and the competition offer? What is the offering’s price point relative to the competition’s? What is its relative cost structure? You will likely be amazed by the plethora of insights drawing your as-is strategy canvas can reveal.
Here is how this step unfolds.
Name the industry you are in
Start with a blank as-is strategy canvas, which, along with a supporting explanation, are provided for your free download and use at www.blueoceanshift.com/ExerciseTemplates. Ask the team to name the industry that the business, product, or service you’ve selected for this initiative competes in or, if you are an aspiring entrepreneur, the industry you desire to enter. The aim is to ensure that everyone on the team has the same reference point and that this reference point is decided by the team, not imposed on them, so that they will fully own the as-is strategy canvas they are about to create. This is typically a straightforward, rapidly accomplished task. However, on rare occasions a team member will start to hypothesize about what industry “we should be in.” If this happens, simply remind him or her that at this stage you’re focused on defining the industry “as it is,” not “as it should be.” That will come later in the process.
Identify the key factors your industry competes on
Before the team settles down to address this task, it’s important to establish a few parameters:
• Identify no fewer than 5 and no more than 12 key competing factors on the as-is strategy canvas. A minimum of 5 pushes teams who say they only compete on price to challenge their assumptions and to uncover factors that may have become so familiar they no longer register. Basic B2B industries like chemicals and plastics, for example, often fall into this camp, because they take it for granted that the product they sell is a commodity and argue that price is the only distinctive point on which they compete, when, in fact, the competitive factors usually include assessment and technical support services, delivery lead times, inventory availability, and more. Conversely, a maximum of 12 factors pushes teams who come up with overly long lists to focus only on “key” competing factors and not every factor they can name. The aim is to keep the team focused on the big picture and neither oversimplify nor get lost in minutiae. In the case of for-profit companies, price should always be included in the key competing factors.
• Key factors can be related to an offering’s product, service, or delivery platforms. So think about all three platforms in coming up with your list. For example, for a turbine engine manufacturer, key competing factors might include customer financing (a service factor), engine power (a product factor), and speed to fulfill orders (a delivery factor).
• Avoid supply-side technical jargon and use words that describe the factor from the buyers’ point of view. For example, speed instead of megahertz.
Before taking up this task as a team, each of the members should develop their own list independently. Beginning this way is key for three reasons. One, it avoids groupthink, which tends to stifle people and to lead to lists that do not fully reflect the range of views within the group. Such self-censorship can engender an unspoken “what if” mindset that may never go away and can discredit the initiative’s conclusions. “If I had mentioned this, would the result have changed? Why didn’t I speak up?” is not the kind of thinking you want when implementation is the ultimate aim. Two, it challenges everyone on the team to name the factors they believe the industry competes on. You will likely find this is a question that few people have ever given much thought to, even though they often come into the process assuming they have. As they usually soon discover in sitting down to answer this question, it’s not easy. Three, it allows the team to appreciate the differences in how each of them interprets what their organization and industry do, and how often people may identify the same factor and yet mean different things (we’ll get to that in a minute). People’s jobs tend to induce tunnel vision, which this process helps to break down.
Once all the team members have created their lists, the team should reconvene as a group. At this juncture, have everyone read their list of identified factors and, as they do, record them on a whiteboard so everyone “sees” what others are thinking. When a factor is mentioned more than once, make a check mark next to it, so that the team can also see which factors most members identified and agreed on.
At this point we typically find that roughly 50–60 percent of the factors identified will be the same. We also often hear members comment casually to one another about the time it took for them to come up with their lists, even if they have just completed their organization’s annual strategic planning process. “If it’s hard for us to identify and agree on the range of factors we compete on, how can we have a clear strategy that is executed with integrity?” is an all-too-common insight. Or, as one executive aptly put it, “Now I know why we never get there. We don’t know where we’re going.” In and of itself, this reckoning opens team members’ minds to the realization that they need to think more deeply about their strategy.
Now initiate and lead a discussion focused on the factors where there was no consensus. Asking each member to explain the reasoning behind the factors he or she identified ensures that everyone will appreciate the variety of ways in which their colleagues perceive the industry and enable them to register factors that were always there but were somehow overlooked. At this stage, the team usually finds that another 20–30 percent of the identified factors are actually getting at a similar point, even though members have labeled them differently. They also learn about factors that only one or two members may have identified, but that are quickly recognizable as “key” factors once the proponents have articulated why.
As the team identifies the key competing factors that will appear on the horizontal axis, they may need to be reminded to describe them from the buyers’ point of view, not the organization’s. Good people or state-of-the-art IT are examples of organizational factors people often confuse with key competing factors. While these may indeed be strengths of the organization, they need to be translated into factors that speak to buyers, if they do. The factors buyers don’t see or experience should be scratched. Good people, for example, might be customer responsiveness, if that’s what the good people produce for buyers. And state-of-the-art IT might translate into ease of use, if that is what it leads to. The point is to continually bring the team around to describing the offering and key competing factors from buyers’ point of view, not the supplier’s.
Similarly, team members often identify brand as a key competing factor. In almost all cases, however, an organization’s brand is a direct function of its strategic profile; that is, of what it offers buyers/users. Apple’s brand is strong because its offering is strong: leading edge, reliable, easy to use, and stylish. Google’s brand is strong because its product works amazingly well, it’s quick, it’s easy to use, and it delivers reliable results. A brand, in short, is the result of what you do. It’s not an isolated, independent factor. To get beyond brand, ask what customers derive from the brand that makes it compelling. For example, what explains Federal Express’s brand? That it’s reliable, fast, gives peace of mind, and so on. To get to the root of the value the team believes a brand conveys, encourage members to think of the top three reasons buyers would purchase the offerings of the organization to which it belongs.
Decide which key player(s) to compare yourself with
Once the team has whittled down the list of key competing factors, they have to decide on the best player(s) to plot their offering against. We recommend selecting the industry leader, whose strategic profile is usually the benchmark others have focused on keeping up with or beating. If you are the industry leader, select your strongest competitor. You may think, “Hey, how can the as-is strategy canvas capture the industry if only the best player is plotted besides ourselves?” To which we reply, take a moment and think about Pepsi versus Coke or Sotheby’s versus Christie’s. Or imagine what the strategic profile of every major investment bank, every major haute couture house, every major accounting firm, and every major state university looks like.
Players in these industries may well argue that there are differences across them, and no doubt there are. But, in the big picture, seen from the buyers’ (or donors’) perspective, they all are pretty much the same. The market leader’s strategic profile typically captures the profile others have been converging toward or, in many cases, have already come close to mimicking. Besides, the strategic profile of the best in class is also the gold standard that defines the industry.
If team members feel that an additional player should be plotted for the strategy canvas to be valid, then let them do so. However, we strongly discourage plotting more than three strategic profiles, lest the strategy canvas become cluttered and start to exaggerate inconsequential differences for buyers. For example, a car that accelerates up to 100 miles per hour in 3 seconds versus 15 seconds may matter to car manufacturers and a small segment of auto enthusiasts. But as ordinary car drivers ourselves, our response to such a difference is—sorry, engineers—“no big deal.” Remember you are looking to capture the big picture from buyers’ perspective, not technical differences from the supplier’s perspective that may speak to a relatively small niche.
That said, there are contexts where it does make real sense to plot more than one best player. This typically happens when an organization operates in a market space served by two distinct strategic groups or alternative industries. For example, in the case of the blue ocean initiative team that was headed by Christian Grob at Groupe SEB, at the start of the blue ocean shift journey, the team plotted the strategic profile of its electric home French fry maker not only against its best-in-class traditional competitor’s, a global consumer appliance company, but also against a new class of competitors, the best-in-class retailer brand’s. With large retailer brands gaining power in the market, Christian’s team saw them as important to include on the as-is strategy canvas.
When we worked with a company in the budget hotel industry, the organization plotted its strategic profile against the market leaders in two strategic groups that were relevant from the buyers’ point of view: one-star and two-star hotels. In another organization, team members agreed that, although the strategic profile of the market leader was generally representative of what other industry players were doing, there was also a newcomer that appeared to be defying industry logic, growing at a fast clip, and garnering lots of attention. This was not just a new player. This was a new, fast-rising entrant that hadn’t started to dominate the industry, but looked like it was on course to do just that. In this case, the team argued that the strategic profile of both the industry leader and this newcomer should be plotted along with its own. These are the types of reasons that make strong strategic sense and that you should look out for.
Rate your offering and the best-in-class player’s or players’ along the key competing factors
Having chosen the best-in-class player(s) you’ll compare yourself with, the team is now ready to rate the offering level for each factor of your business or product or service against theirs. If the team decided that two strategic profiles or groups should be plotted along with your own, rate the offering levels for both of them. For simplicity, however, we’ll reference only one strategic profile here in addition to your own.
Using a 5-point Likert-type scale (or some variant thereof), with 1 equal to very low, 3 equal to average, and 5 equal to very high, ask the team to rate your offering level for a given factor and then your reference player’s for that same factor, before moving on to the next factor. We have found this approach the most effective way to proceed, because it offers a quick reality check if the ratings tend to be too high or too low. As people challenge one another on just where they and the best-in-class player stand on each factor, and why they feel as they do, a lively discussion usually ensues. What team members often begin to viscerally understand during these discussions is that, in the past, they and their colleagues often had different mental baselines for calibrating their offering, and had essentially talked past one another. As a result, while annual strategic plans were produced, they were more often about tactics to hit performance goals than about the big picture. This is another aha moment that seldom gets lost on team members, further opening people’s minds.
In plotting price, the team should use the absolute price—the price tag buyers see. So, a high price should be ranked high on the vertical axis and a low price ranked low. While this may sound self-evident, teams often get this wrong and plot a low price high on the vertical axis and a high price low. Why? Because they are incorrectly interpreting price to mean value. But price is not value. Price is price. Just as a low price tag with a dismal product or service offering does not translate into high value, a higher price tag with a compelling offering does not mean low value.
Team members also often ask whether each competing factor should be weighted as part of this step. To this, our answer is no, because it drives you to focus on the wrong thing. The objective of the as-is strategy canvas is to record the factors the industry currently competes on and invests in, and the offering level buyers receive for each factor as objectively as possible. The aim of this step is not to provide a subjective, value-laden assessment of each offering level, but an objective one: Do we absolutely charge a little or a lot, or offer or focus a little or a lot on each factor, and hence invest accordingly? Later in the process, when team members meet the market, we will drill down into value judgments and shift from what is to what should be.
Draw your as-is strategy canvas
With ratings for the key competitive factors in hand, the team is ready to plot their as-is strategic profile and that of the best-in-class player. The team should begin by putting price as the first competing factor on the horizontal axis, so that it’s clear what value is: Value is what is exchanged when the buyer pays. Everything to the right of price on the horizontal axis is what the buyer is gaining. When the strategy canvas is viewed in this way, it is easy to see what buyers get for the price they pay.
Next, the team needs to plot the other key competing factors along the horizontal axis. In plotting, you want to keep your completed as-is strategy canvas from looking like a bowl of spaghetti—a zigzag, where the offering can be described as “low-high-low-high-low-high.” With such a drawing, it will be very hard to make sense of and communicate the industry’s current state of play. To avoid this, the team needs to plot key competing factors with similar ratings next to each other.
Once this is done, plot the offering level scores the team arrived at for each key factor and then connect the dots to create your as-is strategic profile. The team can then overlay this with the strategic profile of the best-in-class player to arrive at the as-is strategy canvas. Finally, team members are asked to reflect on their as-is strategic profile and see if they can give a compelling tagline that reflects their offering. When they do this exercise, you should make sure the team doesn’t develop an advertising slogan, which doesn’t really relate to the strategy in any meaningful way. The tagline should authentically reflect the strategic profile they are trying to headline. They will likely struggle to come up with a compelling tagline—one that resonates with integrity—for their as-is strategic profile if its basic shape converges with that of the best-in-class player(s).
What to Expect as You Draw Your Canvas
To appreciate the kind of dynamics that unfold and the insights that emerge as a team draws their strategy canvas, consider this vignette from the experience of a US commercial food-service company we’ll call School Foods. The company’s profitable growth had stalled for some time, and two major players dominated the industry. In this instance, the CEO who took on the project chose to be the team’s leader as well.
After discussing their factors of competition, the team began to plot their strategic profile against the two dominant rivals. Given the strength of both, the team argued it couldn’t afford to focus on only one. This concern, however, was quickly found to be groundless. The team fast discovered that not only did the strategic profiles of the two rivals converge, but their own strategic profile also followed in lockstep. The strategic profiles of all three converged along the same dimensions of competition: financial accountability, quality of management services, transparency of bidding processes, and the like. The only difference was that the two industry leaders had higher name recognition, whereas School Foods had a high sense of mission, which the team wanted to include on the canvas as a distinguishing key competitive factor. The team was probed: “Do any of your customers know that you value your sense of mission?” “No, not really… I guess not,” a team member reluctantly replied. Upon reflection and discussion, the team then agreed: They might be proud of their mission, but customers were clueless about it.
“Do you know what your competitors have to offer in terms of food, quality of service, or ambience?” a blue ocean expert asked. The entire team went quiet. There were blank faces all around. Eventually, a team member responded, “No, we don’t really know what they offer, nor do we really know how our food offering is valued versus theirs by our customers.” The probing then went deeper: “Why isn’t the quality of food or variety in the offering noted as one of your factors of competition? You are a food-service company after all, aren’t you?” The group was amused, but ashamed. “I guess we are so focused on winning the bid to provide the service by offering the best financial package desired by the management of the school,” one team member confessed.
“Elsewhere at work you always talk a lot about the importance of building relationships in your business. Why isn’t that on your strategy canvas?” The team members looked at one another. The head of operations said, “We’ve always spent a lot of energy on developing and maintaining relationships, but you know it really doesn’t add value to customers.”
“The industry principally competes on offering an adequate service at the lowest price,” one team member chimed in, “but that’s only half the picture, isn’t it?” “When we really think about it,” another team member added, “the factors our industry competes on are contract-related—price, transparency of our costs in bidding, inclusive pricing. It’s about giving the customer the best financial deal, not necessarily the best food deal for the end user.”
In the span of a 45-minute discussion, the School Foods team realized they were a “me-too” business: Customers didn’t see how their offering differed from their competitors’. With their lower name recognition, they now have a good understanding as to why their company’s growth has stalled for some time. They did not have a clear sense of how their offering compared to that of their competitors in the core of their product—food. And they competed on factors of little or no value to their real customers—the students who eat the food. This was good news. The entire industry was competing on four cylinders. All members of the group could collectively see the wide-open opportunity space to create a blue ocean and now share their willingness and urge to turn on all eight cylinders. They were excited to get started.
Building a Shared Understanding of the Strategic Implications
Now it’s time to draw out the strategic implications of your completed canvas. To start, ask all your team members to write down the key insights they gained from drawing the canvas. Tell them that to kick off the group discussion, each one of them will be called on to share their insights. Inviting people to reflect, collect their thoughts, and crystallize the takeaways that jump out at them is a crucial part of building the trust, confidence, and ownership that are at the heart of making a successful blue ocean shift. Setting clear expectations in advance about what will happen during the group session reinforces that this is a fair process, while turning up the heat to encourage everyone to think deeply.
After each of the team members has shared their insights, you’ll want to reflect on everyone’s observations, using open-ended questions to let people appreciate their collective strategic insights. There are several areas to probe: Does the basic shape of our offering’s strategic profile converge with or diverge from that of the best-in-class player(s)? Does our strategic profile merit a compelling tagline that has integrity? Or does our strategic profile confirm that a more honest tagline might be something like “We try hard, but we’re hardly different from our rivals?” If potential customers saw the completed as-is strategy canvas, would it give them reason to be our fans and purchase our offering, or would they be largely indifferent to it? And if investors saw it, would this give them cause to upgrade their estimate of our future profitable growth prospects and sign off on further funding? The strategy canvas is a powerful tool to use in seeking funding, and in objectively demonstrating to buyers why—when your organization has a compelling strategy—they should, in short, fall in love with you.
To ensure that important insights revealed in the process of drawing the strategy canvas don’t get lost, the team leader should also delve into how much agreement, or disagreement, arose throughout the process. If team members diverged in their lists of key competing factors, relative offering levels, or choice of best-in-class competitor(s), probe for the implications with questions like “How can we consistently sell to the market, when there is no clear strategic vision we all embrace?” “How can we convince customers to buy our product or service when we, as an organization, can hardly agree on what we’re offering?” And “How can we make consistent investment decisions when we hold different views about what our strategy is?”
If you are in an established company with a well-known brand that historically has dominated its industry, but have seen your profit and growth prospects dwindle, along with your ability to pull in the best talent, watch out for two things: In such situations, we have often seen confusion and a high level of denial as to how serious this trend is and how long it might continue. In this instance, your as-is strategic profile may quickly reveal the exact opposite of what it takes to sail into the blue ocean; namely, that in an attempt to monetize your well-known brand, you are charging more for your offering than your rivals are, while ironically offering less along the industry’s key competing factors. (This is usually due to some combination of coasting on your reputation, arrogance, and the rise of rivals who now play your game better than you do.) What your as-is strategy canvas may also reveal—and we’ve seen this happen numerous times as well—is that your strategic profile has essentially become a “me-too” with a high cost structure, because you invest at high levels across the full range of competing factors. Meanwhile, a newcomer that seems to be whizzing by you has a strategic profile that is divergent, focused, and has a compelling tagline. Should either of these scenarios be the case, challenge team members by commenting that “Incremental improvements might buy us time,” and adding, “but would they enable us to create strong profitable growth? Would they really enable our offering to break away from the competition and stand apart while having lower costs?” Then go silent. Let the questions sink in and wait for the team members to respond.
When the as-is strategy canvas tool reveals that your organization’s strategic profile is a “me-too” or inferior to your competition, it is a powerful mobilization tool to underscore the need to make a blue ocean shift. But don’t stop here. There is a maxim that a cup that is full cannot hold any more water. Likewise, when people feel they know it all, they lack thirst. As a result, their room to learn is limited. The challenge is to help team members not only see the need to make a blue ocean shift, but also make room in their mental cups so that they have the space and thirst to look at the world anew, which is at the heart of opening people’s minds to new ideas and making a shift.
To encourage a learner’s mindset, highlight the unknowns that surfaced during this step by recapping the comments team members themselves made along the way. The kind of comments we often hear and that serve this purpose well include:
• “It was more difficult than I thought to identify our key competing factors. Few of us have a good grasp of the big picture and see the industry through the lens of buyers—although, before we drew the canvas, most of us assumed we did.”
• “We and everyone else in the industry tend to reflexively accept the same key competing factors and assume that, because we compete on them, they deliver buyer value. But is this true? Maybe they’re sacred cows or unquestioned orthodoxies that we’ve simply failed to question.”
• “Our strategy tends to be reactive and driven by the competition.”
• “If we had drawn the strategic profiles of all the other players in our industry, they would hardly look different than ours or our chief competitor’s, plus or minus minor differences in customers’ eyes.”
• “I see contradictions in our offering, where we offer a high level on one competing factor, while ignoring others that support it—investing heavily in making our online store beautiful, for instance, while not investing in the speed of loading pages.”
• “There are strategic inconsistencies between the level of our offering and the price. Basically, we’re offering less for more.”
Moving Forward
With the as-is strategy canvas drawn, the team now has a one-page picture that captures the current state of play, the assumptions the industry acts on, and the degree of competitive convergence across the existing players. Instead of being told that change is in order, team members have discovered for themselves the need for change. And because they confirm the need for change, they own it. The completed strategy canvas provides not only a compelling, objective case for why a blue ocean shift is in order—or not in order—but also a good baseline against which to evaluate new ideas.
Occasionally (as we saw in the School Foods example), the team will include an executive member who may also serve as the leader of the blue ocean initiative. Obviously, this has major benefits; but it is not always possible. For this reason, be sure to keep the executive team apprised of the main insights being revealed throughout the process. By keeping executive management informed, you set clear expectations and manage their expectations.
Similarly, after this first step, it is key to have team members return to their areas to share the findings and what they’ve learned from the as-is strategy canvas. Whether with executives or colleagues in their area, they need to walk everyone through the story of what happened in the process of drawing the as-is strategy canvas. This includes explaining how their understanding about the current state of play changed and why, what the as-is strategy canvas reveals, and what the team’s plenary discussion brought to light. This builds buy-in and “no surprises” into the process, which are key to implementation and form a powerful way to boost everyone’s learning and create a common vocabulary and shared “picture” of the as-is strategic reality the organization faces. As most employees are seldom engaged in the strategic conversation of the organization, this process cultivates a culture of inclusion where people feel they matter.
This brings us to the next step in the process where you begin to imagine what could be. In the next chapter you’ll learn to discover all the ways the current industry or your target industry is creating hidden pain points that limit demand for your offering and exclude potential buyers. In the blue ocean shift process, pain points and boundaries are not constraints. They are clear opportunities to change the strategic playing field. So let’s start exploring them.