15.3 Cost Management Considerations
Reducing operating costs and optimizing IT environments are pivotal to understanding and being able to compare the cost models behind provisioning on-premise and cloud-based environments. The pricing structures used by public clouds are typically based on utility-centric pay-per-usage models, enabling organizations to avoid up-front infrastructure investments. These models need to be assessed against the financial implications of on-premise infrastructure investments and associated total cost-of-ownership commitments.
The following chapter provides metrics, formulas, and practices to assist cloud consumers in performing accurate financial analysis of cloud adoption plans.
This section begins by describing the common types of metrics used to evaluate the estimated costs and business value of leasing cloud-based IT resources when compared to the purchase of on-premise IT resources.
Up-front costs are associated with the initial investments that organizations need to make in order to fund the IT resources they intend to use. This includes both the costs associated with obtaining the IT resources, as well as expenses required to deploy and administer them.
• Up-front costs for the purchase and deployment of on-premise IT resources tend to be high. Examples of up-front costs for on-premise environments can include hardware, software, and the labor required for deployment.
• Up-front costs for the leasing of cloud-based IT resources tend to be low. Examples of up-front costs for cloud-based environments can include the labor costs required to assess and set up a cloud environment.
On-going costs represent the expenses required by an organization to run and maintain IT resources it uses.
• On-going costs for the operation of on-premise IT resources can vary. Examples include licensing fees, electricity, insurance, and labor.
• On-going costs for the operation of cloud-based IT resources can also vary, but often exceed the on-going costs of on-premise IT resources (especially over a longer period of time). Examples include virtual hardware leasing fees, bandwidth usage fees, licensing fees, and labor.
To supplement and extend a financial analysis beyond the calculation and comparison of standard up-front and on-going business cost metrics, several other more specialized business cost metrics can be taken into account.
For example:
• Cost of Capital – The cost of capital is a value that represents the cost incurred by raising required funds. For example, it will generally be more expensive to raise an initial investment of $150,000 than it will be to raise this amount over a period of three years. The relevancy of this cost depends on how the organization goes about gathering the funds it requires. If the cost of capital for an initial investment is high, then it further helps justify the leasing of cloud-based IT resources.
• Sunk Costs – An organization will often have existing IT resources that are already paid for and operational. The prior investment that has been made in these on-premise IT resources is referred to as sunk costs. When comparing up-front costs together with significant sunk costs, it can be more difficult to justify the leasing of cloud-based IT resources as an alternative.
• Integration Costs – Integration testing is a form of testing required to measure the effort required to make IT resources compatible and interoperable within a foreign environment, such as a new cloud platform. Depending on the cloud deployment model and cloud delivery model being considered by an organization, there may be the need to further allocate funds to carry out integration testing and additional labor related to enable interoperability between cloud service consumers and cloud services. These expenses are referred to as integration costs. High integration costs can make the option of leasing cloud-based IT resources less appealing.
• Locked-in Costs – As explained in the Risks and Challenges section in Chapter 3, cloud environments can impose portability limitations. When performing a metrics analysis over a longer period of time, it may be necessary to take into consideration the possibility of having to move from one cloud provider to another. Due to the fact that cloud service consumers can become dependent on proprietary characteristics of a cloud environment, there are locked-in costs associated with this type of move. Locked-in costs can further decrease the long-term business value of leasing cloud-based IT resources.
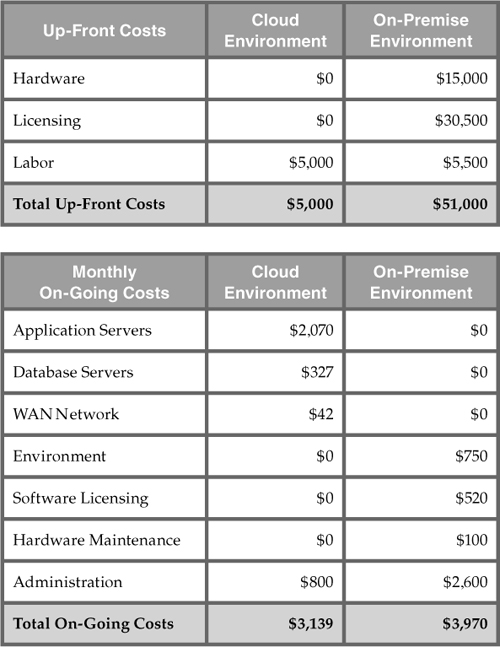
• Licensing: The purchase price for each physical server hosting the application is $7,500, while the software required to run all 4 servers totals $30,500
• Labor: Labor costs are estimated as $5,500, including setup and application deployment.
• Environmental Fees: $750
• Licensing Fees: $520
• Hardware Maintenance: $100
• Labor: $2,600
• Server Instance: Usage fee is calculated per virtual server at a rate of $1.25/hour per virtual server. For 4 virtual servers, this results in: 4 x ($1.25 x 720) = $3,600. However, the application consumption is equivalent to 2.3 servers when server instance scaling is factored in, meaning the actual on-going server usage cost is: $2,070.
• Database Server and Storage: Usage fees are calculated per database size, at a rate of $1.09/GB per month = $327.
• Network: Usage fees are calculated per outbound WAN traffic at the rate of $0.10/GB and a monthly volume of 420 GB = $42.
• Labor: Estimated at $800 per month, including expenses for cloud resource administration tasks.
• On-Premise TCO: $51,000 up-front + ($3,970 x 36) on-going = $193,920
• Cloud-Based TCO: $5,000 up-front + ($3,139 x 36) on-going = $118,004
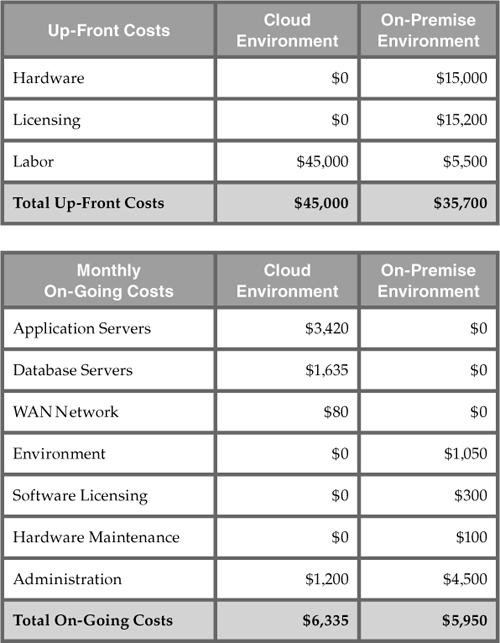
• Licensing: Each physical server that is used to host the application costs $7,500, while the software that is required to run all 8 virtual servers costs $15,200.
• Labor: Estimated at $5,500, the labor cost includes expenses for setting up the new environment and deploying the application on the new servers.
• Environmental Fees: $1,050
• Licensing Fees: $300
• Hardware Maintenance: $100
• Administration: $4,500
• Server Instance: Usage fees are calculated at a rate of $1.25/hour per virtual server. The estimated scaling of the virtual server means that actual service usage is equivalent to 3.8 servers, which results in a total of $3,420.
• Database Server and Storage: Usage fees are calculated per database size at a rate of $1.09/GB per month = $1,635.
• Network: Outbound WAN traffic usage is calculated at a rate of $0.10/GB, at an estimated volume of 800 GB per month = $80.
• Labor: Estimated at $1,200 when cloud resource administration tasks are included.
• On-Premise TCO: $35,700 up-front + ($5,950 x 36) on-going = $251,700
• Cloud-Based TCO: $45,000 up-front + ($6,335 x 36) on-going = $273,060
The following sections describe a set of usage cost metrics for calculating costs associated with cloud-based IT resource usage measurements:
• Network Usage – inbound and outbound network traffic, as well as intra-cloud network traffic
• Server Usage – virtual server allocation (and resource reservation)
• Cloud Storage Device – storage capacity allocation
• Cloud Service – subscription duration, number of nominated users, number of transactions (of cloud services and cloud-based applications)
For each usage cost metric a description, measurement unit, and measurement frequency is provided, along with the cloud delivery model most applicable to the metric. Each metric is further supplemented with a brief example.
Defined as the amount of data that is transferred over a network connection, network usage is typically calculated using separately measured inbound network usage traffic and outbound network usage traffic metrics in relation to cloud services or other IT resources.
• Description – inbound network traffic
• Measurement – Σ, inbound network traffic in bytes
• Frequency – continuous and cumulative over a predefined period
• Cloud Delivery Model – IaaS, PaaS, SaaS
• Example – up to 1 GB free, $0.001/GB up to 10 TB a month
• Description – outbound network traffic
• Measurement – Σ, outbound network traffic in bytes
• Frequency – continuous and cumulative over a predefined period
• Cloud Delivery Model – IaaS, PaaS, SaaS
• Example – up to 1 GB free a month, $0.01/GB between 1 GB to 10 TB per month
Network usage metrics can be applied to WAN traffic between IT resources of one cloud that are located in different geographical regions in order to calculate costs for synchronization, data replication, and related forms of processing. Conversely, LAN usage and other network traffic among IT resources that reside at the same data center are typically not tracked.
• Description – network traffic between geographically diverse IT resources of the same cloud
• Measurement – Σ, intra-cloud WAN traffic in bytes
• Frequency – continuous and cumulative over a predefined period
• Cloud Delivery Model – IaaS, PaaS, SaaS
• Example – up to 500 MB free daily and $0.01/GB thereafter, $0.005/GB after 1 TB per month
Many cloud providers do not charge for inbound traffic in order to encourage cloud consumers to migrate data to the cloud. Some also do not charge for WAN traffic within the same cloud.
Network-related cost metrics are determined by the following properties:
• Static IP Address Usage – IP address allocation time (if a static IP is required)
• Network Load-Balancing – the amount of load-balanced network traffic (in bytes)
• Virtual Firewall – the amount of firewall-processed network traffic (as per allocation time)
The allocation of virtual servers is measured using common pay-per-use metrics in IaaS and PaaS environments that are quantified by the number of virtual servers and ready-made environments. This form of server usage measurement is divided into on-demand virtual machine instance allocation and reserved virtual machine instance allocation metrics.
The former metric measures pay-per-usage fees on a short-term basis, while the latter metric calculates up-front reservation fees for using virtual servers over extended periods. The up-front reservation fee is usually used in conjunction with the discounted pay-per-usage fees.
• Description – uptime of a virtual server instance
• Measurement – Σ, virtual server start date to stop date
• Frequency – continuous and cumulative over a predefined period
• Cloud Delivery Model – IaaS, PaaS
• Example – $0.10/hour small instance, $0.20/hour medium instance, $0.90/hour large instance
• Description – up-front cost for reserving a virtual server instance
• Measurement – Σ, virtual server reservation start date to expiry date
• Frequency – daily, monthly, yearly
• Cloud Delivery Model – IaaS, PaaS
• Example – $55.10/small instance, $99.90/medium instance, $249.90/large instance
Another common cost metric for virtual server usage measures performance capabilities. Cloud providers of IaaS and PaaS environments tend to provision virtual servers with a range of performance attributes that are generally determined by CPU and RAM consumption and the amount of available dedicated allocated storage.
Cloud storage is generally charged by the amount of space allocated within a predefined period, as measured by the on-demand storage allocation metric. Similar to IaaS-based cost metrics, on-demand storage allocation fees are usually based on short time increments (such as on an hourly basis). Another common cost metric for cloud storage is I/O data transferred, which measures the amount of transferred input and output data.
• Description – duration and size of on-demand storage space allocation in bytes
• Measurement – Σ, date of storage release / reallocation to date of storage allocation (resets upon change in storage size)
• Frequency – continuous
• Cloud Delivery Model – IaaS, PaaS, SaaS
• Example – $0.01/GB per hour (typically expressed as GB/month)
• Description – amount of transferred I/O data
• Measurement – Σ, I/O data in bytes
• Frequency – continuous
• Cloud Delivery Model – IaaS, PaaS
• Example – $0.10/TB
Note that some cloud providers do not charge for I/O usage for IaaS and PaaS implementations, and limit charges to storage space allocation only.
Cloud service usage in SaaS environments is typically measured using the following three metrics:
• Description – duration of cloud service usage subscription
• Measurement – Σ, subscription start date to expiry date
• Frequency – daily, monthly, yearly
• Cloud Delivery Model – SaaS
• Example – $69.90 per month
• Description – number of registered users with legitimate access
• Measurement – number of users
• Frequency – monthly, yearly
• Cloud Delivery Model – SaaS
• Example – $0.90/additional user per month
• Description – number of transactions served by the cloud service
• Measurement – number of transactions (request-response message exchanges)
• Frequency – continuous
• Cloud Delivery Model – PaaS, SaaS
• Example – $0.05 per 1,000 transactions
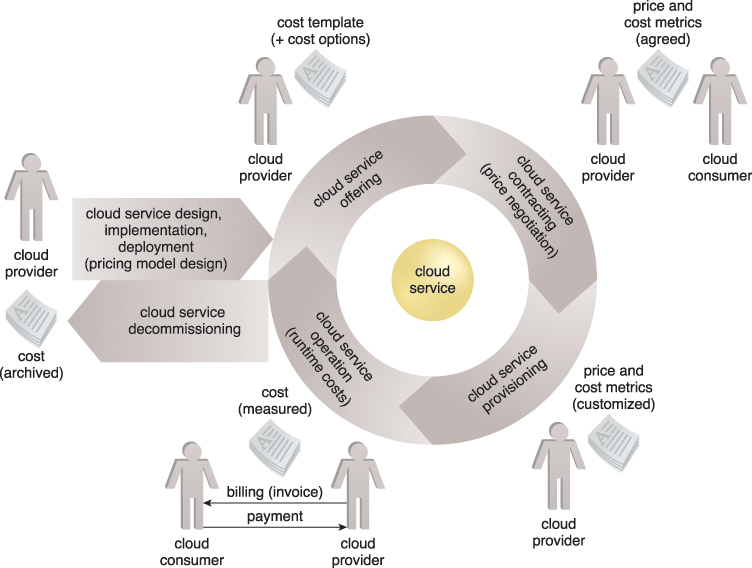
Cost management is often centered around the lifecycle phases of cloud services, as follows:
• Cloud Service Design and Development – During this stage, the vanilla pricing models and cost templates are typically defined by the organization delivering the cloud service.
• Cloud Service Deployment – Prior to and during the deployment of a cloud service, the backend architecture for usage measurement and billing-related data collection is determined and implemented, including the positioning of pay-per-use monitor and billing management system mechanisms.
• Cloud Service Contracting – This phase consists of negotiations between the cloud consumer and cloud provider with the goal of reaching a mutual agreement on rates based on usage cost metrics.
• Cloud Service Offering – This stage entails the concrete offering of a cloud service’s pricing models through cost templates, and any available customization options.
• Cloud Service Provisioning – Cloud service usage and instance creation thresholds may be imposed by the cloud provider or set by the cloud consumer. Either way, these and other provisioning options can impact usage costs and other fees.
• Cloud Service Operation – This is the phase during which active usage of the cloud service produces usage cost metric data.
• Cloud Service Decommissioning – When a cloud service is temporarily or permanently deactivated, statistical cost data may be archived.
Both cloud providers and cloud consumers can implement cost management systems that reference or build upon the aforementioned lifecycle phases. It is also possible for the cloud provider to carry out some cost management stages on behalf of the cloud consumer and to then provide the cloud consumer with regular reports.
The pricing models used by cloud providers are defined using templates that specify unit costs for fine-grained resource usage according to usage cost metrics. Various factors can influence a pricing model, such as:
• market competition and regulatory requirements
• overhead incurred during the design, development, deployment, and operation of cloud services and other IT resources
• opportunities to reduce expenses via IT resource sharing and data center optimization
Most major cloud providers offer cloud services at relatively stable, competitive prices even though their own expenses can be volatile. A price template or pricing plan contains a set of standardized costs and metrics that specify how cloud service fees are measured and calculated. Price templates define a pricing model’s structure by setting various units of measure, usage quotas, discounts, and other codified fees. A pricing model can contain multiple price templates, whose formulation is determined by variables like:
• Cost Metrics and Associated Prices – These are costs that are dependent on the type of IT resource allocation (such as on-demand versus reserved allocation).
• Fixed and Variable Rates Definitions – Fixed rates are based on resource allocation and define the usage quotas included in the fixed price, while variable rates are aligned with actual resource usage.
• Volume Discounts – More IT resources are consumed as the degree of IT resource scaling progressively increases, thereby possibly qualifying a cloud consumer for higher discounts.
• Cost and Price Customization Options – This variable is associated with payment options and schedules. For example, cloud consumers may be able to choose monthly, semi-annual, or annual payment installments.
Price templates are important for cloud consumers that are appraising cloud providers and negotiating rates, since they can vary depending on the adopted cloud delivery model.
• IaaS – Pricing is usually based on IT resource allocation and usage, which includes the amount of transferred network data, number of virtual servers, and allocated storage capacity.
• PaaS – Similar to IaaS, this model typically defines pricing for network data transferred, virtual servers, and storage. Prices are variable depending on factors such as software configurations, development tools, and licensing fees.
• SaaS – Because this model is solely concerned with application software usage, pricing is determined by the number of application modules in the subscription, the number of nominated cloud service consumers, and the number of transactions.
It is possible for a cloud service that is provided by one cloud provider to be built upon IT resources provisioned from another cloud provider. Figures 15.2 and 15.3 explore two sample scenarios.
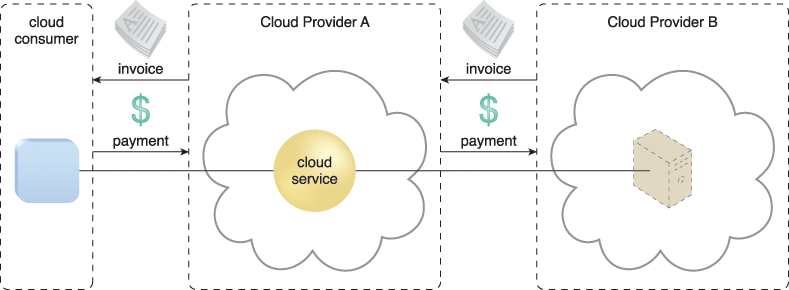
Figure 15.2 An integrated pricing model, whereby the cloud consumer leases a SaaS product from Cloud Provider A, which is leasing an IaaS environment (including the virtual server used to host the cloud service) from Cloud Provider B. The cloud consumer pays Cloud Provider A. Cloud Provider A pays Cloud Provider B.
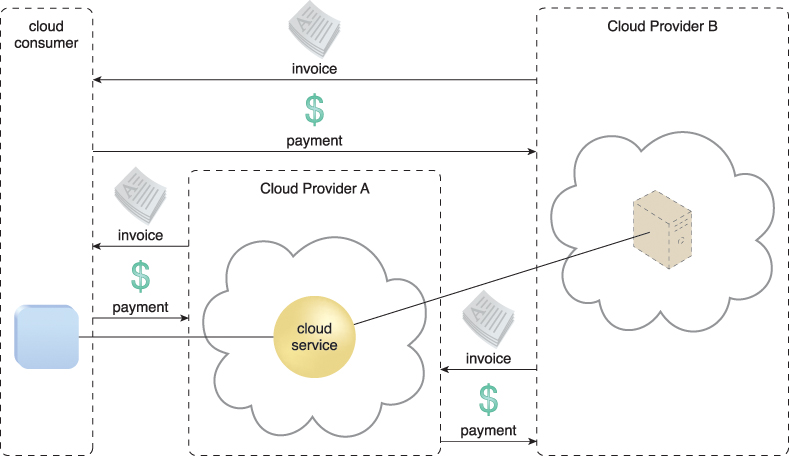
Figure 15.3 Separate pricing models are used in this scenario, whereby the cloud consumer leases a virtual server from Cloud Provider B to host the cloud service from Cloud Provider A. Both leasing agreements may have been arranged for the cloud consumer by Cloud Provider A. As part of this arrangement, there may still be some fees billed directly by Cloud Provider B to Cloud Provider A.
• Negotiation – Cloud provider pricing is often open to negotiation, especially for customers willing to commit to higher volumes or longer terms. Price negotiations can sometimes be executed online via the cloud provider’s Web site by submitting estimated usage volumes along with proposed discounts. There are even tools available for cloud consumers to help generate accurate IT resource usage estimates for this purpose.
• Payment Options – After completing each measurement period, the cloud provider’s billing management system calculates the amount owed by a cloud consumer. There are two common payment options available to cloud consumers: pre-payment and post-payment. With pre-paid billing, cloud consumers are provided with IT resource usage credits that can be applied to future usage bills. With the post-payment method, cloud consumers are billed and invoiced for each IT resource consumption period, which is usually on a monthly basis.
• Cost Archiving – By tracking historical billing information both cloud providers and cloud consumers can generate insightful reports that help identify usage and financial trends.
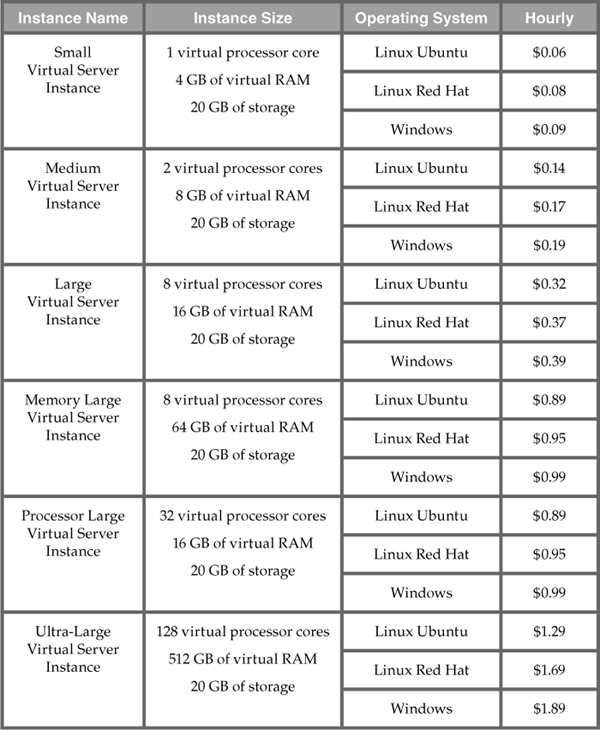
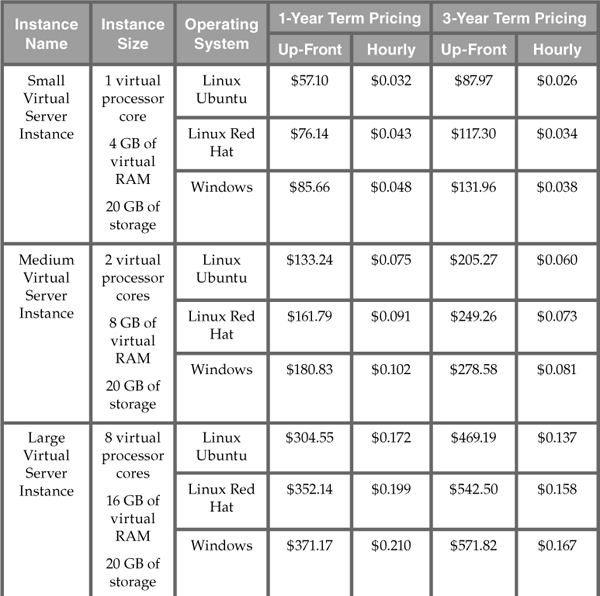
• Small Virtual Server Instance – 1 virtual processor core, 4 GB of virtual RAM, and 320 GB of storage space in the root file system.
• Medium Virtual Server Instance – 2 virtual processor cores, 8 GB of virtual RAM, and 540 GB of storage space in the root file system.
• Large Virtual Server Instance – 8 virtual processor cores, 16 GB of virtual RAM, and 1.2 TB of storage space in the root file system.
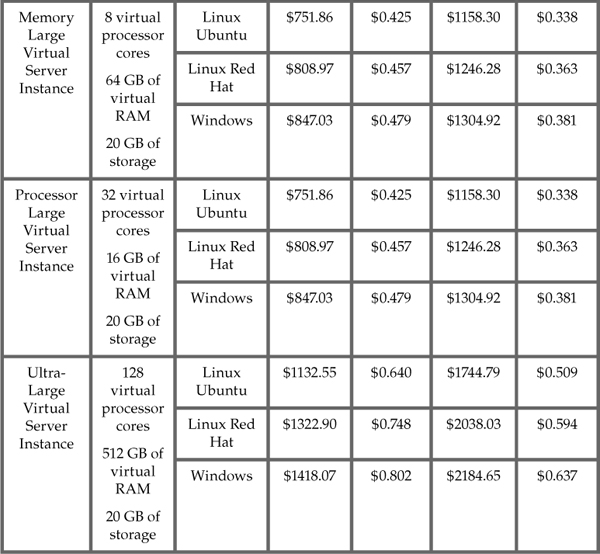
• Memory Large Virtual Server Instance – 8 virtual processor cores, 64 GB of virtual RAM, and 1.2 TB of storage space in the root file system.
• Processor Large Virtual Server Instance – 32 virtual processor cores, 16 GB of virtual RAM, and 1.2 TB of storage space in the root file system.
• Ultra-Large Virtual Server Instance – 128 virtual processor cores, 512 GB of virtual RAM, and 1.2 TB of storage space in the root file system.
• Their prices need to reflect and respond to marketplace conditions while staying competitive with other cloud offerings and remaining profitable to DTGOV.
• The client portfolio has not been established yet, as DTGOV is expecting new customers. Their non-cloud clients are expected to progressively migrate to the cloud, although the actual rate of migration is too difficult to predict.
Virtual Server On-Demand Instance Allocation
• Metric: on-demand instance allocation
• Measurement: pay-per-use charges calculated for total service consumption for each calendar month (hourly rate is used for the actual instance size when the instance has been scaled up)
• Billing Period: monthly
Virtual Server Reserved Instance Allocation
• Metric: reserved instance allocation
• Measurement: reserved instance allocation fee charged up-front with pay-per-use fees calculated based on the total consumption during each calendar month (additional charges apply for periods when the instance is scaled up)
• Billing Period: monthly
• Metric: on-demand storage allocation, I/O data transferred
• Measurement: pay-per-use charges calculated based on total consumption during each calendar month (storage allocation calculated with per hour granularity and cumulative I/O transfer volume)
• Billing Period: monthly
• Metric: outbound network usage
• Measurement: pay-per-use charges calculated based on total consumption for each calendar month (WAN traffic volume calculated cumulatively)
• Billing Period: monthly
• Price Template: $0.01/GB for outbound network data