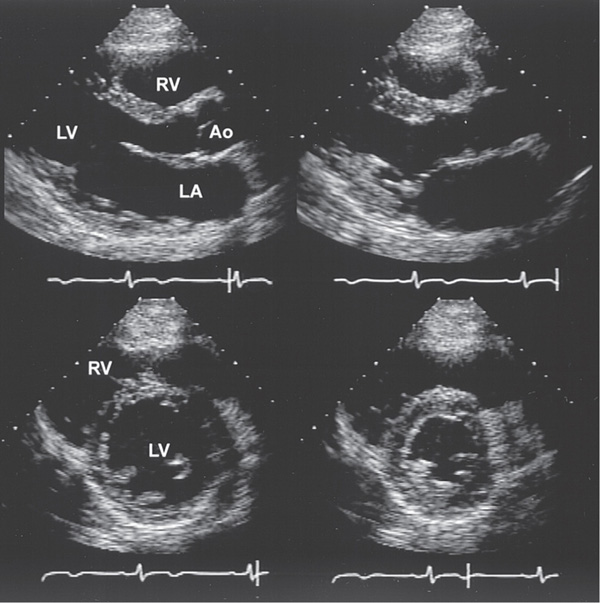
FIGURE 121-1 Two-dimensional echocardiographic still-frame images of a normal heart. Upper: Parasternal long axis view during systole and diastole (left) and systole (right). During systole, there is thickening of the myocardium and reduction in the size of the left ventricle (LV). The valve leaflets are thin and open widely. Lower: Parasternal short axis view during diastole (left) and systole (right) demonstrating a decrease in the left ventricular cavity size during systole as well as an increase in wall thickness. LA, left atrium; RV, right ventricle; Ao, aorta. (Reproduced from R.J. Myerburg: HPIM-12.)
TABLE 121-1 CLINICAL USES OF ECHOCARDIOGRAPHY

Visualizes heart in real time with ultrasound; Doppler recordings noninvasively assess hemodynamics and abnormal flow patterns. Imaging may be compromised in pts with chronic obstructive lung disease, thick chest wall, or narrow intercostal spaces.
Assessment of atrial and ventricular dimensions, global and regional systolic wall motion abnormalities, ventricular hypertrophy/infiltration, evaluation for pulmonary hypertension: RV systolic pressure (RVSP) is calculated from maximum velocity of tricuspid regurgitation (TR):

(RA pressure is same as JVP estimated by physical exam.) In absence of RV outflow obstruction, RVSP = pulmonary artery systolic pressure.
LV diastolic function is assessed by transmitral Doppler (see Fig. 229-9, p. 1844, in HPIM-18) and Doppler tissue imaging, which measures velocity of myocardial relaxation.
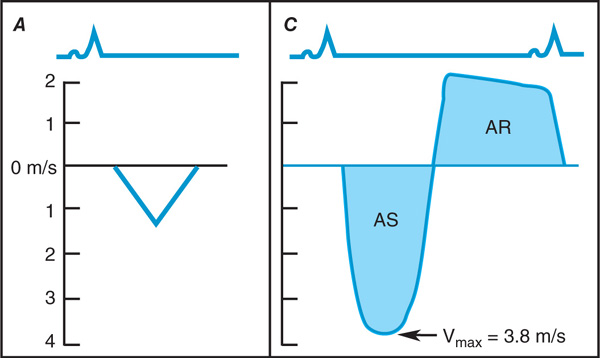
Thickness, mobility, calcification, and regurgitation of each cardiac valve can be assessed. Severity of valvular stenosis is calculated by Doppler [peak gradient = 4 × (peak velocity)2]. Structural lesions (e.g., flail leaflet, vegetation) resulting in regurgitation may be identified, and Doppler (Fig. 121-2) estimates severity of regurgitation.
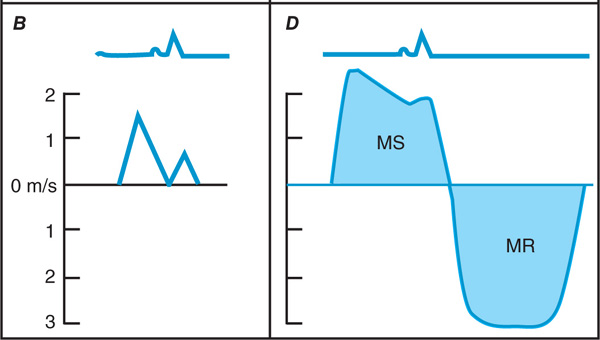
FIGURE 121-2 Schematic presentation of normal Doppler flow across the aortic A. and mitral valves B. Abnormal continuous wave Doppler profiles: C. Aortic stenosis (AS) [peak transaortic gradient = 4 × Vmax2 = 4 × (3.8)2 = 58 mmHg] and regurgitation (AR). D. Mitral stenosis (MS) and regurgitation (MR).
Echo is noninvasive modality of choice to rapidly identify pericardial effusion and assess its hemodynamic significance; in tamponade there is diastolic RA and RV collapse, dilatation of IVC, exaggerated respiratory alterations in transvalvular Doppler velocities. Actual thickness of pericardium (e.g., in suspected constrictive pericarditis) is better measured by CT or MRI.
May visualize atrial or ventricular thrombus, intracardiac tumors, and valvular vegetations. Yield of identifying cardiac source of embolism is low in absence of cardiac history or physical findings. Transesophageal echo-cardiography (TEE) is more sensitive than standard transthoracic study for masses <1 cm in diameter.
Aneurysm and dissection of the aorta may be evaluated and complications (aortic regurgitation, tamponade) assessed (Chap. 134) by standard transthoracic echo. TEE is more sensitive and specific for aortic dissection.
Echo, Doppler, and contrast echo (rapid IV injection of agitated saline) are useful to identify congenital lesions and shunts.
Echo performed prior to, and after, treadmill or bicycle exercise identifies regions of prior MI and inducible myocardial ischemia (↓ regional contraction with exercise). Dobutamine pharmacologic stress echo can be substituted for pts who cannot exercise.
Uses nuclear isotopes to assess LV perfusion and contractile function.
Blood pool imaging is obtained by injecting IV 99m Tc-labeled albumin or RBCs to quantify LV ejection fraction. Contractile function can also be assessed during gated single photon emission CT (SPECT) myocardial perfusion exercise test imaging (see below).
SPECT imaging using 201Tl or 99m Tc-labeled compounds (sestamibi or tetrofosmin) or PET imaging (82Rb or 13NH3), obtained at peak stress and at rest, depicts zones of prior infarction as fixed defects and regions of inducible myocardial ischemia as reversible defects. Nuclear imaging is more sensitive, but less specific, than stress echocardiography for detection of ischemia.
For pts who can’t exercise, pharmacologic perfusion imaging with adenosine, dipyridamole, or dobutamine is used instead (Chap. 130). For pts with LBBB, perfusion imaging with adenosine or dipyridamole is preferred to avoid artifactual septal defects that are common with exercise imaging.
Pharmacologic PET scanning is especially useful in imaging obese pts and to assess myocardial viability.
Delineates cardiac structures with high resolution without ionizing radiation. Excellent technique to characterize intracardiac masses, the pericardium, great vessels, and anatomic relationships in congenital heart disease. MRI with delayed gadolinium enhancement (avoid in pts with renal insufficiency) differentiates ischemic from nonischemic cardiomyopathy and is useful in assessing myocardial viability. Pharmacologic stress testing with MR identifies significant CAD and detects subendocardial ischemia with higher sensitivity than SPECT imaging.
Provides high-resolution images of cardiac structures and detects coronary calcification in atherosclerosis with high sensitivity (but low specificity). CT angiography delineates abnormalities of the great vessels, including aortic aneurysms and dissection, and pulmonary embolism. It is useful for assessment of pericardial thickness and calcification, cardiac masses, and arrhythmogenic RV cardiomyopathy. Multislice spiral CT provides high-resolution images of coronary anatomy. It is most useful in evaluation of suspected coronary anatomic anomalies and to exclude high-grade coronary stenoses in pts with chest pain and intermediate pretest probability of coronary artery disease. Its greatest accuracy is in detection of left main and proximal LAD and circumflex disease.
Table 121-2 summarizes key diagnostic features of the noninvasive imaging modalities. Figure 121-3 provides an algorithm for diagnostic imaging assessment of suspected CAD.
TABLE 121-2 SELECTION OF IMAGING TESTS
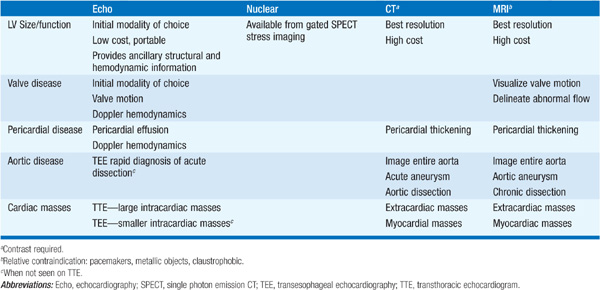
FIGURE 121-3 Flow diagram showing selection of initial stress test in a pt with chest pain. LBBB, left bundle branch block; Prev MI-Reg ischemia, previous MI with a need to detect regional ischemia; Nuc, SPECT nuclear imaging study; Pharm, pharmacologic. *Consider PET if morbidly obese or female with large/dense breasts.